

Architectural Site Analysis: A Step-by-Step Guide
A step-by-step guide to architectural site analysis, from desk research and the site visit to reading context and turning your findings into clear design decisions.
 Elif Ayse Sen14 May 20246 Mins read922

Table of Contents Show
Architectural site analysis is the structured study of a plot and its surroundings before design begins, covering climate, topography, access, zoning, and context. It turns raw site data into clear design constraints and opportunities, so the building responds to its location instead of fighting it.
Every strong project starts with reading the ground it sits on. Before a single line is drawn, an architect needs to know how the sun moves across the plot, where noise and traffic come from, how water drains, and what the neighbourhood already says about scale and material. A site analysis gathers all of this and translates it into decisions you can defend. This guide walks through how to do a site analysis in architecture step by step, from the first desk study to the diagrams you hand to the design team.
What Architectural Site Analysis Actually Involves
Site analysis is not data collection for its own sake. It is the process of interpreting a location so that its qualities shape the plan, section, and orientation of a building. The work usually splits into two layers: hard physical data such as boundaries, levels, and sun path, and softer contextual data such as cultural patterns, views, and the rhythm of the surrounding streets.
The goal is a set of findings that a designer can act on. A slope becomes a reason to step the floors. A loud road becomes a reason to place service rooms on one edge. Good analysis ends with opportunities and constraints, not just maps.
💡 Pro Tip
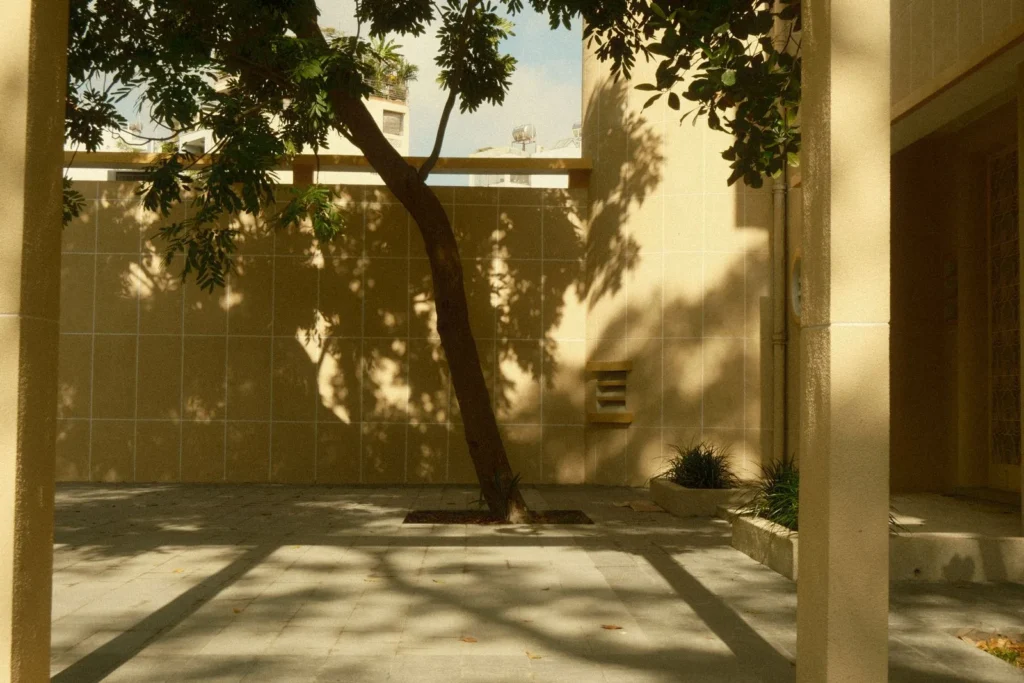
When you visit the site, photograph each boundary at eye level and note the time of day on every shot. Experienced architects rely on these timestamped images later to reconstruct shadow direction and glare, which is far more reliable than trusting memory once you are back at the desk.
How to Do a Site Analysis Step by Step
A repeatable method keeps you from missing the obvious. The sequence below moves from desk research to field work to synthesis, which is the order most practices follow.
1. Start With Desk Research
Before you set foot on site, collect what is already published. Pull the cadastral boundary, zoning rules, flood maps, and any planning history. Mapping and elevation data from public sources such as the USGS GIS portal give you contours and terrain before the first visit, and local climate records from a service like the National Weather Service tell you prevailing wind and seasonal sun angles.
2. Visit the Site and Record Conditions
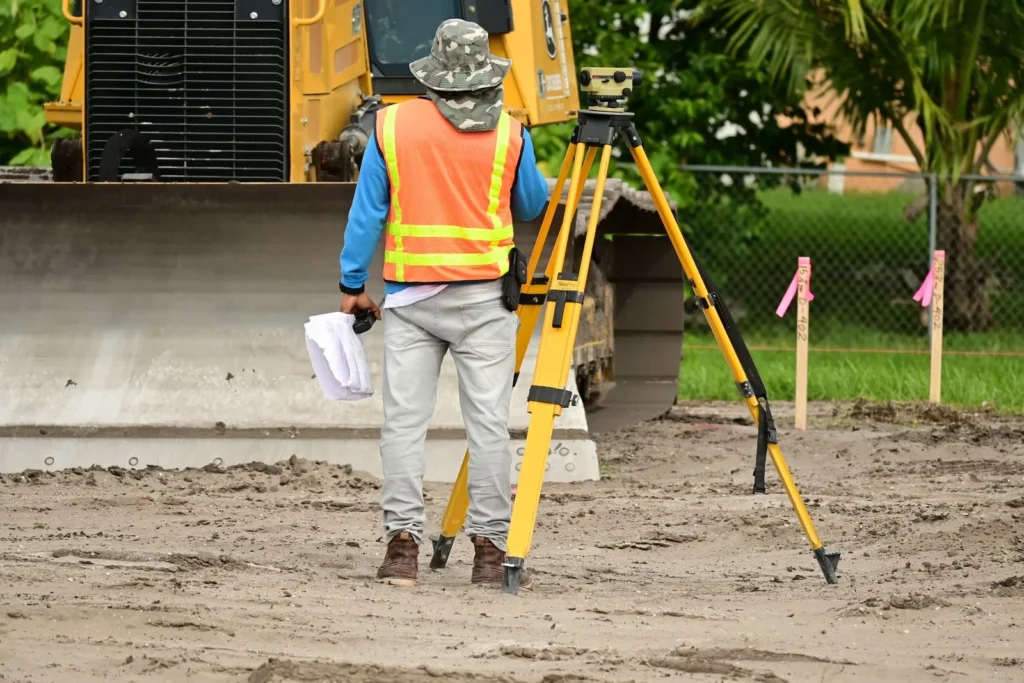
The visit confirms or corrects the desk study. Walk the full perimeter, note access points, existing trees, drainage lines, and the condition of neighbouring buildings. Record sound, smell, and how busy the edges feel at different times. These sensory notes rarely appear on a map but often drive the plan.
A short kit makes the visit productive. Bring a measuring tape or laser meter, a printed base plan to mark up by hand, a camera or phone for timestamped photos, a compass for orientation, and a notebook for impressions you cannot photograph. If the site is large or steep, a simple GPS reading at each corner helps you align field notes with the survey later. Try to visit more than once, at different times of day, so you capture how light, traffic, and shadow change across the site.
3. Map Context and Connectivity
Step back from the boundary and study how the site connects to its district. Look at pedestrian routes, public transport, sight lines, and the scale of nearby structures. Architecture media such as the ArchDaily site analysis archive show how built projects respond to context, which is a useful reference when you judge what fits.
4. Analyse Environmental Factors
Sun path, shade, wind, and microclimate decide orientation and shading strategy. Digital tools have made this faster. Platforms like Autodesk Forma run sun, wind, and noise studies on a 3D model of the site, which is why searches for digital site analysis and site analysis AI tools have grown. Whether you use software or hand studies, the output should be the same: clear evidence of where the site is comfortable and where it is not.
5. Synthesise Findings Into Diagrams
The final step converts data into site analysis diagrams. Overlay sun, access, views, and noise on a single base plan, then mark the opportunities and constraints each one creates. These diagrams become the bridge between research and the first design moves.
Reading Physical and Social Context
Context works on two levels, and both shape the design. Reading them well is what separates a building that sits comfortably in its setting from one that feels imposed.
Physical Context and Natural Features
The physical layer covers the things you can measure: existing levels, mature trees, water courses, soil, and the built edges around the plot. These features set practical limits and often suggest the first design moves. A protected tree may anchor a courtyard, a change in level may split public and private zones, and a strong boundary wall may become part of the structure rather than something to demolish.
Social and Cultural Context
The social layer is harder to map but just as real. It includes how people move through the area, where they gather, the materials and roof forms that define local character, and the history that gives a place meaning. A design that respects these patterns tends to gain easier planning support and feels rooted, while one that ignores them can read as out of place even when it is technically sound.
Site Analysis Factors and the Data to Collect
It helps to know what you are looking for before you start. The table below groups the main factors, the data each one needs, and why it matters for design.
| Factor | Data to Collect | Design Impact |
|---|---|---|
| Topography | Contours, levels, slope direction | Floor stepping, drainage, access ramps |
| Climate | Sun path, prevailing wind, rainfall | Orientation, shading, ventilation |
| Access | Vehicle and pedestrian entry, transport | Entrance position, parking, circulation |
| Context | Neighbouring scale, materials, history | Massing, facade response, height |
| Legal | Zoning, setbacks, height limits | Buildable envelope, use, density |
⚠️ Common Mistake to Avoid
A frequent error is treating site analysis as a one-time task finished before design starts. Sites reveal new information as the project develops, and skipping a second visit during schematic design often means a sun or drainage issue is caught too late, when changes are expensive.
Turning Analysis Into Design Decisions
The value of site analysis shows up when findings become choices. If the south edge gets strong afternoon sun, that may push living spaces there with deep shading. If the quietest corner sits to the north, bedrooms or study rooms can move into it. Sustainability frameworks such as LEED reward this kind of site-responsive thinking, since orientation and daylighting decisions made early have the largest effect on energy use.
📌 Did You Know?
Orientation and passive design decisions set during site analysis can influence a building’s operational energy demand by a significant margin, which is why many practices now run a digital sun and wind study on the site model before sketching a single plan.
Common Issues in Site Analysis and How to Handle Them
Even a careful study runs into problems. Knowing the usual ones in advance saves time and protects the quality of your findings.
Incomplete data is the most common. Public maps may be out of date or a boundary may be unclear, so flag any gap openly and confirm it on site rather than guessing. Conflicting readings are next: a sun study from software and a hand reading on site may disagree, usually because of nearby obstructions, so trust the field check and note why. Finally, watch for errors in your own field notes. Photographs without a time stamp, sketches without a north arrow, or measurements without a reference point all lose value once you leave the site, so build a simple labelling habit and stick to it.
Frequently Asked Questions
What is site analysis in architecture?
Site analysis in architecture is the study of a plot and its context before design, covering climate, topography, access, zoning, and surroundings. It identifies the constraints and opportunities of a location so the building can respond to it rather than ignore it.
How do you do a site analysis step by step?
Begin with desk research on boundaries, zoning, and climate, then visit the site to record real conditions. Map how the site connects to its district, analyse sun, wind, and microclimate, and finally synthesise everything into diagrams that show opportunities and constraints.
What should a site analysis include?
A complete site analysis includes topography, climate, access, legal limits, and context. Each factor should be recorded with real data and translated into a design implication, not left as a standalone map.
Can you do site analysis with digital or AI tools?
Yes. Tools such as Autodesk Forma and GIS platforms run sun, wind, noise, and terrain studies on a 3D site model, which speeds up environmental analysis. They support judgement rather than replace it, since interpreting the results into design moves is still the architect’s role.
Reading the Site Well
A careful site analysis is the difference between a building that belongs and one that simply lands on a plot. Treat it as an ongoing conversation with the location, revisit it as the design grows, and let the findings, not assumptions, guide where things go. For a deeper walkthrough with worked examples, the architecture education resource Archisoup’s site analysis guide is a useful companion to keep on hand.




Overlapping Concrete Walls and One Roof Shape a House in Okinawa
IGArchitects built Overlapping Spaces in Okinawa from reinforced concrete walls, columns and...
 illustrarch Editoral Team1 Mins read

Futuro House Production Revived in Finland After Decades-Long Hiatus
A Facebook listing for abandoned moulds led to the first new Futuro...
illustrarch Editoral Team3 Mins read
Building Your Dream Home in NSW: What You Should Know About Montgomery Homes
Montgomery Homes has been building across Sydney, Newcastle, the Hunter, Wollongong and...
illustrarch Editoral Team4 Mins read

Designing a Home Theater: Where Drapery Fits Into the Plan
In a media room the curtains are a performance layer, not decoration....
illustrarch Editoral Team3 Mins read


Leave a comment