

Free Online Bubble Diagram Maker & Tool
Effortlessly create detailed and visually engaging architectural bubble diagrams to streamline your design process, visualize spatial relationships, and plan functional layouts with clarity and ease.
How to Make a Bubble Diagram: The Complete Guide to Architectural Bubble Diagrams
A bubble diagram in architecture is a freeform schematic that uses circles to represent programmatic spaces and connecting lines to show their relationships, created before formal plans begin. Used since the mid-20th century by architects from Le Corbusier to contemporary BIM-era practices, these diagrams map adjacency, hierarchy, circulation, and functional flow in minutes rather than hours. This guide covers what they are, how to make one step by step, the best free tools, and real project examples.
At this early stage, bubble diagrams also act as a low-risk testing ground where ideas can be challenged, rearranged, or discarded without the cost of detailed drawings or models. They encourage architects to think relationally rather than formally, focusing on how spaces interact before committing to dimensions, materials, or structure. This flexibility makes them especially powerful in collaborative settings, where clients, consultants, and design teams can quickly grasp intentions and contribute feedback. Whether sketched on tracing paper or created with a bubble diagram maker online, these diagrams create a shared conceptual framework, helping transform abstract programmatic needs into coherent architectural strategies that can confidently evolve into built form.
What Is a Bubble Diagram in Architecture? Definition and Purpose
A bubble diagram is a free-form spatial schematic in which “bubbles” (usually loose circles or ovals) represent programmatic elements—classrooms, courtyards, mechanical cores—and their relative size, overlap, or distance conveys relationships. The bubble diagram architecture definition can be summarized as: a conceptual planning tool that visualizes spatial relationships, adjacencies, and circulation patterns before formal design begins. Thickness of connecting lines can suggest intensity of circulation or visual connectivity. Because the bubbles are abstract, designers remain unencumbered by walls, grids, or structural systems too early. This liberates creative problem-solving, yet still grounds discussion in measurable requirements such as square footage, daylight needs, or acoustic isolation. Beyond simple adjacency studies, bubble diagrams architecture function as a thinking tool that helps architects prioritize programmatic intent over formal appearance. By adjusting bubble size, designers can quickly test proportional relationships, identify conflicts between uses, or reveal opportunities for shared spaces and efficient circulation loops. Overlapping bubbles may indicate hybrid zones or flexible areas, while separation can signal the need for privacy or environmental control. As the diagram evolves, it becomes a visual record of design decisions, capturing the logic behind spatial organization and providing a clear bridge between abstract programming and more resolved diagrams such as zoning plans, block diagrams, or early massing studies.
Why Bubble Diagrams Still Matter in a BIM-Dominated World
Rapid Ideation Without Technical Overhead
Opening a bubble diagram maker offers a deliberately lightweight starting point, free from the immediate demands of walls, layers, or levels of detail. Instead of negotiating technical parameters, designers can focus on spatial relationships, flows, and priorities, using simple shapes and connections to explore ideas quickly. In design sprints or collaborative sessions, this low-friction environment makes it possible to generate, compare, and revise multiple spatial scenarios within minutes, encouraging experimentation without the burden of technical commitment. Just as importantly, working within a bubble diagram maker architecture tool protects early-stage thinking from being prematurely shaped by software logic. While BIM platforms excel at coordination and resolution, they often push projects toward constructability before meaning is fully articulated. Bubble diagram tools invert this sequence by allowing program clarity and experiential intent to be established first. When these diagrams are later translated into BIM environments, the model is no longer searching for direction—it is executing a spatial concept that has already been explored, tested, and refined at its most fundamental level.

Stakeholder Alignment
Clients and non-architect stakeholders often struggle to read plans or sections, but they instinctively grasp bubbles. Seeing their priorities literally take shape creates shared understanding and accelerates feedback cycles. A bubble diagram architecture example turns abstract requirements—such as keeping public and private zones separate or placing collaborative areas at the heart of the building—into an immediately legible visual story. This clarity reduces misinterpretation early on, when changes are inexpensive and strategic rather than corrective. More importantly, bubble diagrams invite dialogue instead of passive approval. Stakeholders feel empowered to point, question, and suggest adjustments because the diagram speaks a universal visual language rather than professional shorthand. This collaborative clarity often leads to faster consensus, fewer revisions downstream, and a stronger sense of ownership among clients, who can clearly see how their needs and values are embedded in the spatial logic of the project.
Data-Driven Space Planning
Modern bubble diagramming apps—such as Bubble Diagram Maker for iPad and macOS—allow tags for area, adjacency scores, or carbon benchmarks. When exported to BIM software, those attributes become quantifiable inputs rather than after-the-fact annotations. This transforms bubble diagrams from purely conceptual sketches into intelligent data containers that inform decisions from the very first design moves. As a result, early-stage planning becomes both creative and analytical. Designers can test scenarios against performance goals—optimizing proximity for efficiency, reducing circulation waste, or aligning space relationships with sustainability targets—long before detailed models exist. By embedding data at the diagram stage, architects create a smoother handoff into BIM workflows, ensuring that design intent, performance metrics, and programmatic logic evolve together rather than being reconciled late in the process.

Sustainability and Wellness Goals
Early spatial zoning directly impacts daylight penetration, natural ventilation paths, and biophilic sightlines. If these ambitions are embedded in the first bubble pass, subsequent design stages inherit—and refine—them instead of retrofitting. By positioning high-occupancy spaces along favorable orientations and grouping service areas as buffers, bubble diagrams help architects align environmental performance with programmatic logic from the outset. Just as importantly, bubble diagrams allow wellness strategies to be discussed in human terms before they are reduced to technical metrics. Visualizing relationships between work areas, outdoor spaces, quiet zones, and circulation encourages design decisions that support human well-being, comfort, and long-term usability. When sustainability and wellness are treated as foundational spatial ideas rather than checklist items, the resulting architecture is more cohesive, resilient, and genuinely responsive to the people who inhabit it.
How to Make a Bubble Diagram: Step-by-Step Process
 Understanding how to make a bubble diagram architecture projects rely on begins with a clear methodology. Whether you are a student learning the basics or a professional refining your workflow, following these steps will help you create effective spatial diagrams.
Step 1: List Your Program Requirements
Before opening any bubble diagram maker free tool or picking up a pencil, compile a list of all spaces needed. Include approximate square footages, occupancy requirements, and any special conditions like natural light needs or acoustic isolation.
Step 2: Identify Relationships and Adjacencies
Determine which spaces must be adjacent, which should be separated, and which could share resources. A simple matrix with “must be near,” “should be near,” and “must be away from” columns is an efficient starting point. For a deeper look at this technique, see the detailed guide on understanding architectural bubble diagrams.
Step 3: Begin with Primary Zones
Place the largest or most important programmatic elements first. These anchor bubbles establish the basic organizational structure. Draw larger circles for spaces requiring more area.
Step 4: Add Secondary Spaces
Position supporting spaces around your primary zones based on the adjacency requirements identified earlier. Adjust bubble sizes proportionally to reflect relative area needs.
Step 5: Draw Connections
Use lines to indicate circulation paths and relationships. Thicker lines suggest stronger connections or higher traffic, while dashed lines might indicate visual connections without physical adjacency.
Step 6: Iterate and Refine
This is the crucial step—test multiple arrangements. A good bubble diagram maker online tool allows rapid iteration, letting you explore alternatives in minutes rather than hours. Check the full guide on creating bubble diagrams for more detailed techniques.
Video: Bubble Diagram Walkthrough
Watching a complete bubble diagram session from start to finish is one of the fastest ways to understand the process. The video below demonstrates how experienced architects move from a blank page to a resolved spatial diagram, covering zone placement, adjacency decisions, and iterative refinement in real time.
Bubble Diagram Examples: From Residential to Institutional

Looking at concrete examples is the most direct way to understand how abstract program lists become spatial diagrams. The cases below cover the three program scales where bubble diagram samples appear most commonly.
Residential House Bubble Diagram
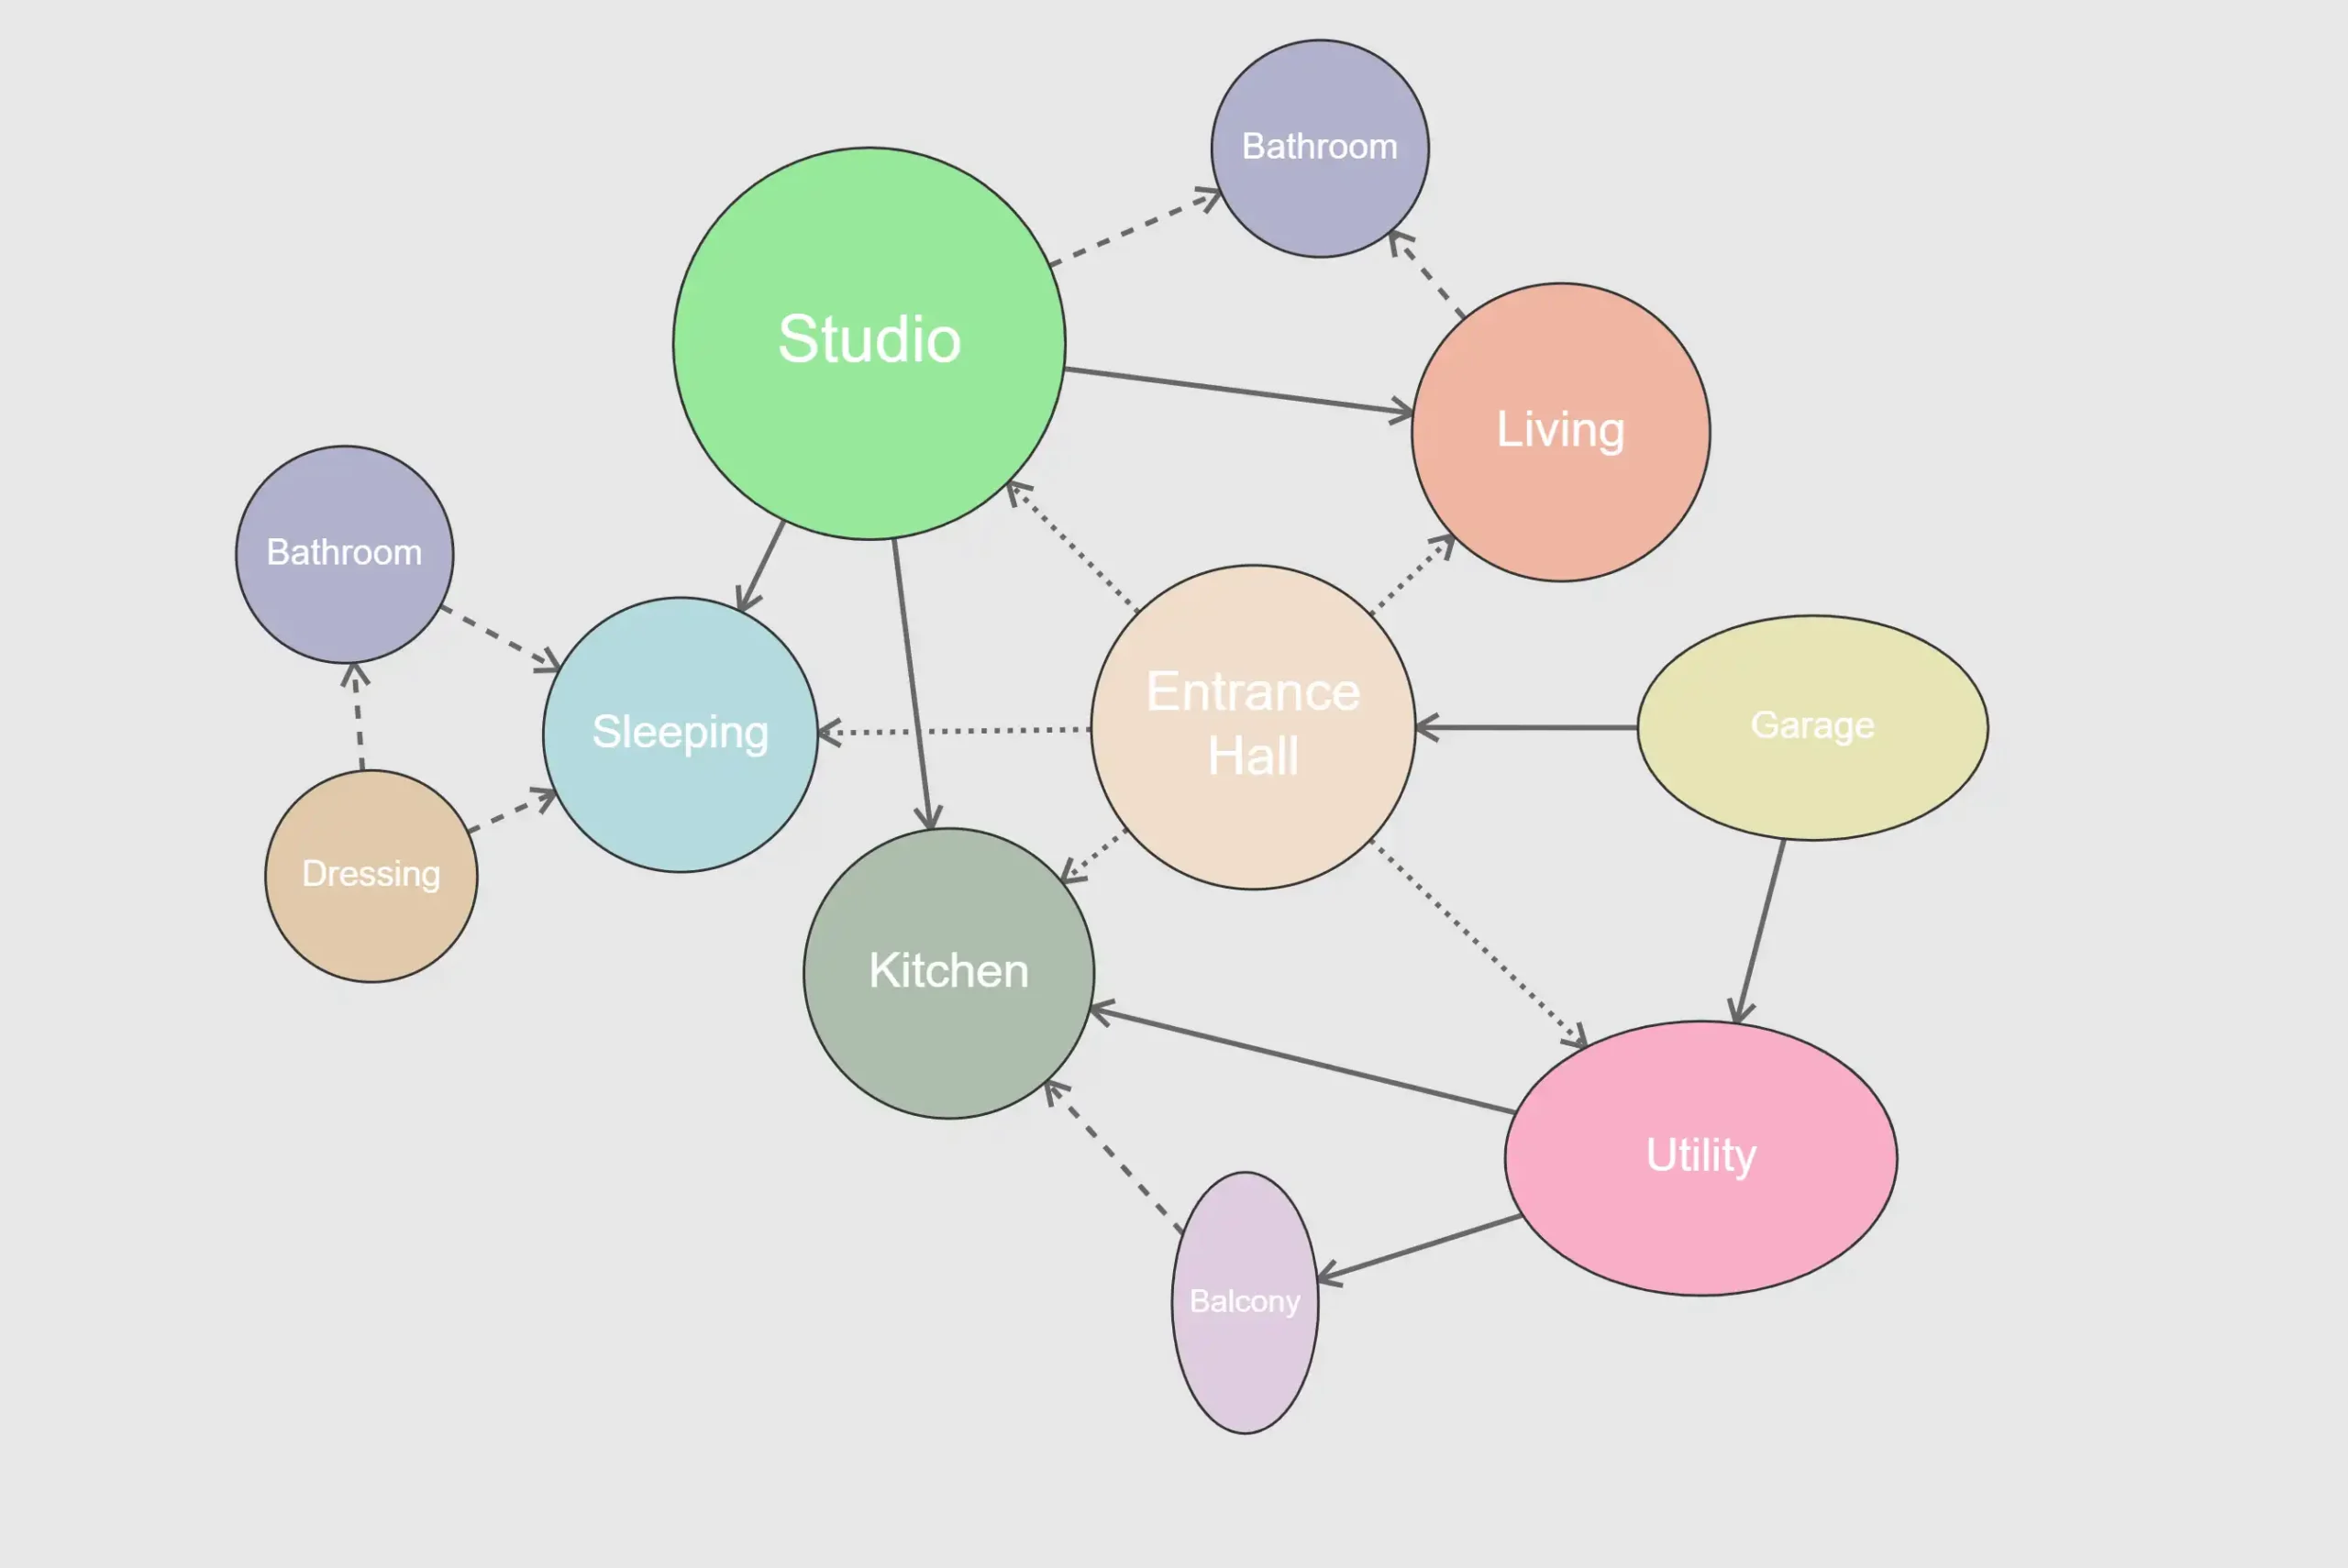
A typical bubble diagram architecture house layout groups the kitchen as a hub connecting dining, living, and service areas, while bedrooms are buffered by corridors or bathrooms from shared spaces. The public zone (entry, living, dining) sits closest to the street, and private zones (bedrooms, study) shift toward the rear or upper level. Overlapping the kitchen bubble with both the dining and the outdoor terrace bubble signals a design intention to allow direct flow between those three spaces—a decision that survives into the finished floor plan.
Educational Building Bubble Diagram
In a school or university building, classrooms cluster around shared resources—library, labs, maker spaces—with a clear circulation spine linking them. Administrative functions buffer academic zones from the public entrance. The bubble diagram makes it immediately visible if, for example, the science labs are positioned too far from the prep rooms or if there is no adequate acoustic buffer between the music suite and quiet study areas.
Commercial and Mixed-Use Bubble Diagram
Commercial diagrams separate front-of-house customer flow from back-of-house operations. Service corridors, loading areas, and staff circulation remain invisible to the public. In mixed-use towers, the diagram must also resolve vertical adjacencies—retail at grade, office floors above, residential at the top—before any section drawing is attempted. This is where 3D bubble diagram architecture approaches become essential.
At the Beginning: Bubble Diagrams as Sources of Inspiration
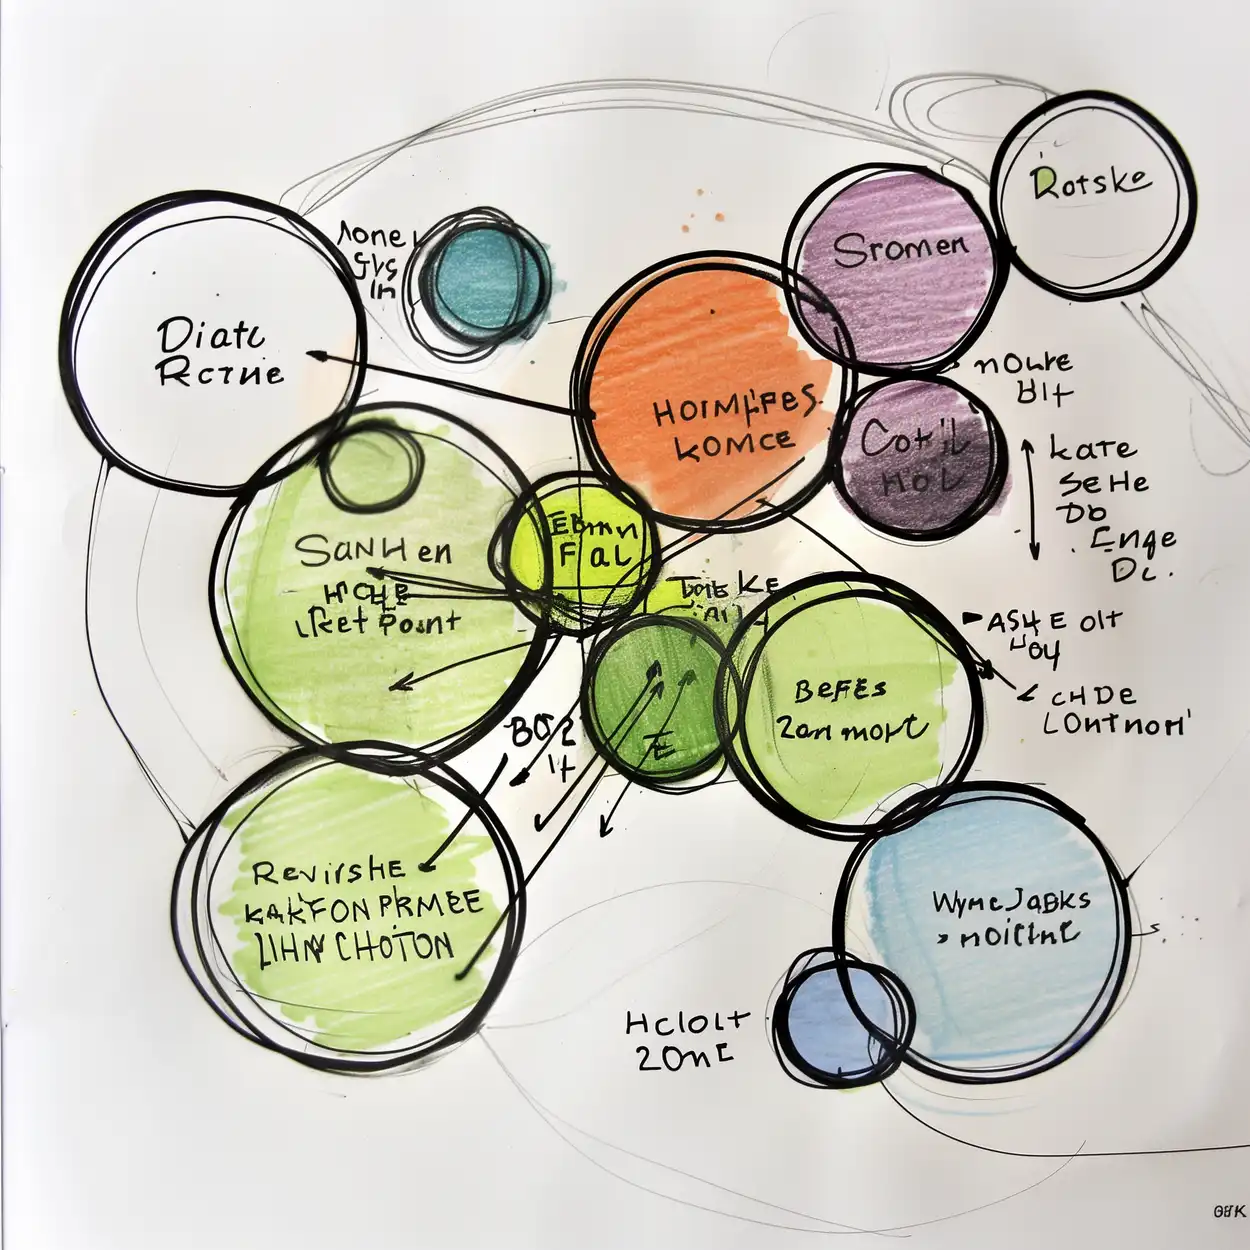
Inspiration for creating bubble diagrams in architecture often begins not with form, but with observation and curiosity about relationships. Rather than treating architecture bubble diagrams as purely functional planning tools, architects can use them as exploratory drawings that translate lived experience, movement, and hierarchy into spatial logic. Studying how people circulate through everyday environments, how activities overlap or conflict, and how privacy gradients naturally emerge can inform more intuitive diagramming. References from unrelated fields—such as choreography, landscape patterns, cellular structures, or even social networks—can also enrich bubble diagrams by introducing non-linear thinking. By sketching freely, allowing overlaps, distortions, and repetitions, designers can move beyond rigid program boxes and instead develop diagrams that reflect atmosphere, intensity, and interaction. In this sense, bubble diagrams become not just a step toward plans, but a conceptual space where architectural ideas are tested, questioned, and discovered.
As a Tool for Spatial Expression
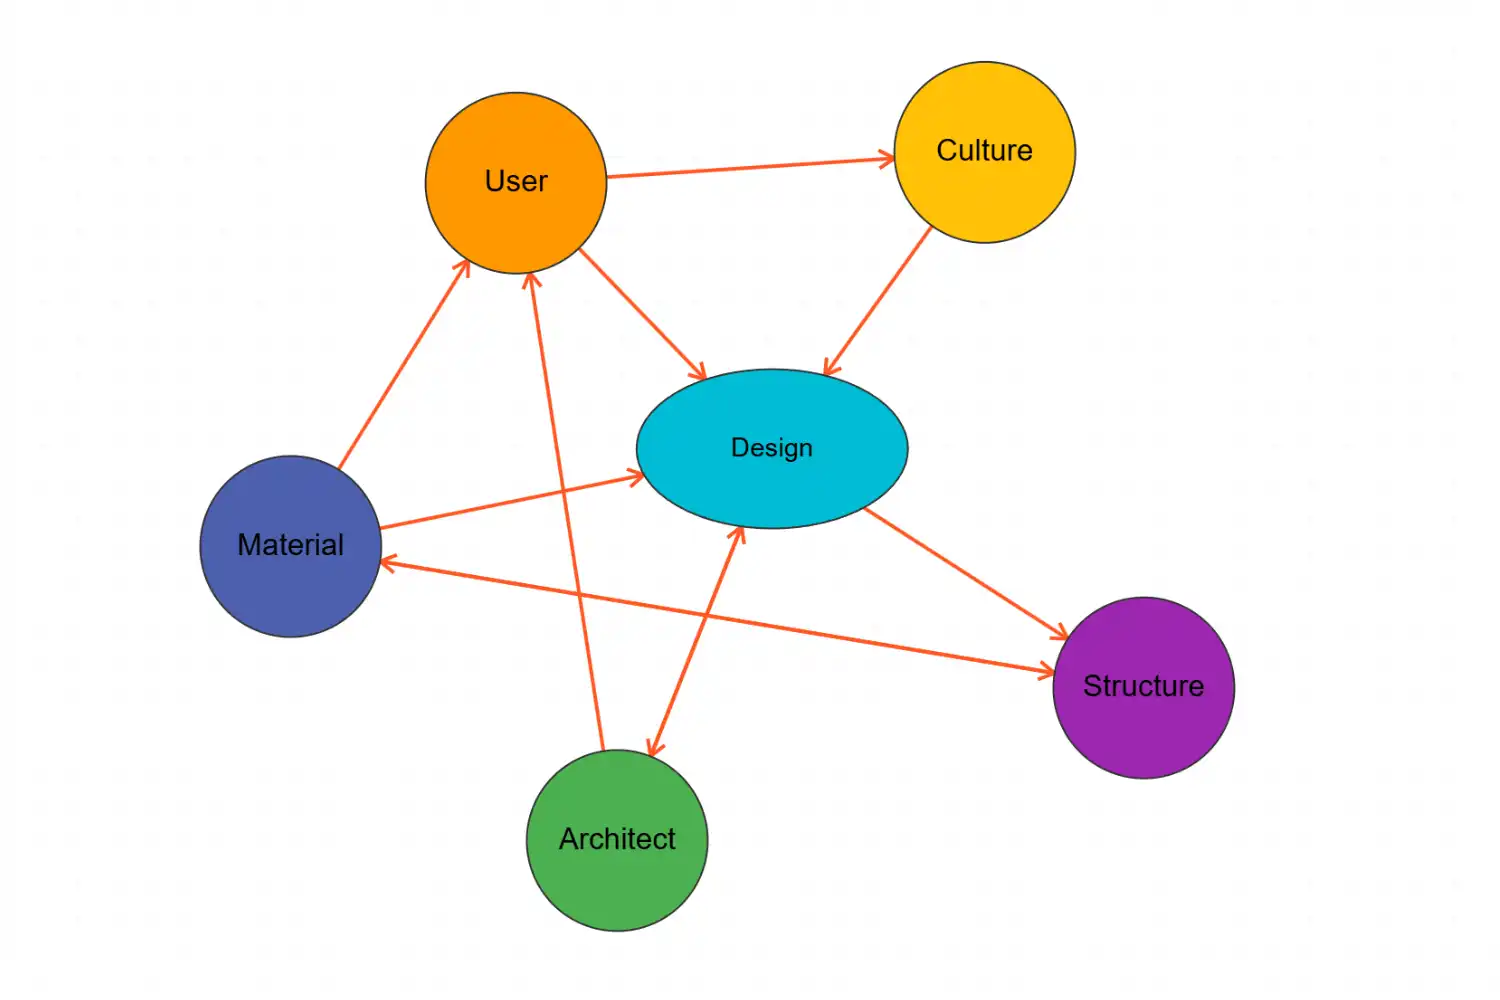
Understanding and expressing spatial ideas through bubble diagrams is fundamental to architectural thinking because it allows designers to externalize complex relationships before they become fixed as form. Bubble diagram architecture operates as a shared language between intuition and logic, making abstract intentions—such as proximity, hierarchy, flow, and separation—visually legible. At this early stage, ideas remain flexible; spaces can expand, contract, overlap, or disconnect without the constraints of structure or dimension. This openness encourages critical questioning: why certain functions must be adjacent, how movement influences experience, and where tensions or synergies emerge. By translating mental concepts into diagrammatic form, architects clarify their own reasoning while also communicating it effectively to collaborators, clients, and educators. In this way, bubble diagrams are not merely preparatory sketches but essential tools for shaping spatial intelligence and design intent.

Best Free Bubble Diagram Makers Online for Architects
When learning how to make bubble diagram layouts efficiently, choosing the right tool matters. The options below range from purpose-built architecture tools to general diagramming platforms. For a full comparison, see the roundup of best online bubble diagram makers for architects and students.
Dedicated Architecture Tools
Purpose-built applications like the Illustrarch Bubble Diagram Maker—a free browser-based tool with no installation required—offer architecture-specific features including area labeling, customizable connections, and PNG export. These bubble diagram maker architecture tools understand the unique needs of spatial planning and keep the interface minimal so designers stay focused on relationships rather than software menus. Archisoup also provides detailed guidance on the technique alongside its own student-focused resources.
General Diagramming Platforms
Tools like Miro, Lucidchart, and Figma offer bubble diagram maker free tiers that work well for basic architectural diagrams. While not architecture-specific, their flexibility and collaboration features make them popular choices, especially for remote teams working across time zones.
How to Make a Bubble Diagram in Word
Microsoft Word’s shape tools provide a straightforward method for creating basic bubble diagrams. Insert circles using the Shapes menu, resize them proportionally to represent different space requirements, and use connectors or lines to show relationships. While limited compared to dedicated tools, Word offers accessibility—most people already have it installed and know how to use it.
How to Make a Bubble Diagram in PowerPoint
PowerPoint offers more flexibility than Word for bubble diagram floor plan maker tasks. The larger canvas, easier shape manipulation, and presentation-ready output make it practical for client meetings. Use SmartArt for quick layouts, or build custom diagrams using circles and connectors. The animation features can even show how spatial thinking evolved through multiple iterations.
Practical Advantages of Using a Bubble Diagram Maker
Using an architectural bubble diagram maker can dramatically streamline the early stages of design by offering a layer-based, intuitive workspace that keeps ideas organized and flexible. These tools often allow you to stack layers, so you can separate programmatic zones, movement paths, and spatial relationships without cluttering your drawing—turning complex thinking into a clear visual hierarchy. Most free bubble diagram maker options prioritize a basic interface with simple drag-and-drop controls, editable shapes, and quick labeling, which makes sketching faster than traditional hand drawing while still preserving creativity. The speed of adjusting bubbles—resizing, recoloring, rearranging, moving—means you can iterate multiple concepts in minutes, test alternatives, and communicate options to clients or teammates without friction.

Testing Spatial Adjacencies
Using a bubble diagram maker, architects can quickly define and adjust spatial relationships such as a living room directly connected to a dining area to support social interaction, or a kitchen positioned between dining and service spaces to optimize circulation. More private zones can be explored by placing a bedroom buffered by a corridor or storage space to reduce noise, or by linking a bedroom with an ensuite bathroom to establish privacy and functional efficiency. Transitional relationships are also easy to test, such as a foyer acting as a threshold between public and private areas, or a courtyard connecting interior living spaces with outdoor zones. In larger programs, bubble diagrams can illustrate adjacencies like classrooms clustered around a shared common space, offices arranged around a central circulation spine, or public functions separated from service areas while remaining visually or spatially connected. These simple diagrammatic relationships help transform abstract program lists into readable spatial logic before any fixed geometry is introduced.

How to Make a Bubble Diagram for Interior Design Projects
Understanding how to make a bubble diagram interior design projects benefit from requires a slightly different approach than building-scale architecture. Interior designers focus on room-to-room relationships, furniture zones, and user flow patterns within existing constraints. The process emphasizes traffic patterns between cooking, dining, and relaxing areas; sight lines and privacy gradients; furniture groupings and activity zones; and natural light distribution throughout spaces. When creating interior bubble diagrams, start with the fixed elements—doors, windows, structural columns—then overlay your programmatic bubbles to test how daily activities will flow through the space. A bubble diagram floor plan maker approach helps interior designers communicate spatial intent to clients before committing to specific furniture selections or partition locations.
Bubble Diagram Architecture Template: Starting Points for Common Programs
While every project is unique, certain bubble diagram architecture template patterns recur across building types. Understanding these common organizational strategies can accelerate your diagramming process. Residential Templates: Typically organize around public/private gradients, with living spaces clustered near entries and bedrooms buffered by corridors or service spaces. The bubble diagram architecture house template often shows kitchen as a hub connecting dining, living, and service areas. Educational Templates: Cluster classrooms around shared resources (libraries, labs, common areas) with clear circulation spines. Administrative functions often buffer academic spaces from public entries. Commercial Templates: Balance front-of-house customer experience with back-of-house operations, using service corridors to separate flows.
3D Bubble Diagram Architecture: Adding the Vertical Dimension
As projects grow in complexity, 3D bubble diagram architecture approaches become increasingly valuable. Traditional two-dimensional diagrams work well for single-floor projects, but multi-story buildings require understanding vertical relationships—how a lobby connects to upper floors, where mechanical systems stack, or how natural light penetrates through atriums. Three-dimensional bubble diagrams can be created through simple axonometric sketches, stacked plan diagrams with vertical connectors, or dedicated 3D modeling tools. The key is maintaining the abstraction that makes bubble diagrams valuable while adding the spatial complexity that multi-level projects demand. Some bubble diagram maker online tools now offer 3D capabilities, allowing architects to explore volumetric relationships before committing to detailed massing studies.
Bubble Diagrams as Knowledge Artifacts: Capturing Design Logic
Architectural bubble diagrams are not only tools for generating form; they are repositories of architectural reasoning. Each adjacency, overlap, or separation encodes a decision about use, movement, hierarchy, or experience. When documented and refined, these diagrams become knowledge artifacts—visual records that explain why a building is organized the way it is, not just how it looks. In academic, professional, and public-facing contexts, this explanatory power is critical. Bubble diagrams allow architects to externalize thought processes that are often invisible in finished drawings or renderings. They reveal the negotiation between competing requirements—public versus private, efficiency versus delight, flexibility versus control—making design intent legible long before form is finalized. For students learning how to make bubble diagram architecture assignments, these diagrams clarify spatial logic and decision-making strategies. For professionals, they support internal reviews, competitions, and client discussions by grounding proposals in clear organizational narratives. And for the broader architectural discourse, bubble diagrams serve as compact, visual essays—distilling complex programs and constraints into intelligible spatial arguments. In this sense, the bubble diagram in architecture is not just a step in the process, but a communicative medium that carries architectural intelligence across audiences, phases, and scales. 
Real-World Inspiration: Projects Shaped by Bubble Diagrams
Louis Kahn’s Exeter Library (1965) began as interlocking circles denoting concentric study rings around a lightwell, seeding the eventual iconic atrium. This bubble diagram architecture example demonstrates how early diagrammatic thinking can survive into built form. The diagrams clarified the relationship between individual study, communal reading, and structural order, allowing Kahn to preserve a powerful spatial hierarchy even as the project evolved into a rigorously detailed brick and concrete form. Norman Foster’s Apple Park (2017) relied on nested bubbles to balance departmental adjacencies within the ring, then refined them into modular “pods” that maximize daylight and team flexibility.  At Bjarke Ingels Group, the LEGO House (2017) translated bubble logic almost literally into built form. Distinct program nodes—Play Zones, the Masterpiece Gallery, and the public square—were conceived as stacked, interlocking volumes, each maintaining its identity while contributing to a cohesive whole. The project demonstrates how a clear architectural bubble diagram can survive the full journey from concept to construction, proving that early spatial thinking is not something to be “designed away,” but something to be amplified through architecture.
Further Learning: Recommended Resources on Bubble Diagrams
The resources below offer additional depth for students and professionals who want to go further with bubble diagram technique. The Archisoup bubble diagram guide is one of the most detailed free references available, covering color coding, line types, and the transition from diagram to schematic plan. The learnarchitecture.net guide on creating bubble diagrams walks through the process with a step-by-step format suited to students. For competition-focused applications, the best bubble diagram samples series on illustrarch shows how to use diagrams to communicate with a jury efficiently. The AIA Architect’s Handbook of Professional Practice addresses programming and pre-design tools including bubble diagrams in a professional context.
Future Directions: AI-Generated Bubble Diagrams
Generative design platforms are increasingly extending the role of architectural diagrams by producing bubble diagram scenarios derived from vast sets of spatial-performance permutations. By processing inputs such as program requirements, site constraints, circulation needs, and environmental targets, these systems can generate and rank diagrammatic layouts according to criteria like daylight access, adjacency efficiency, egress clarity, or embodied carbon impact. Within seconds, designers can review multiple spatial arrangements that would be impossible to explore through manual sketching alone. At their most effective, AI-generated bubble diagrams expose non-obvious spatial connections and challenge habitual planning logics, prompting architects to reconsider assumed relationships between functions. Importantly, this shift does not diminish architectural authorship. Instead, AI operates as a rapid hypothesis generator, offering diagrammatic suggestions rather than definitive solutions. Each output remains an abstract proposition that gains meaning only through human judgment, contextual awareness, and narrative intent. The architect’s role evolves toward selection, interpretation, and refinement—transforming optimized spatial diagrams into architecture that communicates cultural purpose, experiential quality, and design intelligence.

- A bubble diagram is a freeform spatial schematic using circles and connecting lines to represent program spaces and their relationships, created before technical drawings begin.
- The six-step process—list program, define adjacencies, place primary zones, add secondary spaces, draw connections, then iterate—applies from a single apartment to a university campus.
- Free tools including the Illustrarch Bubble Diagram Maker make the process accessible in a browser without any installation.
- Design changes made during the bubble diagram phase cost a fraction of what the same changes cost after construction documents are complete.
- AI-assisted diagramming tools are emerging but do not replace human judgment; they expand the range of spatial configurations a designer can evaluate quickly.
Conclusion
Creating diagrams with a bubble diagram maker distills architecture’s central challenge—shaping human experience through space—into a clear and accessible digital workflow. By removing premature formal decisions, these tools allow architects to concentrate on spatial relationships, priorities, and intent, using a flexible interface that bridges intuition and structured data. Layer controls, editable connections, and rapid iteration make it possible to test adjacencies, hierarchies, and circulation logic with speed and clarity, while supporting integration with broader digital design workflows. Whether you are learning how to make a bubble diagram for the first time or generating multiple layout variations with a bubble diagram maker online, these tools help designers think clearly, communicate spatial logic confidently, and develop ideas efficiently. The ease of adjusting, duplicating, and comparing diagram versions strengthens decision-making at the earliest stages of design. More than a productivity tool, the architectural bubble diagram maker supports the architectural narrative—ensuring that the logic of space remains coherent and intentional from the first conceptual sketch to the foundations of a built project. Keywords: Bubble Diagram Maker, Architectural Bubble Diagram, How to Make a Bubble Diagram, Bubble Diagram Architecture, Free Bubble Diagram Maker Online, Bubble Diagram Floor Plan, 3D Bubble Diagram Architecture, Bubble Diagram Interior Design
Want to compare other options first? See our roundup of the best online bubble diagram makers for architects.
