

How to Create Bubble Diagrams for Architecture and Interior Design
Learn how to create bubble diagrams for architecture and interior design projects. This step-by-step guide covers what a bubble diagram is, how to draw one, the best free tools for spatial planning, and practical examples — from bubble diagram house layouts to floor plan transitions.

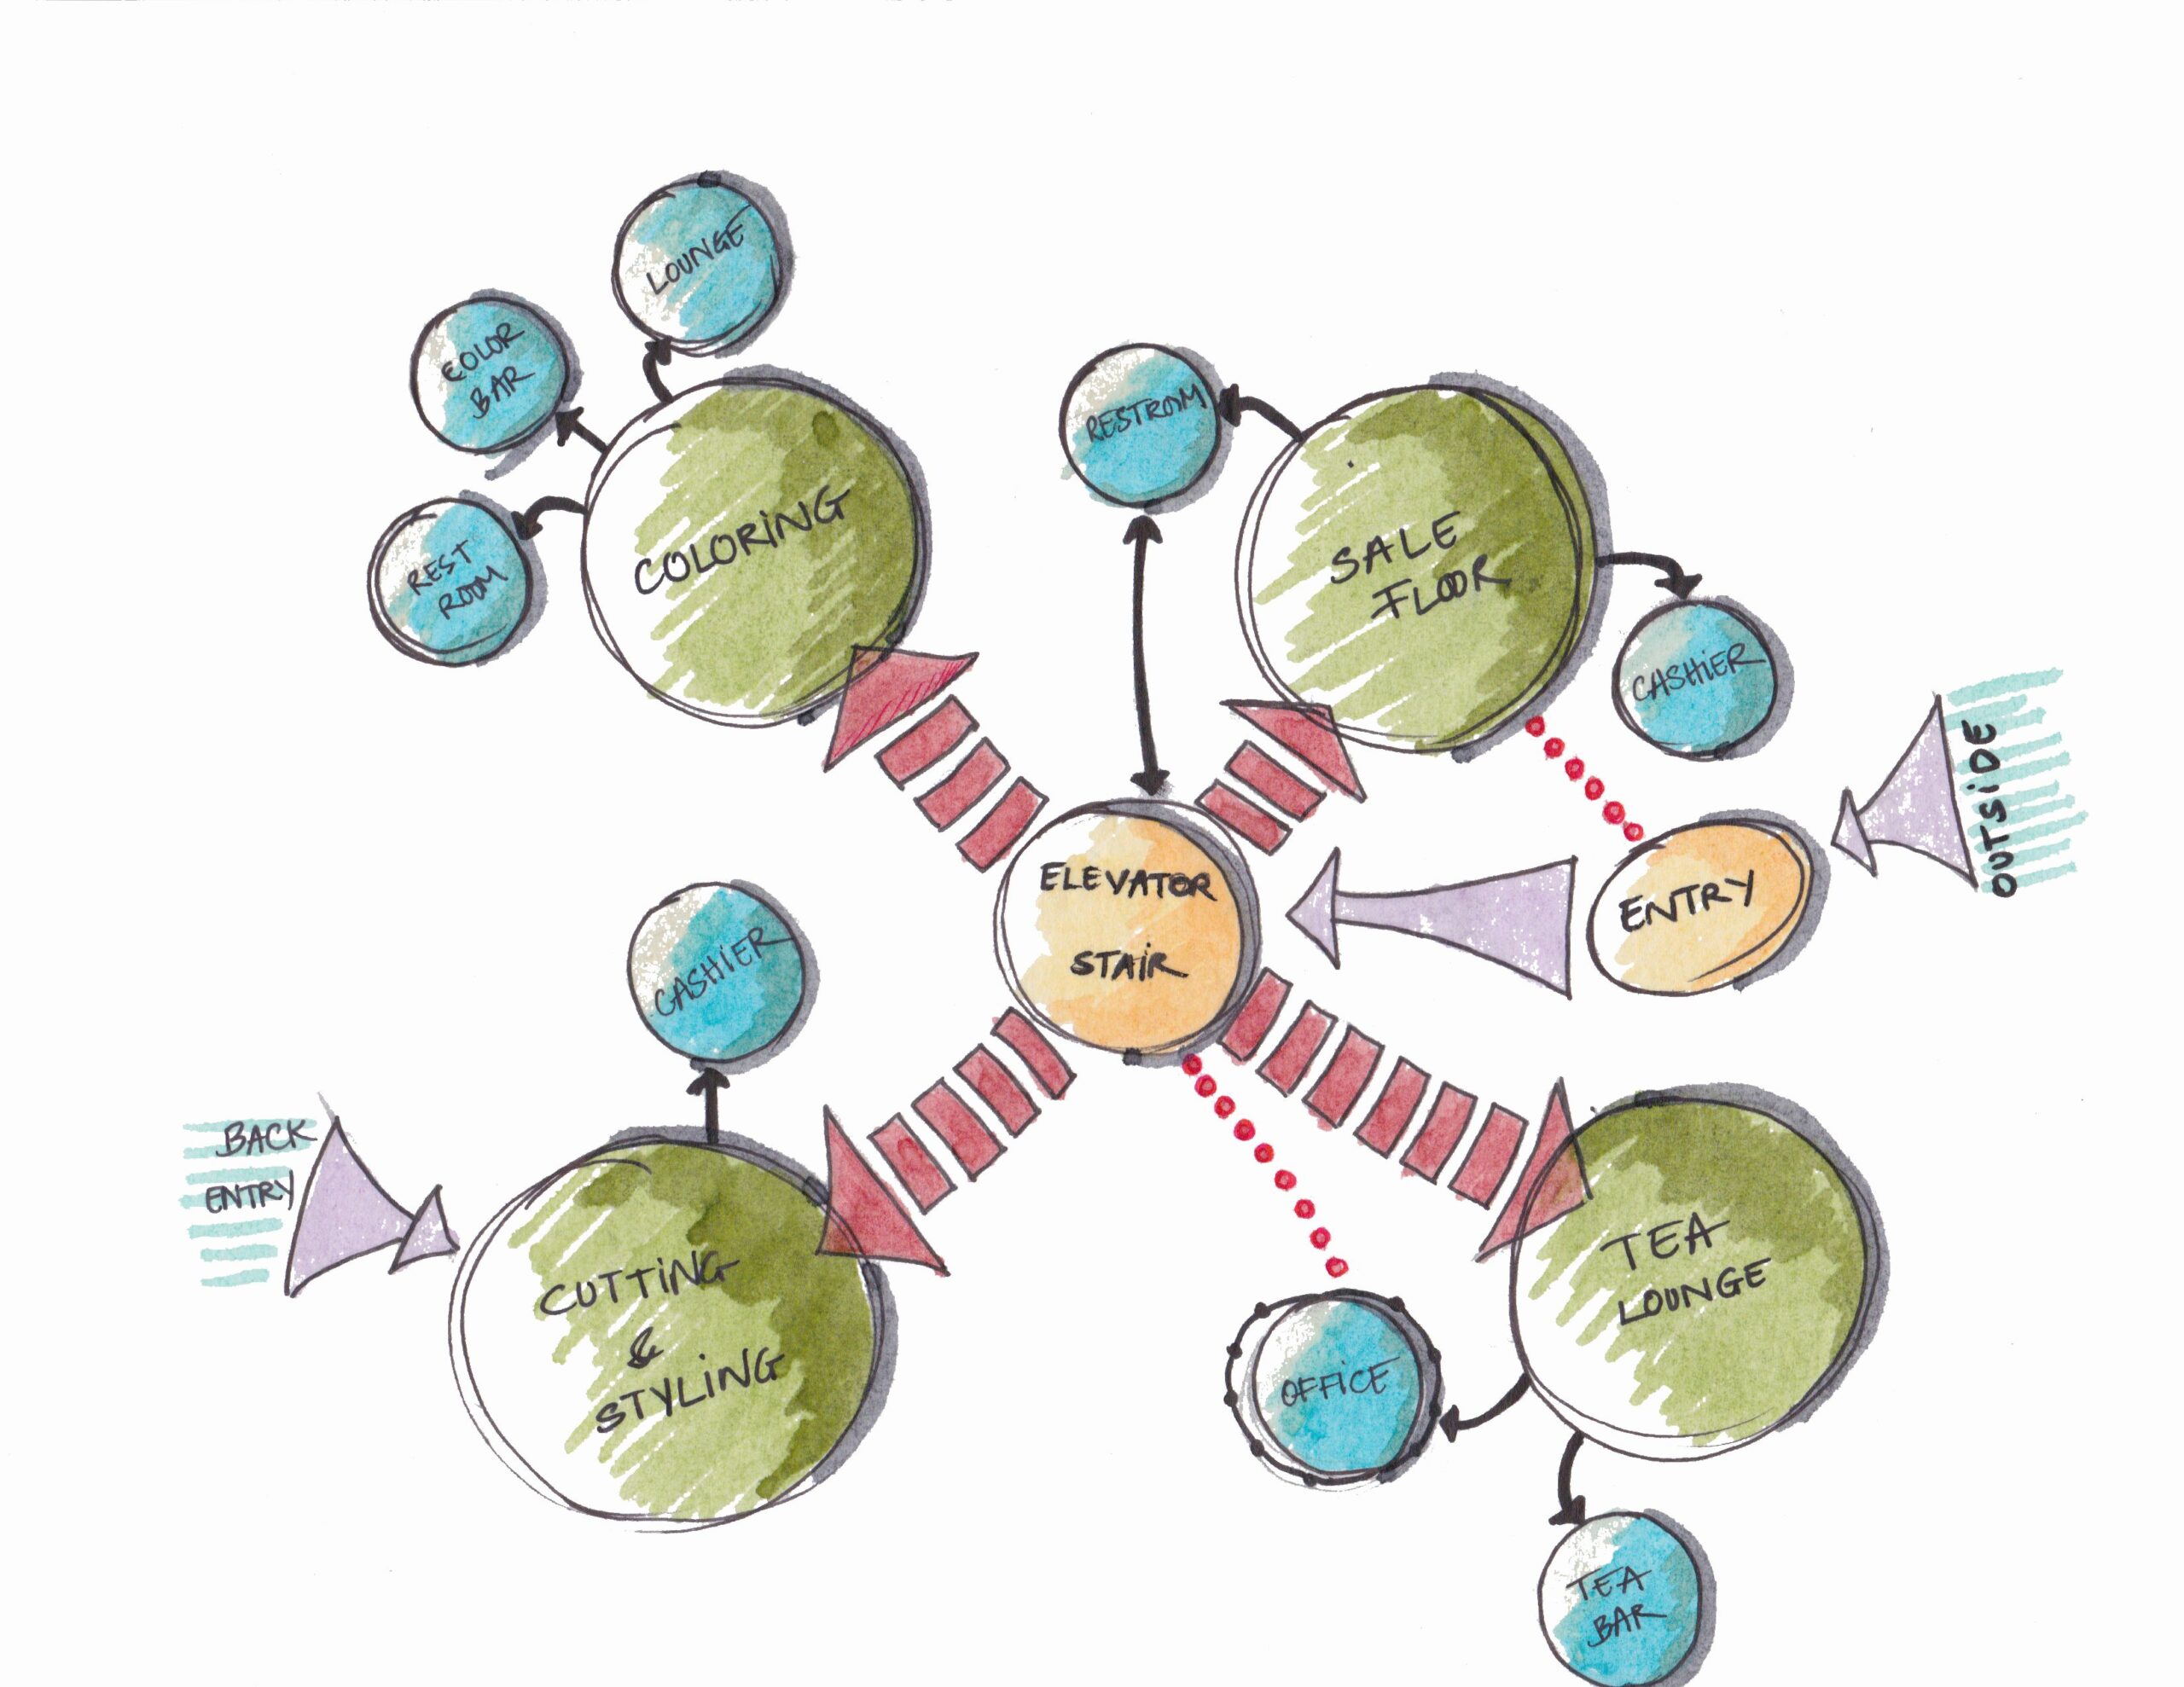
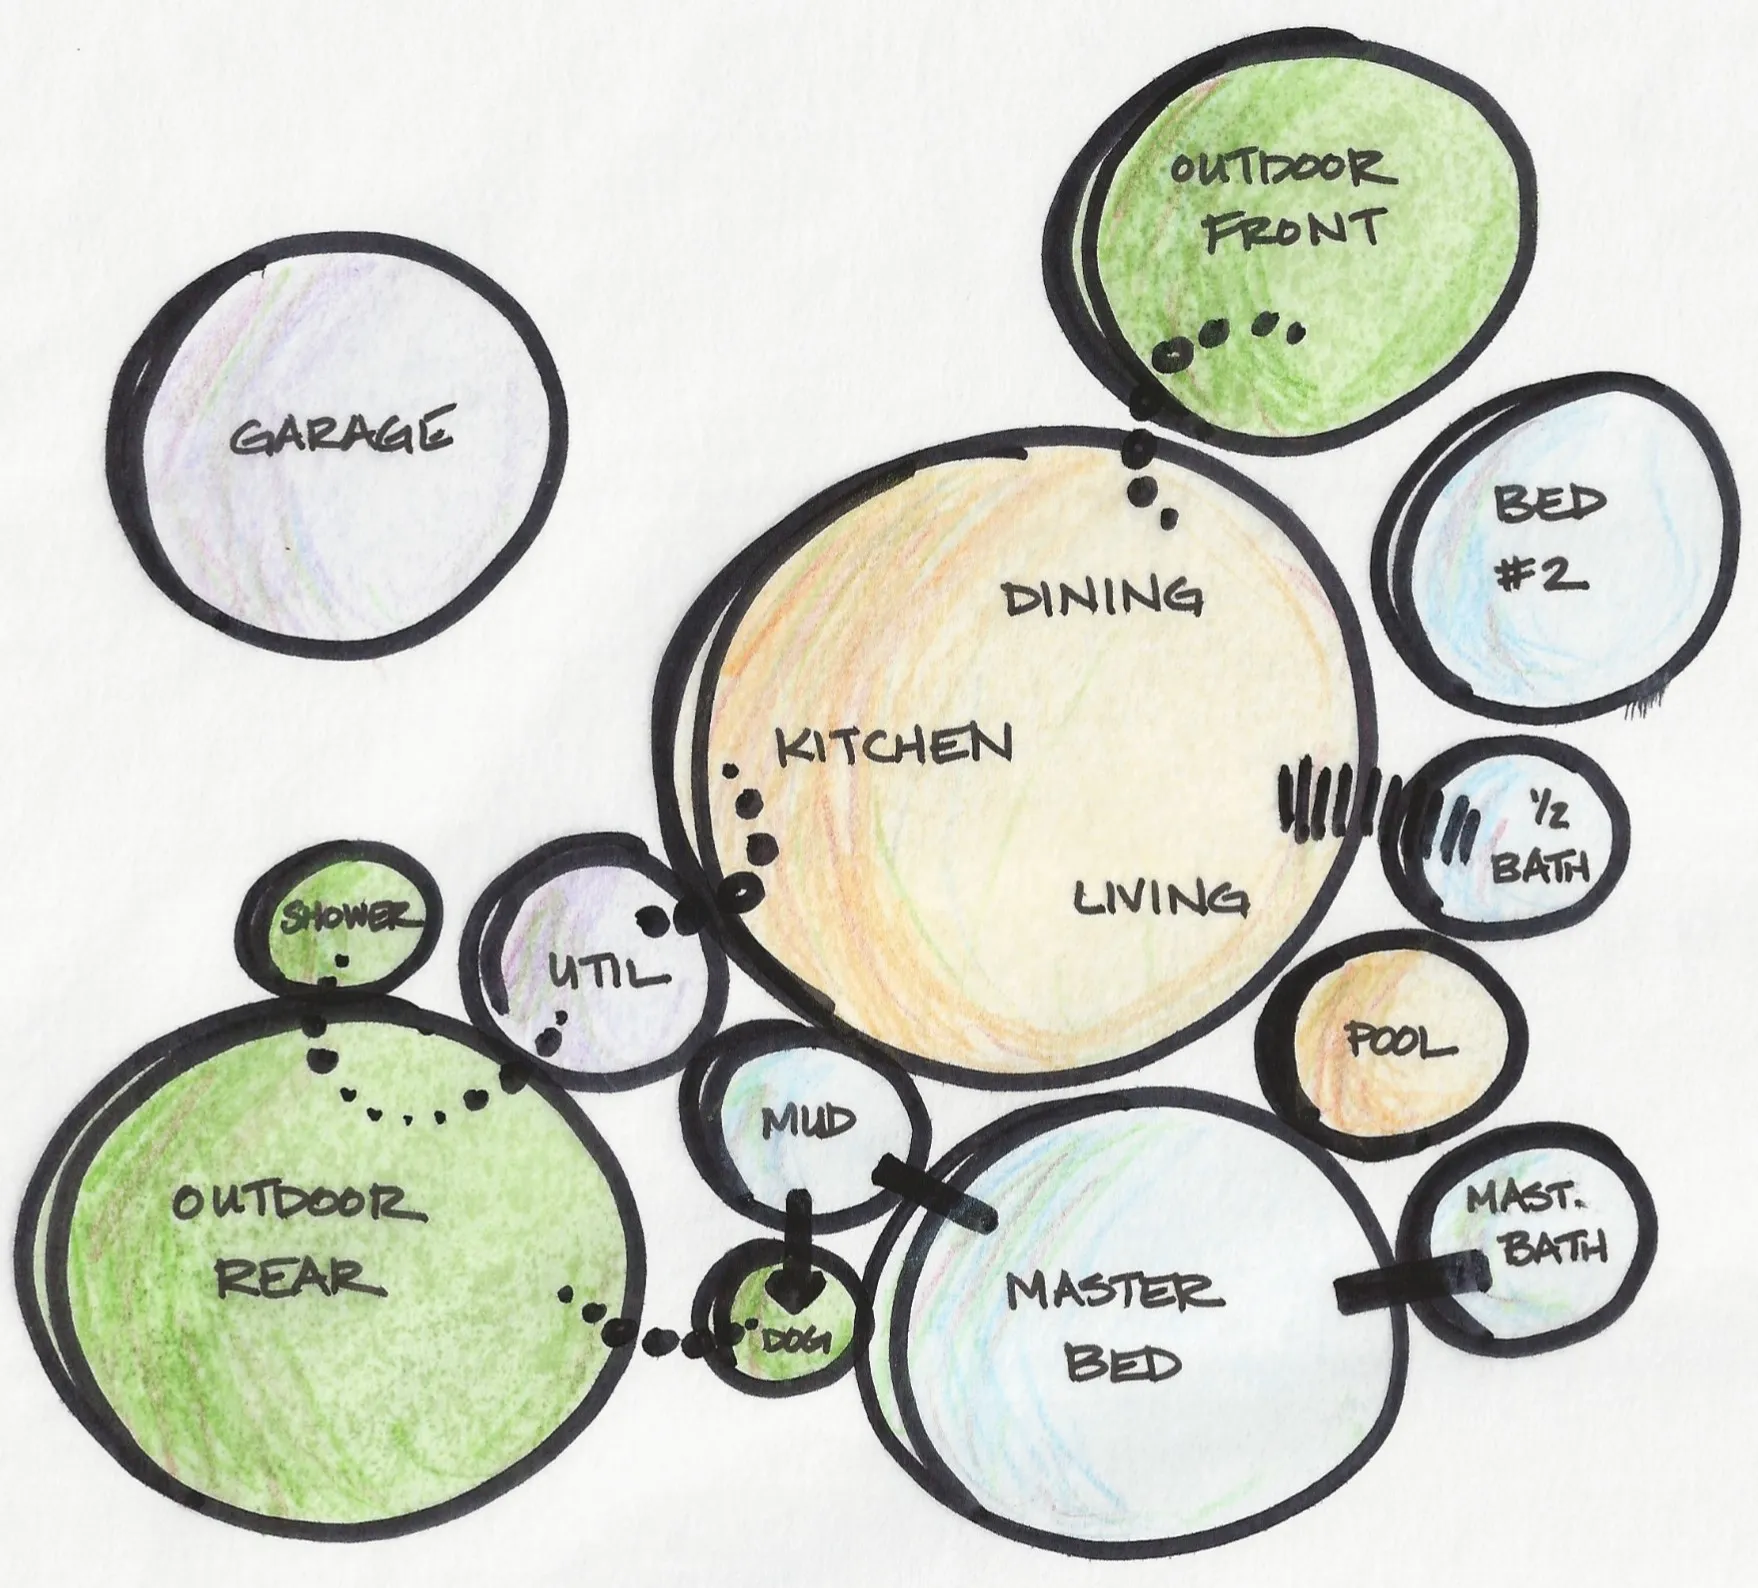
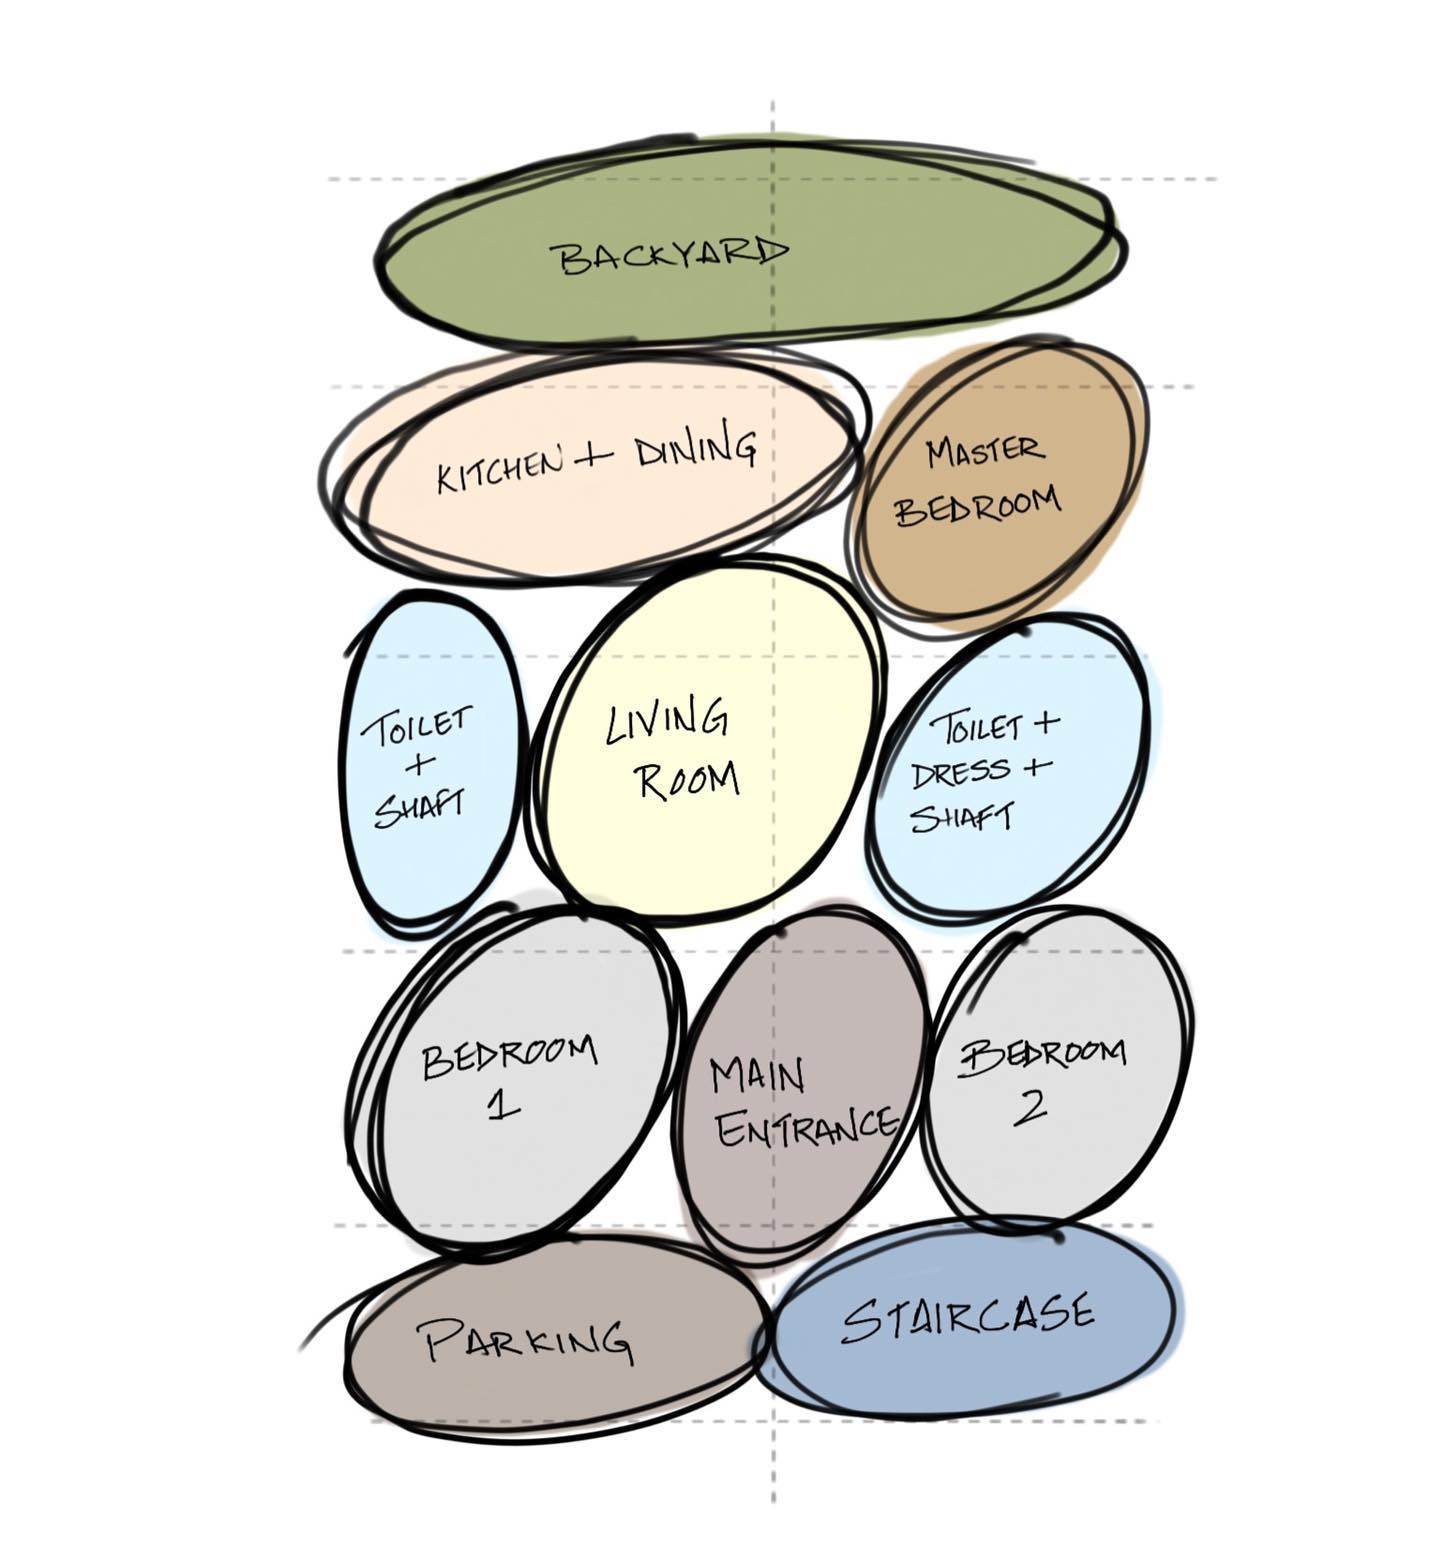


Table of Contents Show
Quick Answer: To create a bubble diagram, list the spaces a project needs, then draw each as a circle sized by importance. Connect related spaces with lines to show desired adjacencies and circulation. Arrange and rearrange the bubbles to test layouts, then use the diagram as the basis for developing a floor plan.
A bubble diagram is one of the most essential tools in architecture and interior design for visualizing spatial relationships during the earliest stages of a project. Whether you are working on an architectural bubble diagram for a commercial building or an interior design bubble diagram for a residential renovation, understanding how to create bubble diagrams effectively can transform abstract ideas into clear, functional layouts. In this guide, you will learn what a bubble diagram is, how to create one step by step, and which tools make the process easier.
An architectural diagram is a visual representation that illustrates the structure, components, relationships, and behaviors of a system or application architecture. It typically consists of various elements, such as boxes, lines, arrows, and text, that depict the various components of a system, their interactions, and their relationships with each other.
Architectural diagrams can be used to communicate complex technical ideas to both technical and non-technical stakeholders, such as developers, project managers, business stakeholders, and customers. They can also be used to document system designs and to guide the development process.
Examples of architectural diagrams include network diagrams, data flow diagrams, UML diagrams, entity-relationship diagrams, and system context diagrams. The choice of diagram depends on the level of detail required and the type of system being represented.
Try Our Free Bubble Diagram Maker ToolFree Online Bubble Diagram Maker
The choice of architectural diagrams depends on the specific needs of the architecture being designed and the clients or other people involved in the project.
What Is a Bubble Diagram in Architecture and Interior Design?
A bubble diagram is a freehand spatial diagram composed of circles or ovals — called “bubbles” — that represent different functional spaces or programmatic elements within a building or room. Each bubble is labeled with the name or function of the space it represents, such as a living room, kitchen, bedroom, corridor, or outdoor space. The relative size, position, and connections between bubbles convey how spaces relate to one another in terms of adjacency, circulation, and hierarchy.
In architecture, bubble diagrams are used during the schematic design phase to explore different arrangements of rooms and zones before committing to a detailed floor plan. For interior design, bubble diagrams serve a similar purpose: they help designers organize furniture zones, traffic flow, and functional areas within a single room or an entire home. The abstract nature of these diagrams allows architects and interior designers to focus on relationships and function rather than exact dimensions or structural constraints.
Bubble diagrams are commonly used in architecture to explore and organize spatial relationships between different programmatic elements in a building design. The diagram consists of circles or “bubbles” that represent different functional spaces or programmatic elements, such as rooms, corridors, or outdoor spaces. The bubbles are typically labeled with the name or function of the space they represent.
The bubbles are then arranged on a diagram based on their relationships and interactions, such as adjacency, circulation, and hierarchy. The diagram can be used to explore different design options and test the feasibility of different spatial relationships. It can also be used as a tool for communication between architects, clients, and other stakeholders.
Why Bubble Diagrams Matter in the Design Process
Bubble diagrams play a critical role at the very start of any architectural or interior design project. According to the American Institute of Architects (AIA), the schematic design phase is where fundamental decisions about spatial organization are made — and bubble diagrams are the primary tool for this exploration. Here is why they are indispensable:
Rapid iteration: Because bubble diagrams are abstract, designers can sketch and rearrange dozens of layout options in minutes. This speed encourages creative exploration that would be impossible with detailed architectural plans.
Clear communication: A well-drawn bubble diagram instantly communicates spatial intent to clients, consultants, and contractors — even those without architectural training. This reduces misunderstandings and aligns all stakeholders early in the process.
Informed floor plans: The bubble diagram floor plan transition is one of the most critical steps in design. A solid bubble diagram ensures that the resulting floor plan has logical adjacencies, efficient circulation, and appropriate zoning from the outset.
Cost and time savings: Catching spatial conflicts at the bubble diagram stage is far less expensive than discovering them during construction documentation or, worse, on site.
What Are the Steps to Create a Bubble Diagram?
Bubble diagrams are often used in the early stages of the design process, before more detailed plans are developed. Once the general layout and organization of spaces are determined, the diagram can be refined and developed into more detailed floor plans and elevations.
It’s important to note that bubble diagrams are not typically used as architectural diagrams in the same way as other types of diagrams, such as floor plans or elevations. Rather, they are a tool for exploring and organizing spatial relationships in the early stages of design.
Step-by-Step Guide to Creating a Bubble Diagram
Creating a bubble diagram is a relatively simple process that can be done manually or using specialized software tools. Here are the general steps for creating a bubble diagram in architecture or interior design:
1. Identify the programmatic elements: Make a list of the functional spaces or programmatic elements that need to be included in the diagram. This might include rooms, circulation spaces, outdoor areas, or other functional areas. For a bubble diagram of a house, typical elements include the kitchen, living room, bedrooms, bathrooms, garage, and garden.
2. Draw the bubbles: Create circles or “bubbles” to represent each programmatic element. Label each bubble with the name or function of the space it represents. Vary the bubble size to reflect the relative area each space requires — a large living room bubble should be noticeably bigger than a powder room bubble.
3. Arrange the bubbles: Arrange the bubbles on a diagram based on their relationships and interactions. For example, you might group bubbles that need to be adjacent to each other or arrange them in a hierarchy based on their importance. In a bubble diagram house layout, the kitchen should sit near the dining area, and bedrooms should be grouped away from noisy social zones.
4. Add connections and circulation: Use lines or arrows to show how people will move between spaces. Thicker lines can indicate primary circulation paths, while thinner or dashed lines can represent secondary or occasional connections. This step transforms a simple cluster of bubbles into a bubble flow chart that maps movement through the design.
5. Refine the diagram: Once the bubbles are arranged, refine the diagram by adjusting the size, shape, and position of the bubbles to optimize the spatial relationships between them. Consider factors such as natural light access, views, noise separation, and programmatic requirements.
6. Share and revise: Share the diagram with other stakeholders, such as architects, clients, or consultants, to get feedback and make revisions as needed. This iterative process is what makes bubble diagrams such a powerful planning tool.
There are also several software tools available that can be used to create bubble diagrams, such as Microsoft Visio, SketchUp, and SmartDraw. These tools allow for greater precision and flexibility in creating and revising diagrams and can also generate more detailed plans and elevations based on the diagram.
How Do Designers Use Bubble Diagrams for Interior Design?
While bubble diagrams are most commonly associated with architecture, they are equally valuable in interior design. An interior design bubble diagram focuses on the arrangement of functional zones, furniture groupings, and traffic patterns within a room or set of rooms. Unlike architectural bubble diagrams, which deal with entire building programs, bubble diagrams in interior design often zoom in on individual spaces to optimize comfort, aesthetics, and usability.
For example, when redesigning a living room, an interior designer might draw bubbles for the seating area, media center, reading nook, and entryway transition. By mapping these zones as bubbles and drawing connections between them, the designer can quickly see whether the flow is logical and whether any zones conflict — such as placing a quiet reading nook directly beside a television wall.
Bubble diagrams for interior design are especially useful in open-plan layouts where traditional walls do not define space. In these environments, the spatial diagram becomes the primary tool for establishing boundaries through furniture placement, rugs, lighting, and level changes rather than physical partitions. Interior designers working on residential projects often find that a quick bubble diagram session with the client reveals preferences and priorities that might not emerge from a verbal conversation alone.
What Does a Bubble Diagram of a House Look Like?
A bubble diagram of a house typically begins with two major zones: public and private. The public zone includes the living room, dining room, kitchen, and entry foyer, while the private zone covers bedrooms, bathrooms, and study areas. Service spaces such as the laundry room, garage, and mechanical room form a third cluster.
When arranging these bubbles, consider the following relationships that are standard in residential architectural design:
The kitchen should be adjacent to both the dining area and a service or utility zone. Bedrooms should be grouped together and separated from noisy public spaces. The entry foyer should provide direct access to both public areas and a hallway leading to private zones. Outdoor spaces like patios or gardens should connect logically to the living or dining area.
A well-developed bubble diagram house layout serves as the foundation for the floor plan bubble diagram, which adds dimensional accuracy, wall placements, and door/window positions. Many architects recommend creating at least three different bubble diagram variations before selecting the one that best meets the client’s needs and the site’s constraints.
What Are the Best Tools for Creating Bubble Diagrams?
Choosing the right tool for creating a bubble diagram depends on your project scale, collaboration needs, and personal workflow. Below are some of the most popular options used by architects and interior designers in 2025:
Illustrarch Bubble Diagram Maker: A free, browser-based tool built specifically for architects and designers. It runs entirely in the browser with no installation required, offering drag-and-drop bubble creation, customizable connections, and one-click PNG export. It is ideal for quick spatial planning sessions and academic projects.
Microsoft Visio: Visio is a versatile diagramming tool that allows you to create a wide range of diagrams, including bubble diagrams. It has a user-friendly interface and provides a variety of pre-built shapes and templates to make the diagram creation process easier.
SketchUp: SketchUp is a 3D modeling software that can also be used to create 2D bubble diagrams. It allows you to create and manipulate shapes in 3D, which can be useful for visualizing complex spatial relationships. SketchUp has a free version as well as a paid Pro version with more advanced features.
SmartDraw: SmartDraw is a diagramming software that offers a range of templates and tools for creating professional-quality bubble diagrams. It has a user-friendly interface and allows for collaboration and sharing of diagrams.
Lucidchart: Lucidchart is a cloud-based diagramming software that allows you to create bubble diagrams and other types of diagrams online. It has a drag-and-drop interface, collaboration tools, and integrations with other software tools.
Each of these tools has its own strengths and weaknesses, so it’s important to choose the one that best meets your needs and preferences. Many of these tools offer free trials or demos, so you can try them out before making a purchase.
How Do You Turn a Bubble Diagram Into a Floor Plan?
The transition from a bubble diagram to a floor plan is one of the most important moments in the design process. Once your spatial diagram captures the right relationships and flow, you can begin translating abstract bubbles into walls, doors, and dimensional spaces. Here is how the process typically works:
First, overlay a rough grid or site boundary onto your finalized bubble diagram floor plan. This forces the bubbles to conform to real-world constraints like lot size, structural grids, and setback requirements. Next, begin replacing circular bubbles with rectilinear shapes that represent actual room footprints. At this stage, you start assigning approximate square footage to each space. Finally, add corridor widths, door swings, and window locations to produce a preliminary floor plan that can be developed further with CAD software or BIM tools.
This progression — from bubble diagram to floor plan — ensures that the final layout is grounded in thoughtful spatial logic rather than arbitrary room placement. Architects who skip the bubble diagram stage often find themselves redesigning floor plans multiple times because fundamental adjacency issues were never resolved.
What Are Tips for Creating Effective Bubble Diagrams?
To get the most value out of your bubble diagrams, keep these best practices in mind:
Start with a program list. Before drawing a single bubble, write down every space your project requires, along with its approximate size and any adjacency requirements. This programmatic analysis prevents you from forgetting critical spaces midway through the diagram.
Use size to convey hierarchy. Larger bubbles should represent spaces that require more area or carry greater functional importance. This visual hierarchy makes the diagram instantly readable.
Color-code by function. Assign different colors to public, private, and service zones. Color coding transforms a bubble diagram from a monochrome sketch into a powerful communication tool that stakeholders can quickly interpret.
Draw at least three variations. The first diagram you draw is rarely the best. Producing multiple options allows you to compare trade-offs and select the strongest spatial organization.
Include outdoor and site context. A bubble diagram in architecture should not stop at the building envelope. Including garden areas, parking, and site access points ensures the design responds to its surroundings.
Iterate with feedback. Share your diagrams with clients, engineers, and other design team members early and often. Each round of feedback refines the spatial logic.
Frequently Asked Questions About Bubble Diagrams
What is a bubble diagram in architecture?
A bubble diagram in architecture is a schematic drawing that uses circles (bubbles) to represent different functional spaces — such as rooms, corridors, and outdoor areas — and lines to show the relationships between them. It is primarily used during the early design stages to explore spatial organization, adjacency, and circulation before committing to a detailed floor plan.
How do you create a bubble diagram for interior design?
To create a bubble diagram for interior design, start by listing all functional zones within the space (seating, dining, work, storage). Draw each zone as a labeled bubble, size them proportionally, and arrange them based on desired adjacency and traffic flow. Use connecting lines to show circulation, then refine until the layout feels logical and comfortable. Free tools like the Illustrarch Bubble Diagram Maker make this process fast and intuitive.
What is the difference between a bubble diagram and a floor plan?
A bubble diagram is an abstract representation of spatial relationships — it shows which spaces should be near each other and how people move between them, without specifying exact dimensions or wall positions. A floor plan, by contrast, is a scaled architectural drawing with precise measurements, wall thicknesses, door swings, and structural details. The bubble diagram typically precedes the floor plan in the design process.
Can bubble diagrams be used for house design?
Absolutely. A bubble diagram of a house is one of the most common applications. Architects and homeowners use them to organize public zones (living, dining, kitchen), private zones (bedrooms, bathrooms), and service areas (laundry, garage) before developing a detailed bubble diagram floor plan. This approach helps ensure logical flow and minimizes costly redesigns later.
What are the best free tools for making bubble diagrams?
The best free tools for making bubble diagrams in 2025 include the Illustrarch Bubble Diagram Maker (browser-based, architecture-focused), Lucidchart (cloud-based with a free tier), and Visual Paradigm Online (intuitive drag-and-drop interface). For more options, see our roundup of the best online bubble diagram makers.
Frequently Asked Questions
List the spaces, draw each as a circle, connect related spaces with lines for adjacency, then refine and use the diagram as the basis for a floor plan.
It plans how spaces relate, their adjacencies and circulation, quickly and flexibly before you draw a scaled plan.
Keep the adjacencies and circulation, then assign real dimensions, walls and shapes to each space.
Last updated:


2 Comments


Bubble Diagram for Residential Projects: From Brief to Layout
A step-by-step look at how a bubble diagram organizes a residential brief...

Spatial Organization Diagrams in Architecture: Types, Examples, and How to Choose
This guide breaks down the five core types of spatial organization diagrams...

Bubble Diagram School Design: A Step by Step Guide for Educational Buildings
A practical look at bubble diagram school design for educational buildings. It...

Understanding Architectural Functional Relationship Diagrams: A Practical Guide
Functional relationship diagrams are essential planning tools that architects use during the...

Can I ask what application you use to create the beautiful graphics in the article?
illustrarch bubble diagram maker.