

Architectural Diagrams: 10 Best Examples & Types Explained
Architectural diagrams are essential tools for communicating design ideas. This article showcases 10 real architecture diagram examples by architects, covering creation diagrams, exploded axonometric views, program diagrams, urban analysis, and sectional diagrams — with tips on how to create your own.

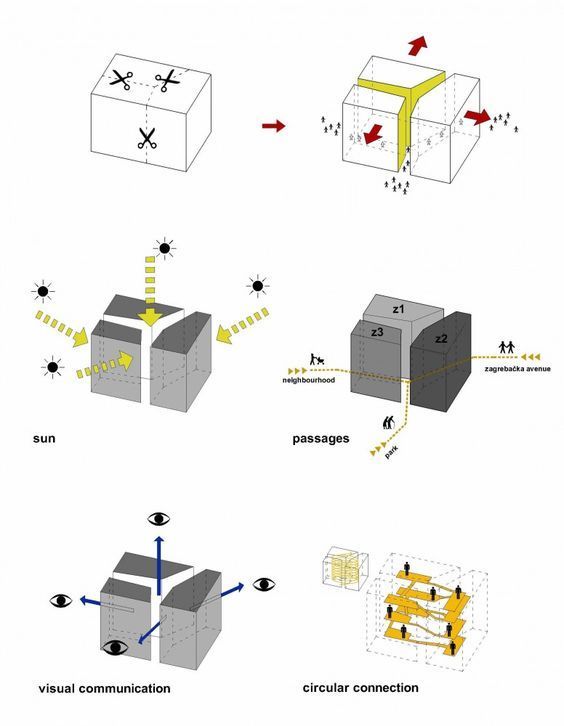


Table of Contents Show
Quick Answer: Architectural diagrams are simplified visual tools that communicate a building’s spaces, systems and ideas. Common types include bubble, parti, circulation, axonometric, section, structural and zoning diagrams. Architects use them throughout design – from early concept to presentation – to study relationships, explain decisions and turn abstract thinking into clear, shareable graphics.
An architectural diagram is a graphic representation in which the various components of a building or other structure, or of a city or landscape, are represented so as to show their relations. Architectural diagrams are usually created by architects in order to show a building or part of a building. The architecture diagram can also be used in order to present how different buildings will look like when they are finished. Whether you are working on a professional project or a student assignment, understanding architectural diagramming is essential for effective visual communication in the design process. Architectural diagrams are graphic tools that translate complex spatial and functional information into clear visual communication. They show relationships between spaces, environmental conditions, and program organization, and are used by architects at every stage of the design process, from early concept sketches through construction documentation. Each diagram type targets a specific communication goal, making them indispensable for both student studio presentations and professional client deliverables. The types of architectural diagrams available can vary depending on the field and profession the architect belongs to. They are created using specialized graphic software to show the physical relationship between people, objects, and environmental features. Architectural diagrams help you to organize data in a graphical form. They are also standardized and follow a set of guidelines. For that reason, architectural diagrams are preferred from architectural students and architects. If you are looking for architecture diagram examples to improve your own work, studying successful projects from experienced diagram architects is one of the best approaches. Architects use architectural diagrams to make their project clear and understandable for clients. Different types of architectural diagrams are used for professional architectural presentations as well as architectural student presentations. A well-crafted architecture design diagram bridges the gap between complex technical concepts and clear visual storytelling, making it an indispensable tool in every architect’s workflow. In this article, we will see the best 10 examples of successful architectural diagrams by architects. You can get inspirations from this article before design architectural posters. First of all, let’s be clear about architectural diagrams.What Are the Types of Architectural Diagrams?
Architectural diagrams that we always use in presentations of projects can be categorized as:- Planimetric Diagrams
- Sectional Diagrams
- Circulation Diagrams
- Sustainability Diagrams
- Axonometric Diagrams
- Perspective Diagrams
- Urban Diagrams
Why Are Architectural Diagrams Important?
Architectural diagram importance: – They can be used as a template for the construction permit drawings. – They provide immediate information about complex systems. – They can be used to show how a building will look when it is finished. – Models that are created to scale on a computer can be copied and pasted into the architect’s CAD program and edited on screen to show changes made during design reviews. Beyond these practical uses, architectural diagrams play a critical role in the early stages of design development. They allow architects to test concepts quickly, explore spatial relationships, and communicate with clients and collaborators before committing to detailed drawings. A strong sample architecture diagram can also serve as a reference point throughout the entire project lifecycle, from the initial concept phase to final construction documentation. According to the American Institute of Architects (AIA), effective diagramming is a foundational skill for design professionals at every level.📌 Did You Know?
According to the AIA’s 2023 Firm Survey, over 78% of architecture firms report that diagramming is introduced in the earliest phases of a project, before any detailed drawings are produced. This reflects a broad consensus that visual communication tools like architectural diagrams are not supplementary, they are foundational to the design process itself.
What Are 10 Successful Architectural Diagram Examples?
Below, we explore 10 architecture diagram examples that demonstrate how professional architects and firms use various diagramming techniques to communicate their design ideas effectively. Each architectural diagram example showcases a different approach to visual storytelling in the design process.1. Creation Diagram – Mass and Design Process
💡 Pro Tip
When creating a mass creation diagram, build it as a sequence of 4 to 6 steps rather than showing the final form in a single image. Each step should answer one question: what was added, removed, or rotated, and why. Juries and clients follow step-by-step logic far more easily than a single complex diagram with too many annotations layered on top.
2. Context Analysis Diagram
3. Exploded Axonometric Program Diagram
Credit: (69) Pinterest
Exploded axonometric diagram is one of the good examples of architectural diagrams. In this example, functions are separated in the exploded axonometric view. The colors of the diagrams help us to understand the differences between programs. Then, simple icons make the functions of the building understandable. This is an excellent sample architecture diagram for any architect looking to communicate the program diagram architecture of a multi-functional building. The use of color-coding in program diagrams architecture makes complex spatial relationships instantly readable for both professional and non-professional audiences.
4. Urban Land-Use Analysis Diagram
5. Residential Exploded Axonometric Diagram
6. Climatic and Contextual Diagram
7. Sustainability Systems Diagram
📐 Technical Note
When diagramming passive cooling or solar strategies, orient your diagram to true north and include a simple sun path arc showing summer and winter solstice angles. The ASHRAE 90.1 standard and USGBC LEED guidelines both reference solar orientation as a key metric in energy performance documentation. Including this reference in your sustainability diagram adds technical credibility to the design narrative.
8. Three-Dimensional Urban Diagram
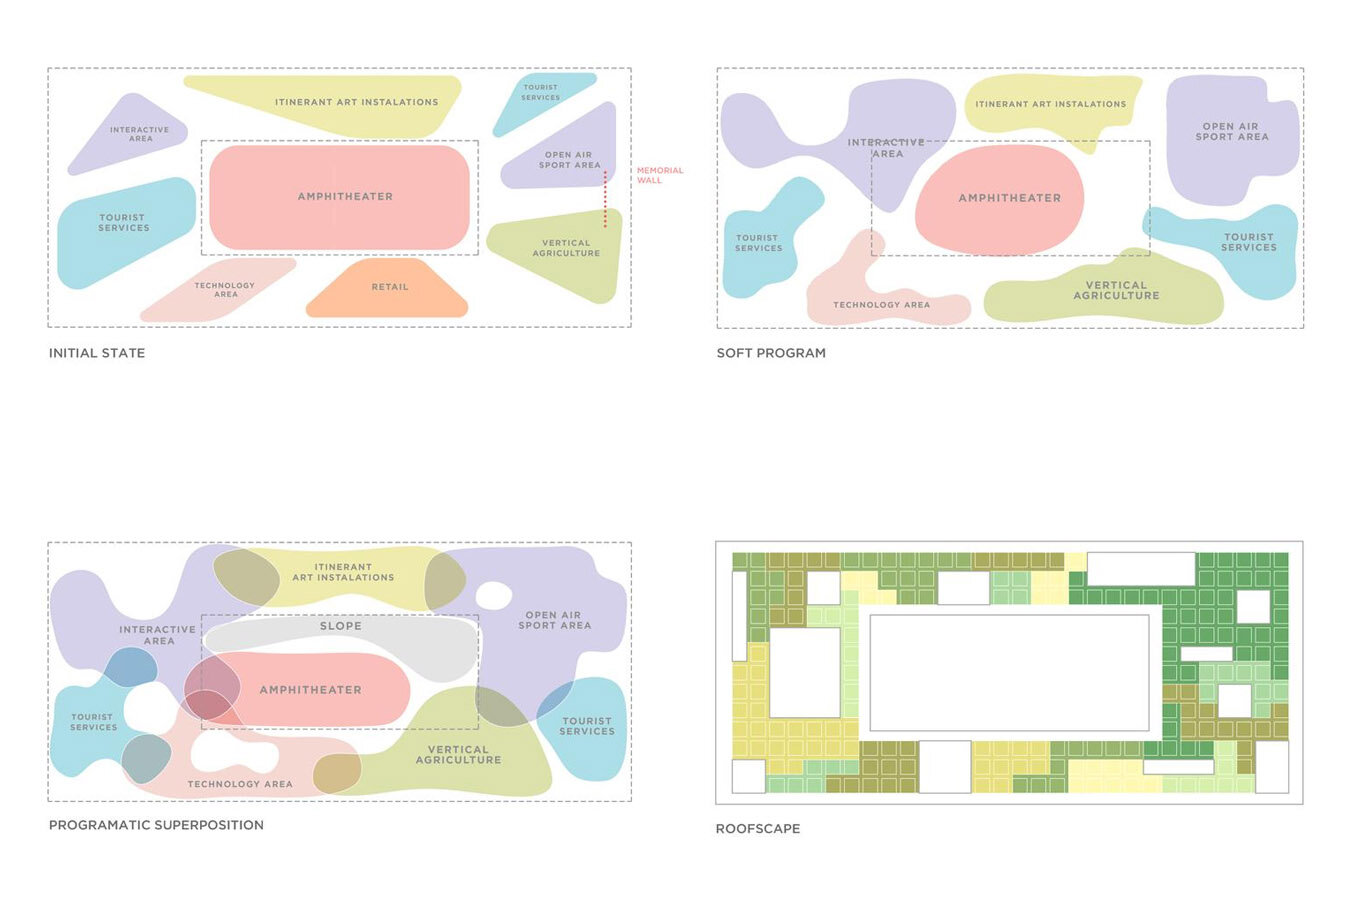
9. Planimetric Program Diagram
10. Sectional Diagram

Bonus: Exploded Isometric View

⚠️ Common Mistake to Avoid
A common error in exploded isometric and axonometric diagrams is pulling apart the layers so far that their spatial relationship becomes unclear. The explosion distance should be consistent and proportional, enough to distinguish each layer visually but not so much that the viewer loses the sense of how they stack or connect. Keep structural layers closest to each other, and reserve more separation for systems like MEP or envelope cladding.
How to Create Effective Architecture Diagrams
Creating a compelling architecture diagram requires more than graphic skills. It demands clarity of thought about what you want to communicate. Here are the core principles that diagram architects follow when producing professional-quality building diagrams: Start with a clear purpose. Every architectural diagram should answer a specific question: What is the program? How do users circulate? What are the environmental conditions? Defining the purpose before you start drawing ensures your diagram stays focused and communicative. Use color and iconography intentionally. In architecture diagrams examples from leading firms, color is never decorative. It carries meaning. Assign consistent colors to specific functions or systems, and use simple icons to reinforce understanding without cluttering the composition. Choose the right projection type. Whether you opt for a plan-based program diagram, a sectional cut, or an axonometric view depends on what information you need to convey. Plan-based diagrams excel at showing spatial relationships on a single level, while axonometric and isometric views communicate three-dimensional program relations. Keep it simple. The best architectural diagram examples are those that distill complexity into clarity. Avoid overloading a single diagram with too much information. Instead, create a series of focused diagrams, each addressing one aspect of the design, as part of a cohesive presentation strategy. For a step-by-step guide to the diagramming process, visit our detailed resource on creating architecture diagrams. You can also explore the importance of architectural diagrams to understand their role in the broader design workflow.What Software Do Architects Use for Diagramming?
Modern diagram architects have access to a wide range of digital tools that streamline the creation of architecture design diagrams. Popular choices among professionals and students include: Adobe Illustrator and Photoshop remain industry standards for creating polished architectural diagram examples with precise vector graphics and raster compositing. For those who prefer a more parametric approach, tools like Rhino with Grasshopper allow architects to generate data-driven diagrams that respond dynamically to design parameters. Free alternatives such as Inkscape and GIMP also offer capable diagramming features for students and emerging professionals. The Royal Institute of British Architects (RIBA) regularly highlights digital communication tools in its continuing professional development resources, recognizing that proficiency with diagramming software is now a core expectation in architectural practice at all career levels. Regardless of the tool, the key to effective architectural diagramming lies in understanding the design intent behind the diagram and selecting the visual language that best communicates that intent to your audience.💡 Pro Tip
A common workflow used by experienced architects is to sketch diagrams by hand first, even rough ones on paper or a tablet, before opening any software. The act of drawing forces you to commit to a hierarchy of information. Once the logic is clear on paper, producing a polished digital version in Illustrator or Grasshopper is far faster and more focused than starting directly in software and editing as you go.
How Do Architectural Diagrams Differ in Practice vs. Student Work?
There is a notable difference between how architectural diagrams are used in professional practice and in academic settings. In professional contexts, architecture diagrams are often tailored for client communication, emphasizing clarity, simplicity, and the value proposition of a design. Firms like BIG (Bjarke Ingels Group) have become renowned for their narrative-driven diagramming style, where a sequence of diagrams tells the story of how a building’s form emerged from site conditions and program requirements. In academic environments, students are often expected to produce more exploratory and analytical architectural diagram examples that demonstrate a deep understanding of design principles. Program diagrams architecture, site analysis overlays, and circulation studies are common components of student presentation boards. Understanding the most used architectural diagram types will help students select the right visual tools for their projects. Students looking to build a comprehensive foundation should also read our architectural diagrams guide for students, which covers bubble diagrams, circulation diagrams, and concept diagrams with step-by-step guidance. Whether in a firm or a studio, the underlying goal of every architecture diagram is the same: to translate complex spatial ideas into clear, compelling visual narratives that advance the design conversation.✅ Key Takeaways
- Architectural diagrams communicate design intent that technical drawings alone cannot convey, covering program, circulation, context, and sustainability in visual form.
- The seven main diagram types (planimetric, sectional, circulation, sustainability, axonometric, perspective, and urban) each serve a specific purpose in the design process.
- Exploded axonometric and isometric views are among the most effective tools for showing building systems and program layers simultaneously.
- Color-coding, consistent iconography, and a single clear purpose per diagram are the three core principles of effective architectural diagramming.
- Professional firms like BIG and Sasaki use sequential diagram narratives to tell the story of how a design decision was made, making their diagrams as persuasive as they are informative.
- Both students and professionals benefit from studying real architecture diagram examples before creating their own, as pattern recognition accelerates the development of diagrammatic thinking.
Download Architectural Diagrams eBook
How Do You Choose the Right Type of Architectural Diagram?
Choosing the right diagram depends on what you need to communicate and the stage of design. Early on, bubble and parti diagrams help explore relationships and the core idea; as the design develops, circulation, zoning and programmatic diagrams clarify how spaces work; and for presentation, axonometric, section and exploded diagrams explain form and construction. Match the diagram to the question you are trying to answer, and keep each one focused on a single idea so it stays easy to read.
What Is Diagrammatic Thinking in Architecture?
Diagrammatic thinking is the practice of using simple diagrams not just to present a finished design, but to think through it. By reducing a problem to circles, lines and zones, architects can test relationships, spot conflicts and explore options quickly, long before committing to detailed drawings. Many strong designs begin as a single clear diagram, which then guides every later decision and keeps the project conceptually consistent.
How Are Architectural Diagrams Used in Education?
In architecture education, diagrams are a core skill. Students use them to analyse precedents, communicate concepts in studio reviews and structure their design thinking. Learning to diagram clearly teaches students to distil complex ideas into legible visuals, an ability that carries directly into professional practice, competition entries and portfolios. Strong diagramming often distinguishes the clearest, most persuasive student projects.
Related Guides
- Bubble Diagram In Architecture
- Architecture Circulation Diagram: Guide to Movement & Flow Design
- Understanding Architectural Axonometric Diagrams: A Guide
- What Is a Parti Diagram? Architecture & Interior Design Guide
- Architectural Section Drawings: 10 Best Examples & Techniques
- Understanding Architectural Structural Diagrams: Evolution and Impact
- Ventilation Diagram in Architecture: Types, Reading & Design
- Understanding Architectural Bubble Diagrams: A Complete Guide
More Guides
- The Ultimate Guide to Circulation Diagrams in Building Design
- Best Bubble Diagram Samples #2
- Why Architecture Diagrams Matter?
- Circulation Flow Diagrams: How to Read & Use Them in Architecture
- Tips and Best Practices of Architectural Diagrams
- Massing Diagram Architecture: A Practical Guide to Building Form Studies
More Related Guides
- Elements Of Bubble Diagram
- Bubble Diagram Hospital Design
- Functional Relationship Diagrams
- Spatial Organization Diagrams
- Bubble Diagram School Design
Frequently Asked Questions
Common types include bubble, parti, circulation, axonometric, section, structural and zoning diagrams.
They turn complex ideas into clear visuals, helping architects study relationships, explain decisions and present designs.
Reduce the idea to simple shapes and lines, keep each diagram focused on one idea, and label it clearly.
Last updated:
- arch diagrams
- architectural diagram
- Architectural Diagram Concept
- Architectural Diagram Design
- Architectural diagram examples
- Architectural Diagram Types
- architectural diagramming
- Architectural Diagrams
- architectural diagrams guide
- architecture design diagram
- Architecture Diagram
- architecture diagram example
- architecture diagram examples
- architecture diagrams examples
- architecture program diagram
- building diagrams
- diagram architects
- Diagram Guide
- Digital Drawing
- How to Create Architectural Diagram
- program diagram architecture
- program diagrams architecture
- sample architecture diagram


2 Comments


Spatial Organization Diagrams in Architecture: Types, Examples, and How to Choose
This guide breaks down the five core types of spatial organization diagrams...

Bubble Diagram School Design: A Step by Step Guide for Educational Buildings
A practical look at bubble diagram school design for educational buildings. It...

Understanding Architectural Functional Relationship Diagrams: A Practical Guide
Functional relationship diagrams are essential planning tools that architects use during the...

Massing Diagram Architecture: A Practical Guide to Building Form Studies
Massing diagrams are the first visual step in turning an architectural program...

This article talks about architectural diagrams and their types. I think it’s good to know how they help architects and students. The examples seem interesting, but I don’t know much about architecture.
This article talks about architectural diagrams. It seems like they are useful for showing how buildings will look. There are different types mentioned, which is interesting.