- Home
- Articles
- Architectural Portfolio
- Architectral Presentation
- Inspirational Stories
- Architecture News
- Visualization
- BIM Industry
- Facade Design
- Parametric Design
- Career
- Landscape Architecture
- Construction
- Artificial Intelligence
- Sketching
- Design Softwares
- Diagrams
- Writing
- Architectural Tips
- Sustainability
- Courses
- Concept
- Technology
- History & Heritage
- Future of Architecture
- Guides & How-To
- Projects
- Interior Design
- Competitions
- Jobs
- Store
- Tools
- More
10 Successful Architectural Diagrams by Architects
An architectural diagram is a graphic representation in which the various components of a building or other structure, or of a city or landscape, are represented so as to show their relations. Architectural diagrams are usually created by architects in order to show a building or part of a building. The diagram can also be used in order to present how different buildings will look like when they are finished.

An architectural diagram is a graphic representation in which the various components of a building or other structure, or of a city or landscape, are represented so as to show their relations. Architectural diagrams are usually created by architects in order to show a building or part of a building. The diagram can also be used in order to present how different buildings will look like when they are finished.
The types of architectural diagrams available can vary depending on the field and profession the architect belongs to. They are created using specialized graphic software to show the physical relationship between people, objects, and environmental features. Architectural diagrams help you to organize data in a graphical form. They are also standardized and follow a set of guidelines. For that reason, architectural diagrams are preferred from architectural students and architects.
Architects use architectural diagrams to make their project clear and understandable for clients. Different types of architectural diagrams are used for professional architectural presentations as well as architectural student presentations.
In this article, we will see the best 10 examples of successful architectural diagrams by architects. You can get inspirations from this article before design architectural posters. First of all, let’s to be clear about architectural diagrams.
Architectural diagrams that we always use in presentations of projects can be categorized as:
- Planimetric Diagrams
- Sectional Diagrams
- Circulation Diagrams
- Sustainability Diagrams
- Axonometric Diagrams
- Perspective Diagrams
- Urban Diagrams
Architectural diagram importance:
– They can be used as a template for the construction permit drawings.
– They provide immediate information about complex systems.
– They can be used to show how a building will look when it is finished.
– Models that are created to scale on a computer can be copied and pasted into the architect’s CAD program and edited on screen to show changes made during design reviews.
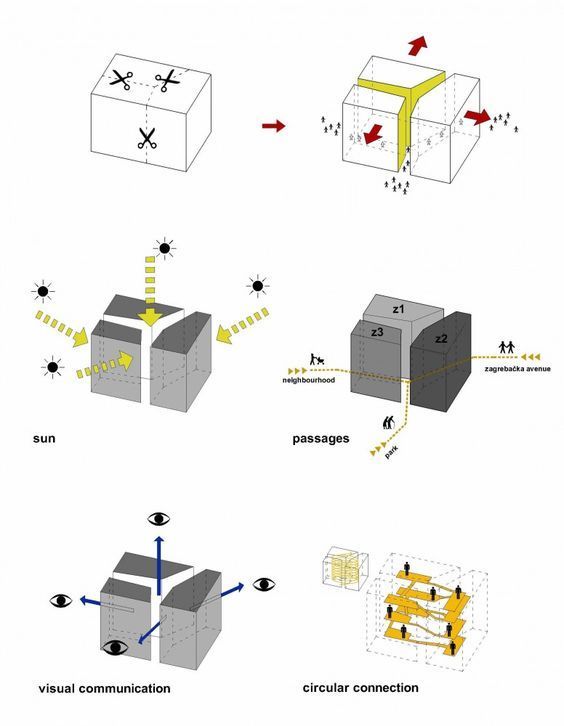
The first example of architectural diagrams that created by architects is a creation diagram. Creation diagrams are used for explaining of architectural design process. In this diagram, we can see the mass creation process and the inside of the building. The architect wants to show sun directions, accessibility, visual communications and circular connections of the building in this diagram.

The aim of this architectural diagram is to present the explanation of the context. We can understand the context and environmental conditions of the building.
Credit: (69) Pinterest
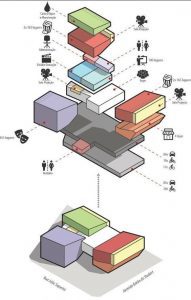
Exploded axonometric diagram is one of the good examples of architectural diagrams. In this example, functions are separated in the exploded axonometric view. The colors of the diagrams help us to understand the differences between programs. Then, simple icons make the functions of the building understandable.

Urban diagram is another type of architectural diagrams. Urban diagrams are created by macro-scaled urban maps. You can create urban diagrams in 2-dimensional way according to land-use analysis. Colors, texts and simple arrows/icons will help the diagram presentation.

Especially in residential buildings, exploded axonometric diagrams are really helpful. In this example, legend and numbers help to improve this diagram. We can see the program relations for each storey of the building.
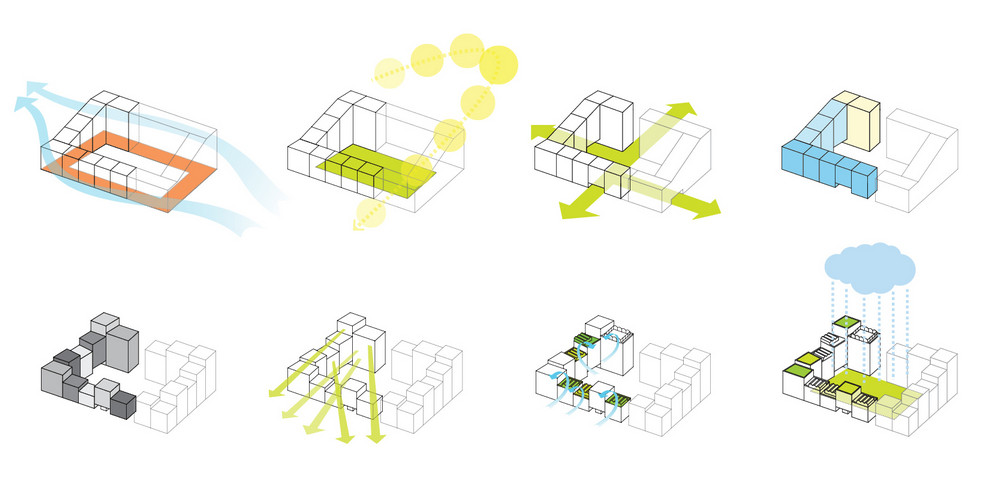
The opposite of the other examples, there is no explanation text and icon in this diagram. This diagram was created to show climatic features on context. We can understand from this diagram the wind, sun, rain conditions and accessibility of the building.

Sustainable systems should be explained in architectural diagrams as well as in this example. Sustainable architectural solutions are complex and sometimes tough to understand. For that reason, sustainability diagrams are used for a good architectural presentation.
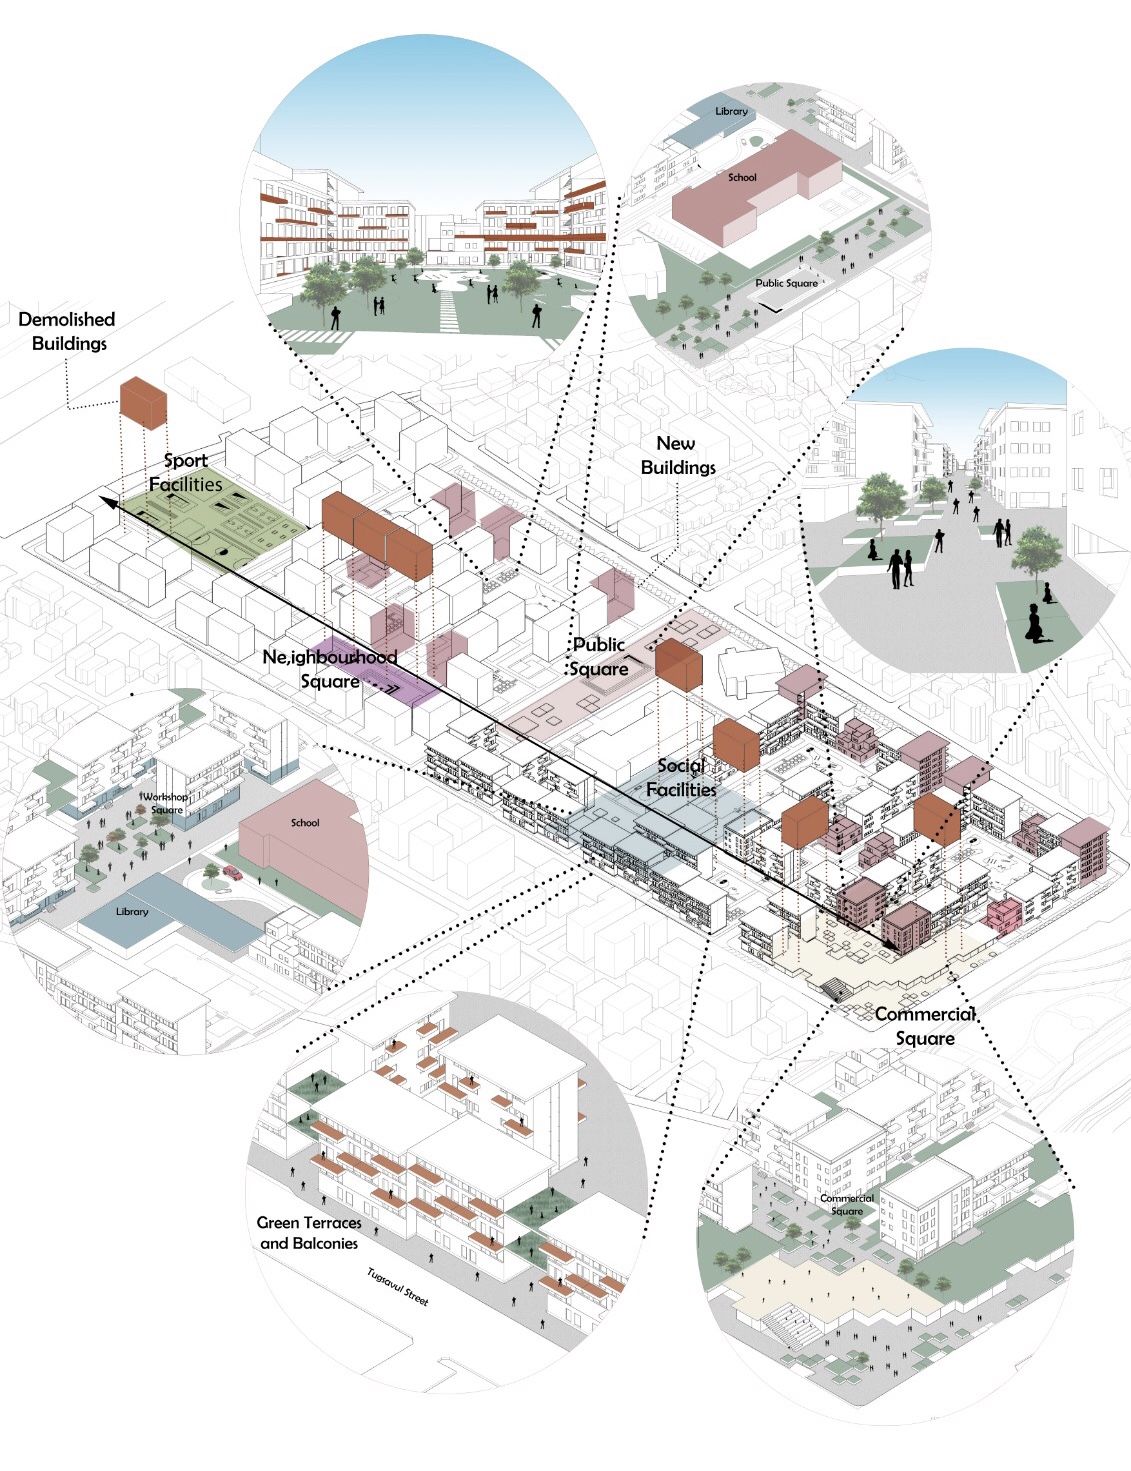
3 dimensional urban diagrams are also examples of urban diagrams like in the previous example. In this diagram, we can see the different facilities and scenarios of the buildings in an urban-scale.

Planimetric diagrams are used to explain programs and their relations between each other in the architectural spaces.

You can create sectional diagrams instead of technical section drawings.

Submit your architectural projects
Follow these steps for submission your project. Submission FormLatest Posts
Architecture Site Analysis Site Visit: A Guide to Better Design and Sustainability
Discover the importance of architecture site analysis and site visits in creating...
Unlocking Creativity: The Power of Architecture Bubble Diagrams in Design Process
Discover the vital role of bubble diagrams in architecture, enhancing clarity and...
Essential Tips for Evaluating Your Architectural Site Analysis for Successful Projects
Discover the key to successful architectural design with a thorough evaluation of...
How to Use Bubble Diagrams for Architectural Planning: A Complete Guide
Unlock the secrets of architectural planning with bubble diagrams—an essential tool that...



Leave a comment