

How to Use Bubble Diagrams for Architectural Planning
A practical look at how to use bubble diagrams for architectural planning: what they are, how to create them, common mistakes, and where they fit before scaled plans.
 Muhammad Abdullatef - Tifa Studio21 February 20256 Mins read394
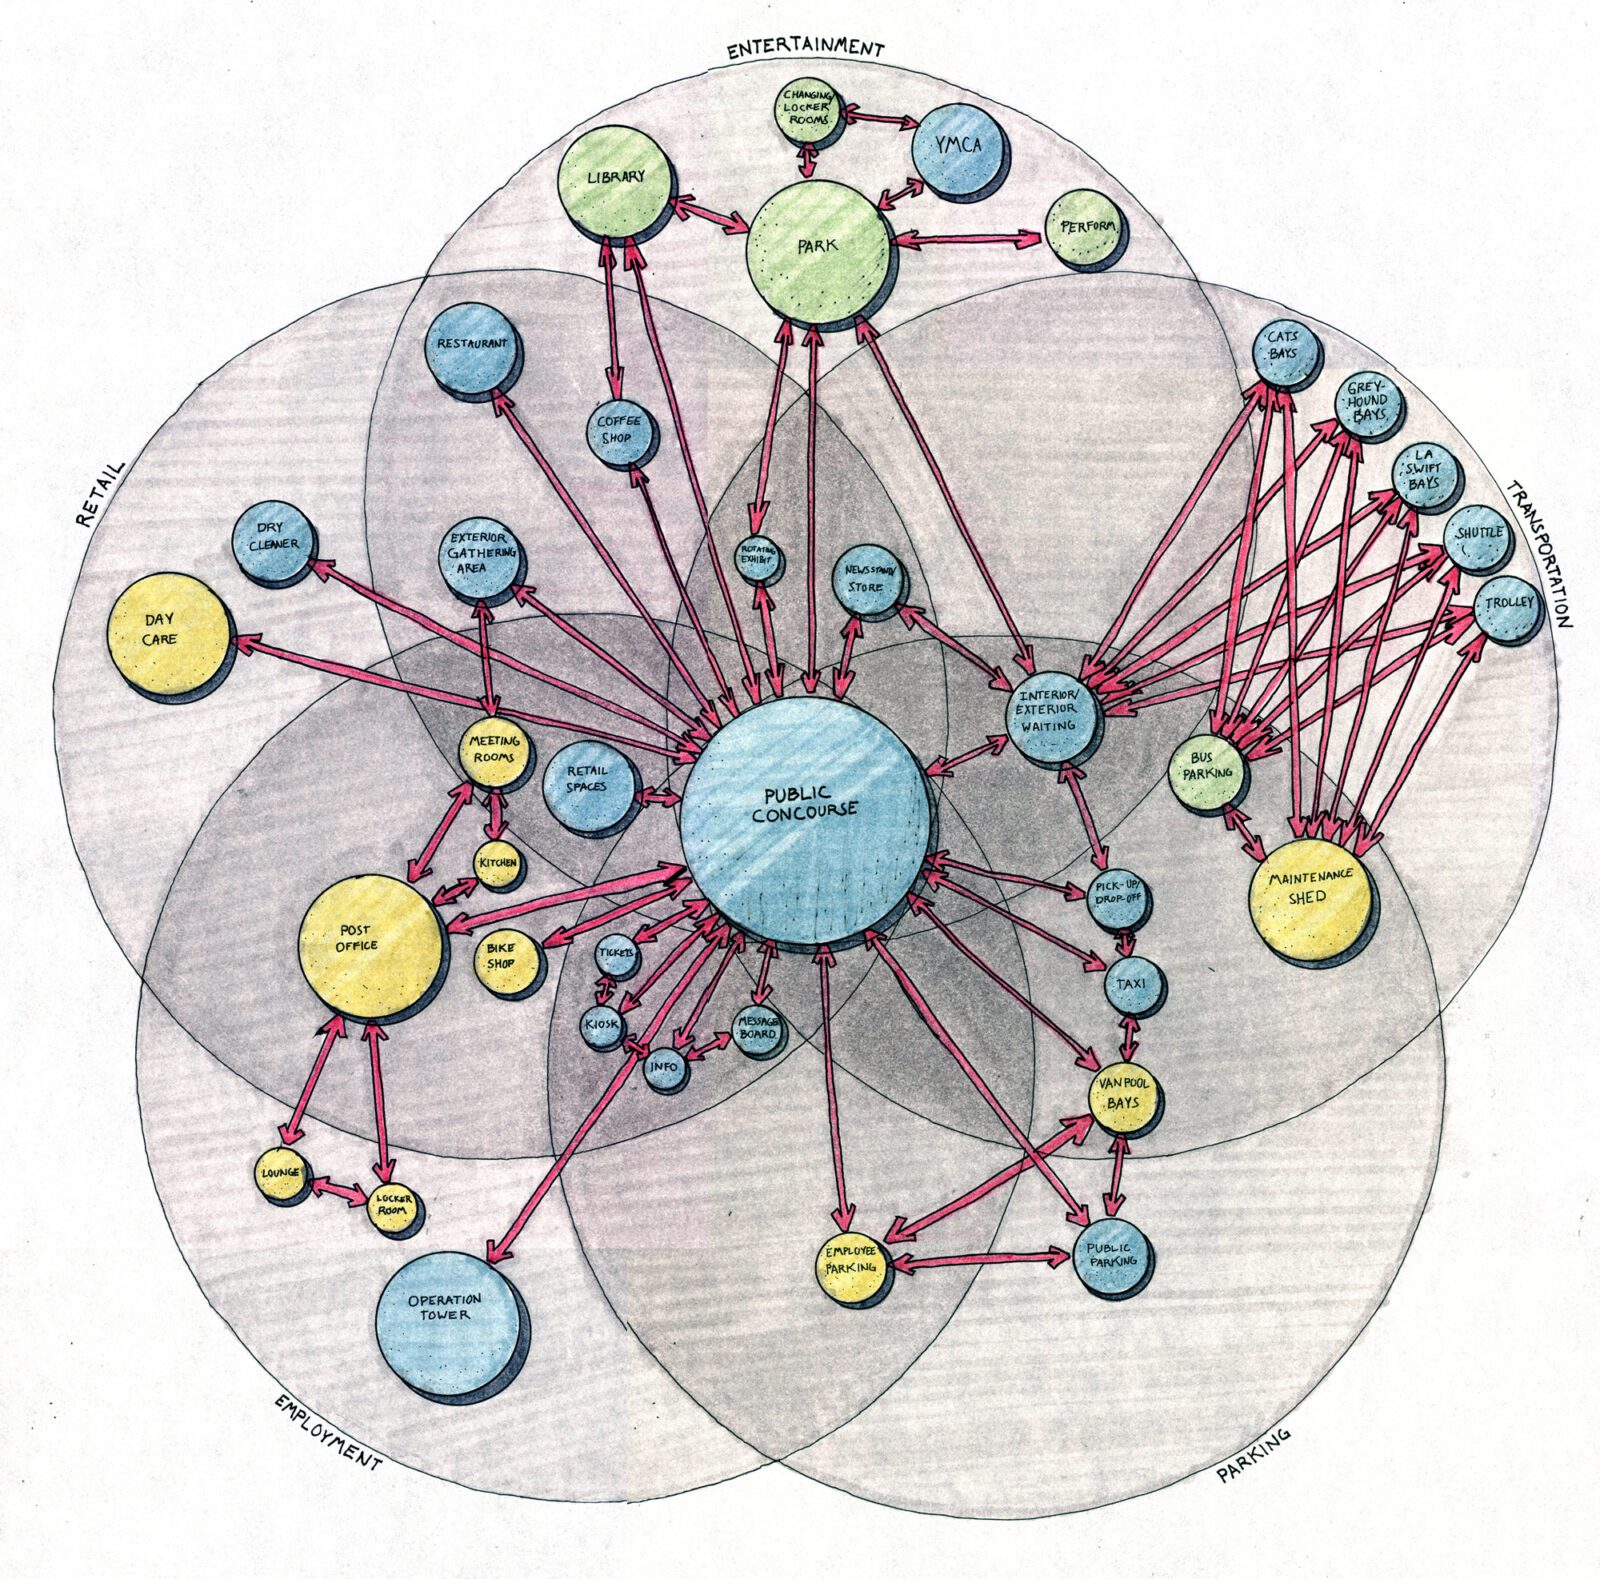


Table of Contents Show
Bubble diagrams in architecture are quick, loose sketches that use circles to represent rooms and lines to show how those spaces connect. Architects rely on them early in planning to test spatial relationships, circulation, and adjacencies before committing to a scaled floor plan, keeping the focus on function and flow.
Bubble diagrams are among the most useful tools in architectural planning because they help you visualize and organize spaces before a single wall is drawn. These simple sketches let you explore spatial relationships and design concepts without getting stuck in details. By focusing on the flow and function of a space, they give you a clear, flexible framework to guide the creative process.
Working with bubble diagrams early offers a real advantage. You can test different layouts and configurations in minutes, checking that a design actually meets the needs of the people who will use it. As you refine each version, problem areas and better options become easier to spot, which leads to more efficient and effective plans.
A small house and a busy commercial project both benefit from the same habit. Getting comfortable with bubble diagrams strengthens your architectural planning skills before any detailed drawing begins. The sections below cover how to create and use them, and where they fit alongside more precise documents.
What Are Bubble Diagrams?
Bubble diagrams are an initial spatial arrangement tool used in architectural planning. They consist of simple circles, or “bubbles,” to denote rooms or spaces, and lines or arcs to indicate the relationships and connections between them. By skipping details, bubble diagrams help you focus on spatial requirements and function without being tied to scale or precision. This freedom encourages creative exploration, letting architects study patterns, flows, and adjacencies. The result is a flexible platform for generating and comparing early design concepts. For a broader background on the method, the software publisher ACCA offers a clear overview of architectural bubble diagrams, and the architecture education site archisoup breaks down how bubble diagrams read in practice.
📌 Did You Know?
The bubble diagram grew out of architectural programming in the mid-20th century, when firms began mapping how rooms should relate before drawing any plans. It remains a standard first step taught in most architecture and interior design programs today.
Try Our Free Bubble Diagram Maker Tool
Free Online Bubble Diagram Maker
Benefits Of Using Bubble Diagrams In Architectural Planning
Bubble diagrams offer several clear advantages in architectural planning. They speed up the early design process by clarifying spatial relationships, improving communication, and opening room for creative solutions.
Enhancing Spatial Relationships
Bubble diagrams help you understand and improve the spatial relationships between different areas. By visually representing room sizes and connections, you can adjust and refine layouts to meet functional requirements. This visual aid lets you anticipate and resolve potential spatial problems early, when changes cost nothing but time.
Facilitating Communication
These diagrams improve communication among team members and stakeholders by giving everyone a clear visual of the design concept. You convey ideas quickly, so the whole team shares one understanding of the project’s spatial layout. That shared picture supports collaboration and makes consensus easier to reach.
Encouraging Creative Solutions
Creative solutions come naturally through bubble diagrams. You can explore many design possibilities without restriction, which leads to fresh concepts and layouts. This flexibility improves your ability to develop designs that are both functional and pleasant to move through.
Steps To Create A Bubble Diagram
Creating a bubble diagram follows a systematic approach to defining and visualizing the spatial elements of a project. Here is how to build one that actually helps your planning.
Identify Functional Spaces
First, identify every functional space the project needs. List areas such as living rooms, kitchens, and bathrooms so you account for real user needs. Naming each bubble by its function keeps the diagram tied to the program rather than to furniture or finishes.
Determine Space Relationships
Next, define the relationships between those spaces. Assess how areas interact by considering proximity and flow. Marking connections such as adjacency or direct access between related bubbles makes the functional layout clear at a glance.
Draft The Bubble Diagram
Finally, draft the diagram by sketching a circle for each space. Use different sizes to suggest relative scale, and draw lines to mark the connections you defined. Arrange the bubbles according to the relationships from the previous step, then refine and adjust until the layout supports the project goals.
Bubble Diagram Elements At A Glance
The table below summarizes the main parts of a bubble diagram, what each one communicates, and a practical tip for using it well.
| Step / Element | What It Shows | Tip |
|---|---|---|
| Functional bubbles | Each room or activity zone in the program | Name every bubble by function, not by furniture |
| Bubble size | Relative importance or rough area of a space | Keep sizing loose; these are not to scale |
| Solid lines | Strong or direct connections such as direct access | Use for spaces that must sit next to each other |
| Dashed lines | Weaker or secondary relationships | Use for visual or acoustic links, not physical access |
| Arrows | Primary circulation and movement flow | Trace the main path a user takes through the plan |
💡 Pro Tip
When you draft a bubble diagram, sketch two or three versions of the same program instead of polishing one. Fast, throwaway variations often reveal a better circulation path or adjacency that you would miss by committing to a single layout too early.
Tips For Effective Bubble Diagrams
Good bubble diagrams take a little thought to execute. A few habits keep them clear and useful throughout the planning process.
Use Clear Annotations
Annotations clarify the function of each space. By labeling every bubble, you specify what each area represents, whether it is a dining room or a storage closet. Short notes on the connections explain how spaces interact. Marking a pathway, for example, can indicate the primary flow of movement and make the diagram easier to read.
Keep Diagrams Simple
Simplicity keeps the focus on spatial relationships. By limiting the number of bubbles and avoiding over-detailing, you concentrate on the core interactions. An uncluttered sketch is also faster to adjust and re-evaluate. Large, plain circles convey the scope of spaces better than fussy shapes, and they prevent distraction from details that belong in a later drawing. When the concept feels solid, ArchDaily has a helpful piece on how graphs and diagrams support architectural presentations as ideas move forward.
📐 Technical Note
In standard practice, solid lines between bubbles indicate a strong or direct relationship such as direct access, while dashed lines show a weaker or secondary connection. Bubble size is relative and signals a space’s importance or approximate area, not an exact measurement, since bubble diagrams are drawn without scale.

Common Mistakes To Avoid
Overcomplicating the design. Some designers add unnecessary complexity to their bubble diagrams. Clutter disrupts the primary focus on spatial relationships and makes key interactions hard to read. Keep the sketch clean and focused.
Neglecting functionality. Chasing looks alone can compromise how a project works. That oversight leads to misaligned spaces or poor flow. Prioritize functional needs first, then bring in design refinements.
Ignoring stakeholder input. A closed design process limits collaboration. Without stakeholder insight, a diagram can miss critical user requirements. Steady communication keeps the design aligned with every perspective.

Failing to test variations. A static design halts creative exploration. Testing different arrangements often uncovers better configurations, and experimentation improves both adaptability and outcome quality.
Relying only on bubble diagrams. Used alone, they can lead to incomplete planning. A bubble diagram is a starting point, so further detailing is needed to resolve practical constraints. Move on to scaled plans as the design matures.
Frequently Asked Questions
How do you start a bubble diagram?
Start by listing every space the project needs and drawing a circle for each one. Size the circles to suggest relative importance, then connect them with lines to show which spaces should sit near each other. Keep it loose and quick, since the goal is to test ideas, not to produce a finished drawing.
What is the difference between a bubble diagram and a floor plan?
A bubble diagram is a conceptual sketch that shows relationships and flow without scale, while a floor plan is a measured, technical drawing with exact dimensions, walls, and openings. The bubble diagram usually comes first and informs the plan that follows.
Do bubble diagrams need to be drawn to scale?
No. Bubble diagrams are deliberately drawn without scale. Circle sizes show relative importance or rough area, not precise measurements. Keeping them off scale is what lets you rearrange spaces freely before committing to real dimensions.
Can you make bubble diagrams digitally?
Yes. Many architects sketch by hand first, then move to digital tools for cleaner versions and easy edits. You can try our free bubble diagram maker to build and rearrange spaces online, which makes testing several layouts fast.
When should you stop using a bubble diagram?
Move on once the spatial relationships and circulation feel resolved and the team agrees on the arrangement. At that point, the diagram has done its job, and you shift to schematic and scaled drawings that add walls, dimensions, and structure.
Where To Go From Here
Getting comfortable with bubble diagrams gives your architectural planning a stronger, clearer start. They let you study spatial relationships, improve communication, and test creative design options in a visual, intuitive way before the detailed work begins. Used well, they streamline the whole process and set a solid foundation for the drawings that follow.
Your Next Step: Pick a small project or a single room and sketch three quick bubble diagrams for it in the next ten minutes. Compare how each version handles flow and adjacency, then carry the strongest one into your scaled plan.



4 Comments





Bubble Diagram for Residential Projects: From Brief to Layout
A step-by-step look at how a bubble diagram organizes a residential brief...
 Elif Ayse Sen8 Mins read
Spatial Organization Diagrams in Architecture: Types, Examples, and How to Choose
This guide breaks down the five core types of spatial organization diagrams...
 Sinan Ozen11 Mins read

Bubble Diagram School Design: A Step by Step Guide for Educational Buildings
A practical look at bubble diagram school design for educational buildings. It...
Elif Ayse Sen10 Mins read

Understanding Architectural Functional Relationship Diagrams: A Practical Guide
Functional relationship diagrams are essential planning tools that architects use during the...
Sinan Ozen7 Mins read


This article talks about bubble diagrams in architecture. They help in planning spaces and making layouts. I think it is interesting how they can improve communication among team members.
I really liked this article! Bubble diagrams sound like a fun way to plan spaces. It’s cool how they help us think about how rooms connect and work together. I can’t wait to try making my own!
This article explains bubble diagrams really well. They help organize spaces in architecture by using simple circles to show rooms and how they connect. I learned that they make it easier to plan layouts and communicate ideas with others. It’s important to keep them simple and clear!
I think bubble diagrams are okay for planning. They help to show spaces, but I don’t really get why they are so important.