

Understanding the Role of Bubble Diagrams in Modern Architecture Design
Explore the fascinating role of bubble diagrams in modern architecture, a vital tool for visualizing spatial relationships in design. Discover how these simple yet powerful sketches enhance creativity, communication, and efficiency by allowing architects to experiment with layouts without the burden of technical details.

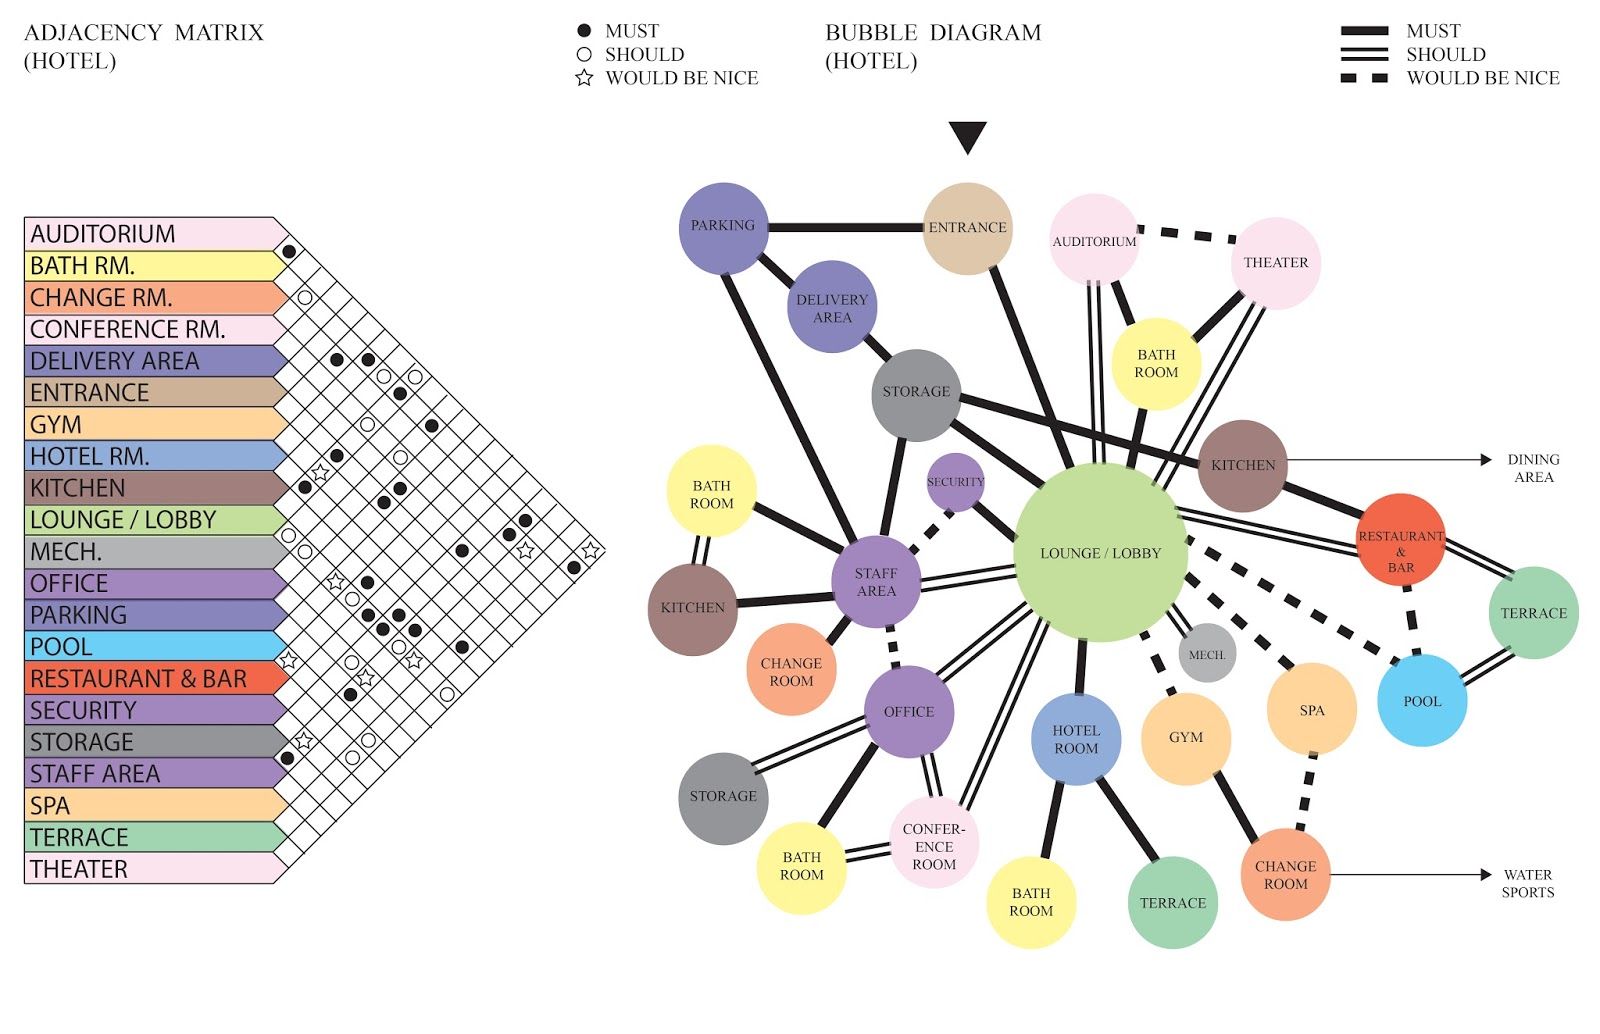


Table of Contents Show
Bubble diagrams are essential preliminary tools in architecture and interior design that help visualize spatial relationships during the early phases of design. In the ever-evolving world of modern architecture, the tools we use to conceptualize and communicate designs are just as crucial as the structures themselves. Among these tools, bubble diagrams stand out as a simple yet powerful way to visualize and organize spatial relationships during the initial phases of design. By allowing us to explore various layouts and functions, bubble diagrams in architecture help architects and designers ensure that every element finds its rightful place.
These diagrams serve as a bridge between abstract ideas and tangible designs. They enable us to experiment with different configurations without being bogged down by technical details too early in the process. As we sketch out these bubbles, we can easily see how spaces interact, which helps us refine our designs to meet the needs of clients and communities. Bubble diagrams are more than just circles on paper; they’re the first step in turning visionary concepts into reality.
What Is a Bubble Diagram in Architecture?
A bubble diagram is a preliminary architectural tool that uses circles or “bubbles” to represent different spaces, rooms, or functional areas within a design project. The bubble diagram architecture definition encompasses any visual representation where simple shapes indicate spatial zones and lines or proximity show relationships between them. Unlike detailed floor plans, bubble diagrams focus on conceptual organization rather than precise measurements.
Bubble diagrams serve as a preliminary tool in architectural design, helping us organize and visualize spatial relationships. These diagrams use simple circles to represent different spaces or functions, allowing us to explore various configurations efficiently. An essential aspect is their ability to clarify how spaces interact with one another during initial design phases.
Try Our Free Bubble Diagram Maker ToolIn our design process, bubble diagrams offer flexibility by minimizing the focus on technical specifics. This approach enables us to explore creative layouts, accommodating different spatial needs before delving into detailed plans. Bubble diagrams facilitate communication, ensuring that client ideas translate effectively into preliminary sketches.
When we use bubble diagrams, we can refine spatial arrangements dynamically. This adaptability empowers us to adjust layouts based on client feedback or new insights that arise during discussions. By providing a clear visual representation, bubble diagrams help us make informed decisions that align with project goals.
Incorporating bubble diagrams into our design workflow streamlines the transition from concept to tangible structure. It’s a crucial step that reinforces effective communication, creativity, and client satisfaction, all of which are key in modern architecture.

What Is a Bubble Diagram in Interior Design?
In interior design, a bubble diagram serves a similar purpose but focuses on the arrangement of spaces within an existing structure or defined area. Bubble diagram interior design applications help designers plan furniture layouts, traffic flow, and functional zones within rooms. Interior designers use these diagrams to ensure that living spaces, workspaces, and commercial interiors function optimally while meeting aesthetic requirements.
The key difference between architectural and interior design bubble diagrams lies in scale and focus. While architectural bubble diagrams typically address entire buildings or complexes, interior design diagrams concentrate on individual rooms or suites. Both applications share the fundamental goal of optimizing spatial relationships and user experience.

Historical Context of Bubble Diagrams
Bubble diagrams trace their roots back to the early 20th century, emerging as part of architectural design’s evolution. Architects began using these diagrams in response to the shifting focus toward functionalism and efficiency in building design. As modernism gained traction, there was a need for tools that could assist in visualizing spatial relationships without becoming bogged down by technical complexities.
Prominent figures like Le Corbusier and Frank Lloyd Wright valued conceptual approaches that included bubble diagrams, recognizing their potential in ideation and planning. During this era, these diagrams served a dual purpose: streamlining the architect’s creative process and optimizing spatial organization according to human needs and activities.
With the rise of computer-aided design (CAD) in the late 20th century, bubble diagrams retained their relevance, evolving from hand-drawn sketches to digital formats. They became an integral part of architectural education, teaching students the importance of spatial dynamics and functional layouts. This historical development illustrates the diagram’s enduring utility in bridging conceptual and practical elements of architecture, adapting to technological advancements while maintaining their core purpose.
The Role of Bubble Diagrams in Modern Architecture
Bubble diagrams hold a foundational role in modern architecture. They enhance spatial planning and facilitate effective communication in design processes.
Enhancing Spatial Planning
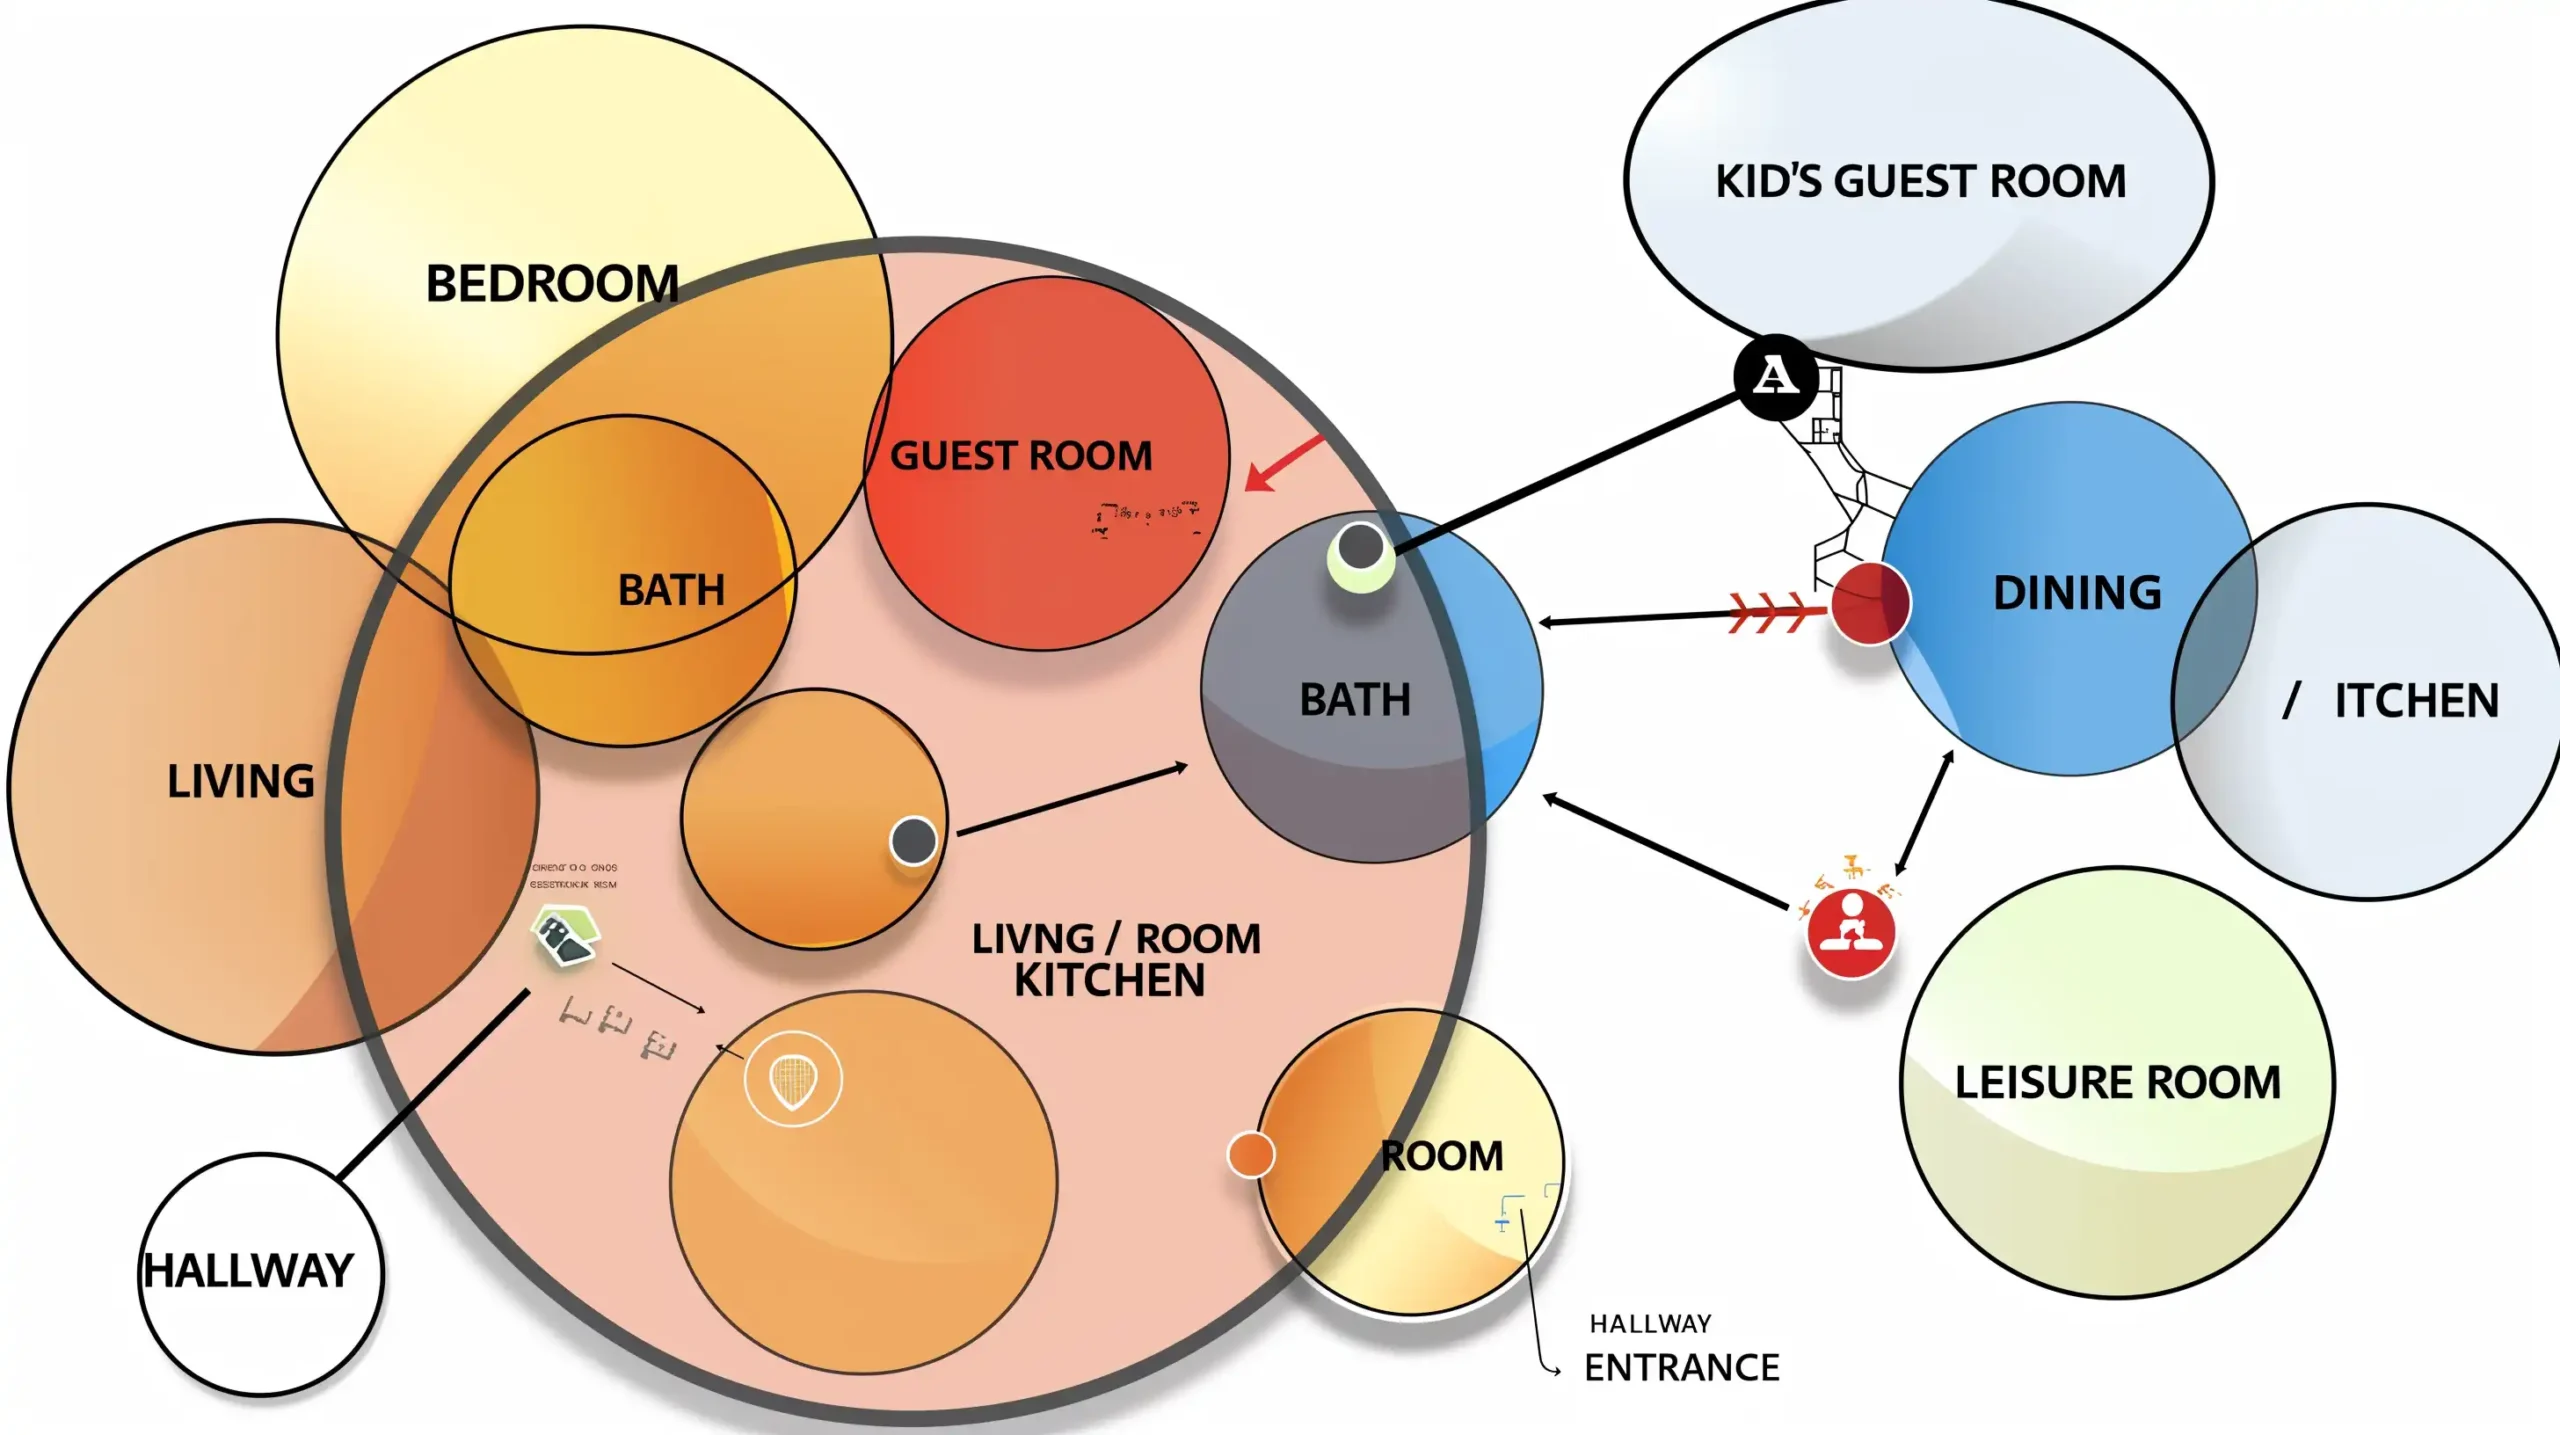
Bubble diagrams excel in spatial planning by helping architects visualize potential layouts. They allow us to see relationships between different spaces, such as how a kitchen connects to a living area. This visualization aids in determining efficient spatial organization, accommodating both functionality and aesthetics. By using simple shapes, we can experiment with various configurations without delving into details prematurely. This flexibility ensures that we can refine layouts in alignment with architectural and user needs, adapting designs quickly in response to conceptual clarity and project requirements.
Facilitating Communication
Bubble diagrams play a critical role in communication between architects and clients. These visual tools help convey complex ideas simply and effectively, bridging the gap between abstract concepts and client expectations. When clients provide feedback, we can easily revise diagrams, making immediate adjustments clear without technical jargon. This iterative process fosters a collaborative dialogue, ensuring that client visions transform seamlessly into actionable design layouts. By cementing a shared understanding, bubble diagrams improve overall project satisfaction and stakeholder engagement, reinforcing their significance in modern architectural practices.
Bubble Diagram Architecture Symbols and Legend
Understanding bubble diagram architecture symbols is essential for creating effective diagrams. A proper bubble diagram architecture legend typically includes several standard elements that convey specific meanings:
Circle sizes indicate relative space requirements—larger bubbles represent rooms needing more square footage, while smaller bubbles show compact areas. Line types demonstrate relationship strength: solid lines indicate essential connections, dashed lines show optional or secondary relationships, and double lines represent high-traffic pathways. Colors often categorize functional zones—public areas in one color, private spaces in another, and service zones in a third. Arrows indicate circulation direction and traffic flow patterns throughout the space.
When creating your architectural bubble diagram, always include a legend that explains your symbol system. This ensures that anyone reviewing the diagram can understand the spatial relationships and design intent without additional explanation.

Benefits of Using Bubble Diagrams
Bubble diagrams streamline the design process by enhancing clarity and communication. They support creative exploration and efficient spatial organization.
Flexibility in Design
Bubble diagrams offer unrivaled flexibility. By utilizing simple shapes, we can quickly evaluate different configurations. This adaptability enables us to make rapid adjustments based on emerging needs or client preferences. The visual simplicity encourages out-of-the-box thinking, allowing for innovative solutions to complex design challenges.
Optimizing Functionality
We optimize functionality through strategic spatial organization using bubble diagrams. By visually mapping out relationships between spaces, we ensure efficient workflows and accessibility. For instance, aligning kitchen and dining areas enhances usability. This method helps us focus on practical needs without delving into technical complexities early in the design phase.
How to Create a Bubble Diagram: Step-by-Step Guide
Learning how to create a bubble diagram is fundamental for architects, interior designers, and students. Follow these steps to develop effective bubble diagrams for your projects:
Step 1: List All Required Spaces
Begin by identifying every space or function needed in your design. For a bubble diagram house project, this might include bedrooms, bathrooms, kitchen, living room, dining area, garage, and outdoor spaces. Document the approximate size requirements for each space.
Step 2: Analyze Relationships
Determine which spaces need direct connections. A kitchen typically requires proximity to the dining room and pantry. Bedrooms benefit from adjacency to bathrooms. Create a relationship matrix to track these connections systematically.
Step 3: Draw Initial Bubbles
When learning how to draw a bubble diagram, start with rough circles representing each space. Size the bubbles proportionally to the required area. Place related spaces close together and use varying line weights to show connection importance.
Step 4: Refine and Iterate
Review your initial diagram for logic and flow. Adjust bubble positions to minimize unnecessary connections and optimize circulation paths. This iterative process is central to understanding how to make a bubble diagram that effectively communicates design intent.

Bubble Diagram Floor Plan Development
A bubble diagram floor plan represents the transitional stage between conceptual bubbles and detailed architectural drawings. This evolution involves gradually replacing abstract circles with more defined shapes that reflect actual room proportions and building constraints.
To develop a bubble diagram into a floor plan, architects overlay the bubble arrangement onto the site plan, considering factors like orientation, views, and structural requirements. The bubbles transform into rectangular or irregular shapes that fit within the building footprint while maintaining the established spatial relationships.
This process is particularly valuable for bubble diagram architecture house projects, where residential designs must balance family needs with site constraints and building codes. The transition from bubbles to floor plans allows designers to test their conceptual ideas against practical realities while preserving the original design intent.
Tools and Techniques for Creating Bubble Diagrams
Architects employ various tools and techniques to create effective bubble diagrams. Traditional drawing methods laid the groundwork by using pencils and paper to sketch intuitive spatial relations. This hands-on approach offers direct engagement with the design process but may lack flexibility.

Digital Bubble Diagram Makers and Creators
Modern bubble diagram maker tools and bubble diagram creator software have revolutionized how architects approach early-stage design. In contemporary practice, digital tools have significantly enhanced the creation of bubble diagrams. Software such as AutoCAD, Revit, and SketchUp allow precise manipulation of space elements. These platforms provide features like drag-and-drop and layering, enabling architects to experiment swiftly with multiple configurations and layouts. They also offer seamless integration with other design phases, streamlining the workflow from conceptualization to detailed planning.
Online architectural bubble diagram maker tools like Illustrarch’s free bubble diagram tool, Lucidchart, and Miro provide accessible options for quick diagram creation without specialized software. These platforms are particularly useful for students learning architecture fundamentals and professionals needing rapid visualization tools.
AI Bubble Diagram Tools
The emergence of AI bubble diagram generators represents the latest advancement in architectural planning tools. These intelligent systems can analyze program requirements and suggest optimal spatial arrangements based on established design principles. While AI tools cannot replace the creative judgment of experienced architects, they accelerate the exploration phase by generating multiple layout options for evaluation.

Bubble Diagram Excel Method
Creating a bubble diagram Excel spreadsheet is a practical approach for those without specialized design software. Using Excel’s chart functions, designers can create basic bubble diagrams by plotting spaces as data points with bubble sizes representing area requirements. While less visually refined than dedicated tools, this method provides an accessible entry point for spatial planning.
Moreover, graphic design software like Adobe Illustrator further refines visualization by delivering high-quality presentations. This encourages clearer communication with clients and stakeholders through polished and understandable visuals. By leveraging these digital tools, we enhance accuracy and efficiency in representing spatial relationships, ensuring our designs remain responsive and adaptive to evolving architectural needs.
Additionally, we incorporate techniques such as spatial analysis and zoning, which facilitate the creation of bubble diagrams. Spatial analysis helps evaluate how different spaces interact based on factors like accessibility and use patterns. Zoning categorizes areas within a design, streamlining the process by organizing functions according to user requirements and project priorities. Together, these techniques ensure a thorough understanding of the spatial dynamics, fostering innovative solutions in architectural design.
3D Bubble Diagram Architecture
3D bubble diagram architecture extends traditional two-dimensional planning into vertical space, allowing architects to visualize multi-story relationships and vertical circulation. This approach is particularly valuable for complex projects where understanding the interaction between floors is critical to the design’s success.
In 3D bubble diagrams, spheres replace circles, and vertical connections show how spaces on different levels relate to each other. Stairwells, elevators, and atrium spaces become clearly visible as connective elements between floors. Software like Rhino and SketchUp facilitate the creation of these dimensional diagrams, providing architects with powerful visualization capabilities.

Bubble Diagram Architecture Templates
Using a bubble diagram architecture template can accelerate the design process, especially for common building types. Templates provide pre-established frameworks for typical projects like residential homes, office buildings, or educational facilities.
Effective templates include standard room configurations, typical adjacency requirements, and common circulation patterns. Architects can customize these frameworks to meet specific project needs while benefiting from proven spatial relationships. Many architectural resources and educational institutions offer downloadable templates for students and professionals.

Bubble Diagram Architecture Examples
Examining bubble diagram architecture examples helps illustrate best practices and common approaches across different project types.
Urban Community Center
In the design of the Greenpoint Community Center, architects used bubble diagrams to organize diverse functions such as recreational facilities, meeting rooms, and administrative offices. The diagrams allowed them to visualize spatial relationships, ensuring logical flow and accessibility throughout the building. By prioritizing community needs in the layout, the design facilitated seamless interactions between distinct areas, enhancing user experience.
Innovative Educational Facility
The New Horizons School project showcased how bubble diagrams can optimize learning environments. Architects used these tools to map out classrooms, laboratories, and common areas, identifying potential connections and adjacencies that promote collaborative learning. As a result, the school’s layout fosters interaction between students and staff, supporting an innovative and adaptable educational atmosphere.
Eco-Conscious Residential Complex
In the Sunrise Eco-Residences, bubble diagrams played a pivotal role in achieving sustainability goals. Architects employed the diagrams to address spatial challenges, including natural light distribution and energy-efficient design. Diagrams enabled the team to experiment with various configurations, integrating green spaces and shared amenities efficiently. This approach ensured the final design met environmental standards and resident comfort alike.
Through these case studies, we see bubble diagrams’ capacity to transform abstract ideas into actionable design solutions. Their application across diverse architectural contexts underscores their versatility and value in modern design.
Challenges and Limitations
While bubble diagrams offer various benefits in early-stage architectural design, they present certain challenges and limitations. One common issue is the potential oversimplification of complex spatial relationships. Bubble diagrams rely on basic shapes to represent spaces, which may lead to a lack of clarity in representing specific dimensions or connections between spaces like utility access or building codes.
Another challenge arises when translating bubble diagrams into detailed architectural plans. The abstract nature of these diagrams can create discrepancies between the intended design and the technical specifications required in later stages. In certain cases, architects need to invest additional time and resources to refine layouts to address these gaps, potentially delaying project timelines.
Additionally, dependence on bubble diagrams may limit consideration for construction materials and structural integrity. While valuable for exploring spatial configuration, bubble diagrams often exclude details essential for constructing sustainable, long-lasting buildings. Without incorporating construction-specific elements early on, architects might face unforeseen challenges in later design stages, such as material constraints or structural adjustments.
Lastly, client interpretation issues can arise if bubble diagrams lack context or adequate explanation. Clients with limited architectural knowledge might struggle to understand the abstract representations, leading to misaligned expectations. Ensuring effective communication and providing clear context is crucial to mitigate misunderstandings and maintain collaborative progress.

Conclusion
Bubble diagrams serve as an indispensable tool in modern architecture and interior design. Their ability to streamline design processes by enhancing clarity and fostering creativity has proven invaluable. By simplifying complex spatial relationships, these diagrams optimize the connection between concept and structure. Our exploration into their historical evolution and practical applications reveals their indispensable role in planning, illustrating their continued relevance. Despite their limitations, such as potential oversimplifications, bubble diagrams remain a cornerstone in architectural practices, guiding projects from initial brainstorming to final execution with precision and adaptability.
Whether you’re using a traditional pencil sketch, an AI bubble diagram generator, or a professional bubble diagram maker, the fundamental principles remain the same: start with clear program requirements, establish meaningful spatial relationships, and iterate until your design achieves optimal functionality and flow.

Frequently Asked Questions About Bubble Diagrams
What is a bubble diagram in architecture?
A bubble diagram in architecture is a preliminary design tool that uses circles or “bubbles” to represent different spaces or functional areas within a building project. Each bubble represents a room or zone, and the connections between bubbles show spatial relationships. Architects use bubble diagrams during the conceptual phase to explore layout options before creating detailed floor plans.
How do you create a bubble diagram?
To create a bubble diagram, start by listing all required spaces and their approximate sizes. Next, analyze which spaces need direct connections to each other. Draw circles representing each space, sizing them proportionally to the required area. Connect related spaces with lines, using solid lines for essential connections and dashed lines for secondary relationships. Finally, iterate and refine the diagram until the spatial organization meets your project goals.

What software can I use to make bubble diagrams?
You can create bubble diagrams using various tools including professional CAD software like AutoCAD, Revit, and SketchUp, graphic design tools like Adobe Illustrator, online bubble diagram makers like Lucidchart and Miro, spreadsheet programs like Excel, or dedicated architectural bubble diagram tools. Even traditional pencil and paper remain effective for quick conceptual sketches.
What is the difference between a bubble diagram and a floor plan?
A bubble diagram is an abstract, conceptual tool that shows spatial relationships using simple circles and connections, without precise measurements or architectural details. A floor plan is a detailed, scaled drawing that shows exact room dimensions, wall placements, doors, windows, and other architectural elements. Bubble diagrams typically precede floor plans in the design process, helping architects establish the basic layout before committing to specific measurements.
Can bubble diagrams be used for interior design?
Yes, bubble diagrams are widely used in interior design to plan furniture arrangements, traffic flow, and functional zones within existing spaces. Interior designers use bubble diagrams to visualize how different areas within a room or suite relate to each other, ensuring optimal space utilization and user experience before developing detailed design plans.


5 Comments


Bubble Diagram for Residential Projects: From Brief to Layout
A step-by-step look at how a bubble diagram organizes a residential brief...

Spatial Organization Diagrams in Architecture: Types, Examples, and How to Choose
This guide breaks down the five core types of spatial organization diagrams...

Bubble Diagram School Design: A Step by Step Guide for Educational Buildings
A practical look at bubble diagram school design for educational buildings. It...

Understanding Architectural Functional Relationship Diagrams: A Practical Guide
Functional relationship diagrams are essential planning tools that architects use during the...

This article talks about bubble diagrams in architecture. It seems useful for organizing spaces. I think it’s interesting how they help in the design process.
I really liked this article! Bubble diagrams sound like a fun and easy way to plan spaces. It’s amazing how simple shapes can help architects organize their ideas. I can’t wait to see how they are used in real buildings!
This article explains bubble diagrams very well. They help architects plan spaces easily by using simple circles. It’s interesting how they have been used since the early 20th century and are still important today, especially with new technology. Bubble diagrams make it easier for designers to share ideas with clients.
I think bubble diagrams are useful for architects. They help in showing how different spaces connect. It’s interesting to know they have been used for a long time.
The article explains bubble diagrams well. They seem to make the design process easier, especially in the beginning. I like that they help with planning and communication.