

Average Apartment Sizes by City: A Global Comparison
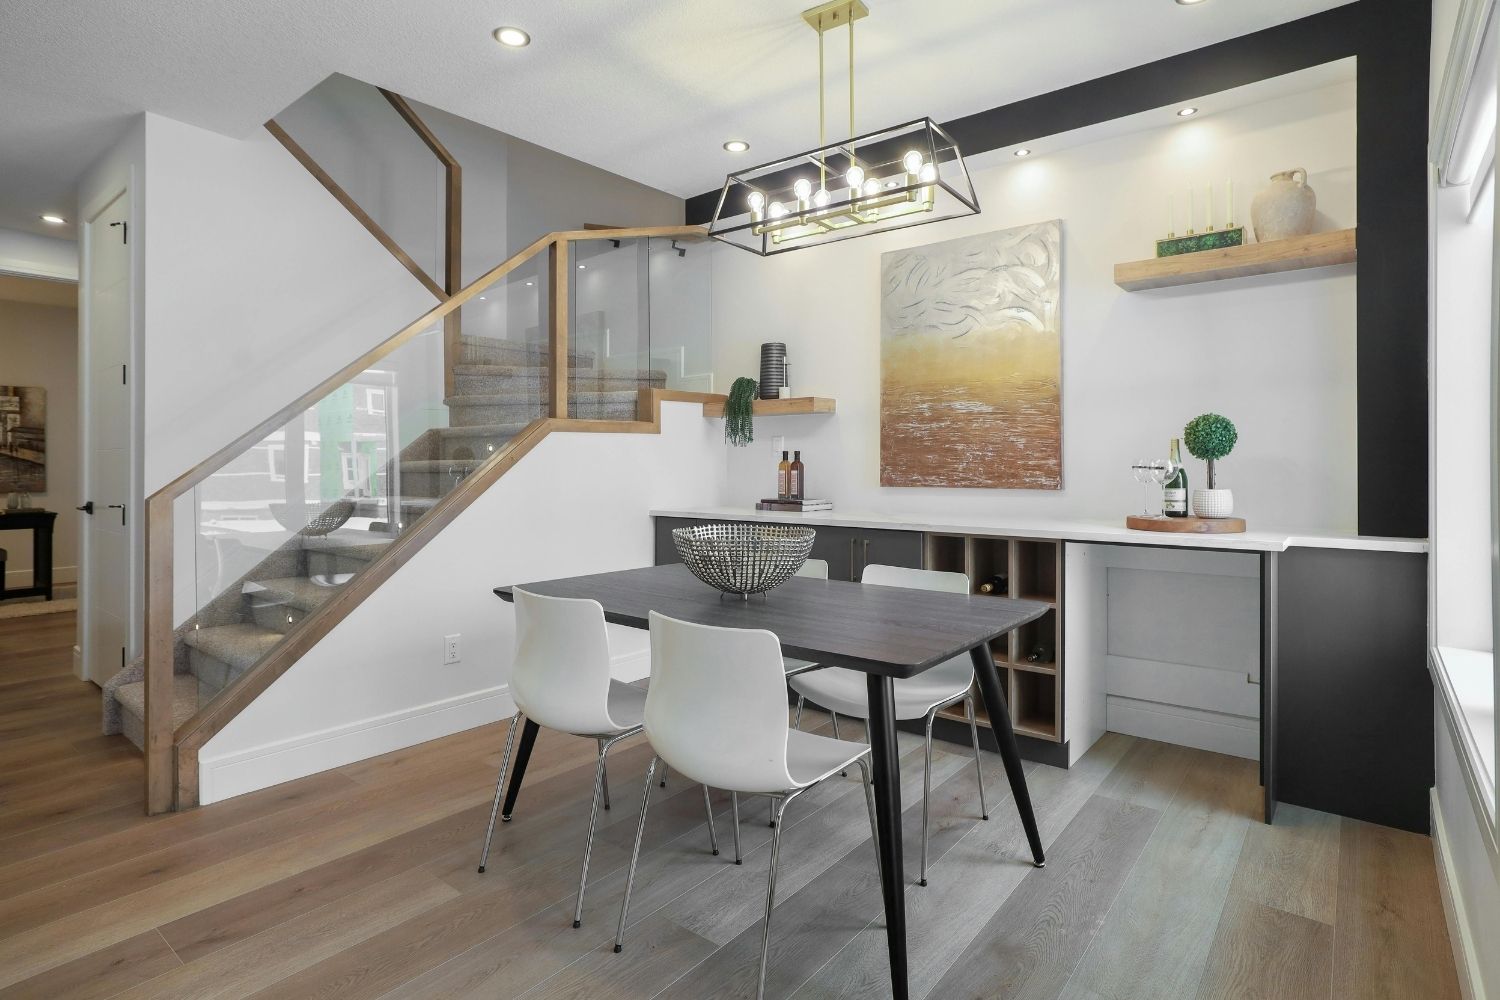
Apartment sizes vary dramatically around the world, from Tokyo micro-units of 10 square meters to spacious U.S. rentals averaging 908 square feet. This guide breaks down the average studio apartment size and overall apartment dimensions across major global cities, comparing standards, market trends, and what space looks like in each region.

Table of Contents Show
The average studio apartment size ranges from roughly 10 square meters (108 sq ft) in Tokyo to 457 square feet (42 m²) in the United States, with most cities falling somewhere in between. Apartment sizes reflect a mix of land prices, planning regulations, cultural norms, and household demographics, which is why a one-bedroom in Manhattan and a one-bedroom in Marietta can differ by several hundred square feet.
Apartment sizes have become one of the most visible markers of how cities respond to density, affordability, and lifestyle change. A renter moving from Atlanta to Paris will quickly notice that the same monthly budget buys very different amounts of space, and the same is true comparing Sydney to Hong Kong or Tokyo to Buenos Aires. The shape of apartment stock in a city tells you a lot about its housing policy, its history, and the people who live there.
This guide compares the average apartment size and average studio apartment size across major global cities, looking at hard numbers, regulatory floors, and the trends shaping new construction in 2024 and 2025.
What Counts as the Average Apartment Size?
Before comparing cities, the measurement itself needs a definition. Most published averages refer to gross internal floor area (GIA) — the space inside a unit’s external walls, including bathrooms, kitchens, and circulation, but excluding balconies, parking, and shared corridors. Studio apartments are usually counted as a subset of one-bedroom units, with the key difference being that a studio combines sleeping, living, and kitchen functions into a single open room (or a single room plus a partitioned bathroom).
Different countries use different units. The U.S. typically reports in square feet, while most of Europe, Asia, and Latin America use square meters (1 m² ≈ 10.76 sq ft). Japan adds another layer, where individual rooms are often described in jo (one tatami mat ≈ 1.62 m² or about 17.4 sq ft), even when the total apartment size is given in square meters. Listings in Tokyo commonly mix both, so a unit might be described as “1K, 25 m², main room 7 jo,” which translates to a studio of about 269 sq ft with a main living space of roughly 122 sq ft.
Averages can also be skewed by what’s being measured. A “city average” might cover all existing rental stock, only newly built apartments, or only listings on a particular property platform. The numbers in this guide note the source and scope where they differ, because a 1,072 sq ft national average for the U.S. (existing stock) and a 908 sq ft average for newly built apartments tell two different stories about the same market.
💡 Pro Tip
When comparing listings across countries, always confirm whether the quoted size is gross internal area, net usable area, or “carpet area.” In some Asian markets, advertised sizes include shared corridors and lobby space (called “saleable area” in Hong Kong), which can inflate the figure by 20% or more compared to the actual interior of the apartment.
Average Apartment Size in the United States
The U.S. has some of the largest apartment averages in the world, but the trend over the past decade has been one of compression — until very recently. According to RentCafe’s annual analysis, the average size of newly built apartments fell for years before turning a corner. In 2024, the national average for new apartments rose to 908 square feet, up 4 square feet year-over-year and reversing a decade-long shrinkage.
By unit type, average sizes for U.S. apartments built in 2024 were:
- Studio: 457 sq ft (42 m²)
- One-bedroom: 735 sq ft (68 m²)
- Two-bedroom: 1,097 sq ft (102 m²)
- Three-bedroom: 1,336 sq ft (124 m²)
Studios saw the biggest year-over-year gain, adding 13 square feet, while three-bedrooms actually shrank by 15 square feet. Across the existing rental stock — not just new builds — the U.S. average sits around 1,072 sq ft, with two-bedroom layouts making up the largest share at roughly 45% of all rental apartments.
Smallest and Largest U.S. Cities for Apartment Size
Regional variation inside the U.S. is enormous. Apartments built between 2015 and 2024 in Seattle averaged 649 square feet, the smallest among major cities, with Portland, Oregon close behind at 668 sq ft. San Francisco crossed back over the 700 sq ft mark at 716 sq ft after gaining 59 square feet in the last decade. Queens and Brooklyn pushed past 700 sq ft as well, at 702 and 708 respectively.
At the other end of the spectrum, Florida dominates. Tallahassee leads the country with new apartments averaging 1,130 square feet, followed closely by Gainesville. Several Atlanta suburbs — Marietta, Decatur, Norcross — also rank near the top, along with Birmingham, Alabama and Columbia, South Carolina, all averaging just under or above 1,000 sq ft.
🔢 Quick Numbers
- U.S. average new apartment size in 2024: 908 sq ft (RentCafe, 2025)
- Average new studio in the U.S.: 457 sq ft, up from 444 in 2023 (RentCafe, 2025)
- Smallest new apartments by major U.S. city: Seattle at 649 sq ft (RentCafe, 2025)
- Largest new apartments by U.S. city: Tallahassee, FL at 1,130 sq ft (RentCafe, 2025)
How Big Are Apartments in European Capitals?
European cities tend toward smaller apartments than American ones, especially in the dense historic capitals. The variation between European cities is also wider than people often assume — a Paris studio and a Madrid studio operate under very different size norms.
Paris: Among the Smallest in Europe
The typical home in Paris measures around 560 square feet (52 m²), which is roughly the size of a generous studio or compact one-bedroom in the U.S. The city’s housing stock is dominated by apartments, ranging from 19th-century Haussmann buildings to contemporary blocks, and the supply of small units is significant. Parisian regulations allow legal rental units as small as 96 sq ft (about 9 m²), provided the apartment meets minimum volume requirements, which has produced a long tail of tiny chambres de bonne (former maids’ rooms) at the bottom of the market.
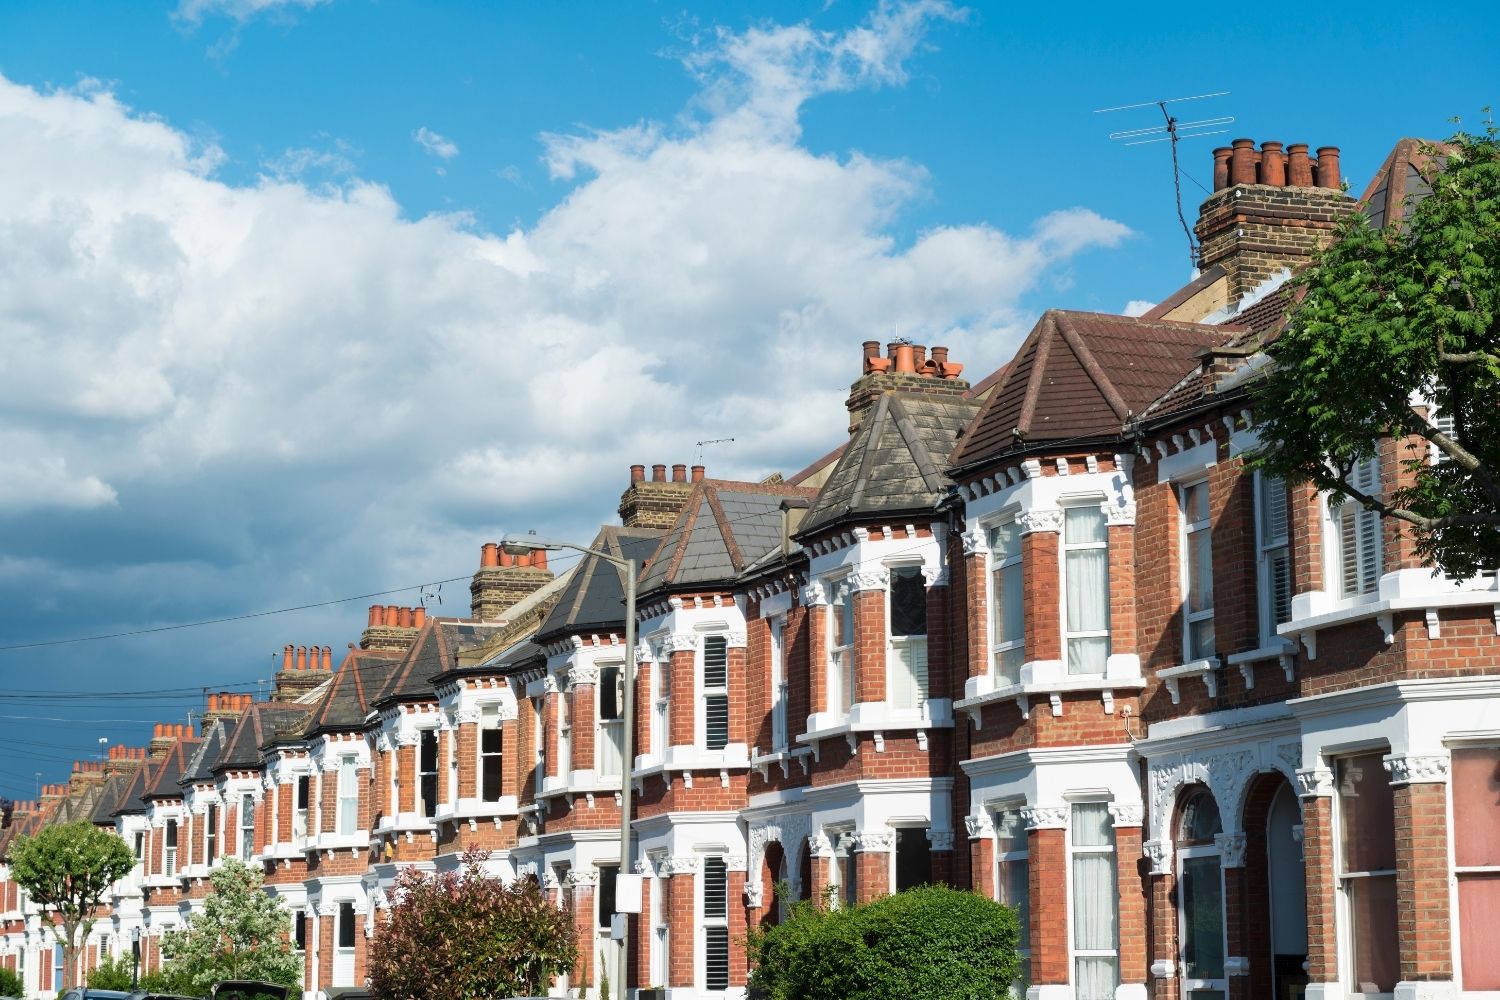
London: Tightly Regulated Minimums
London is one of the more strictly regulated apartment markets in Europe. Under the Nationally Described Space Standard adopted into the London Plan, the minimum floor area for any new one-bedroom, one-person home is 37 square meters (398 sq ft), rising to 50 m² (538 sq ft) for one-bed, two-person flats. Studio dwellings with a shower room can come down to 37 m², while those with a full bathroom must be at least 39 m². The Mayor of London’s 2023 best-practice guidance pushes these numbers about 10–14% higher, recommending 41 m² for a one-person studio and 77 m² for a two-bedroom, four-person flat.
In practice, average rented homes for single people in London consume about 25 m² per person, well below the regulatory minimum, which suggests a genuine mismatch between the units that get built and what single renters can actually afford. The Centre for Cities has documented this gap in detail, noting that only 17% of new homes in London fall below 50 m² even though 29% of London households are single.
Other European Cities
National averages give a rough sense of the wider regional picture: Italy averages around 90 m² (978 sq ft), the UK 85 m² (915 sq ft), Spain 85 m² (920 sq ft), France 88 m² (957 sq ft), and Germany 87 m² (946 sq ft) across all dwellings. These figures cover both apartments and houses, so urban apartment averages tend to sit below them. Capitals like Madrid, Berlin, and Rome generally fall in the 60–80 m² range for typical apartments, while Stockholm, Copenhagen, and Amsterdam have larger averages thanks to less density and different housing policies.
⚠️ Common Mistake to Avoid
Comparing average home sizes across countries without checking the unit type is misleading. Australia’s 2,303 sq ft national average and the UK’s 818 sq ft figure both include houses, but Australia’s stock is heavily weighted toward detached suburban houses, while the UK has a much higher share of flats and terraced housing. To compare apartments fairly, look for city-level apartment-only data, not country-level dwelling averages.
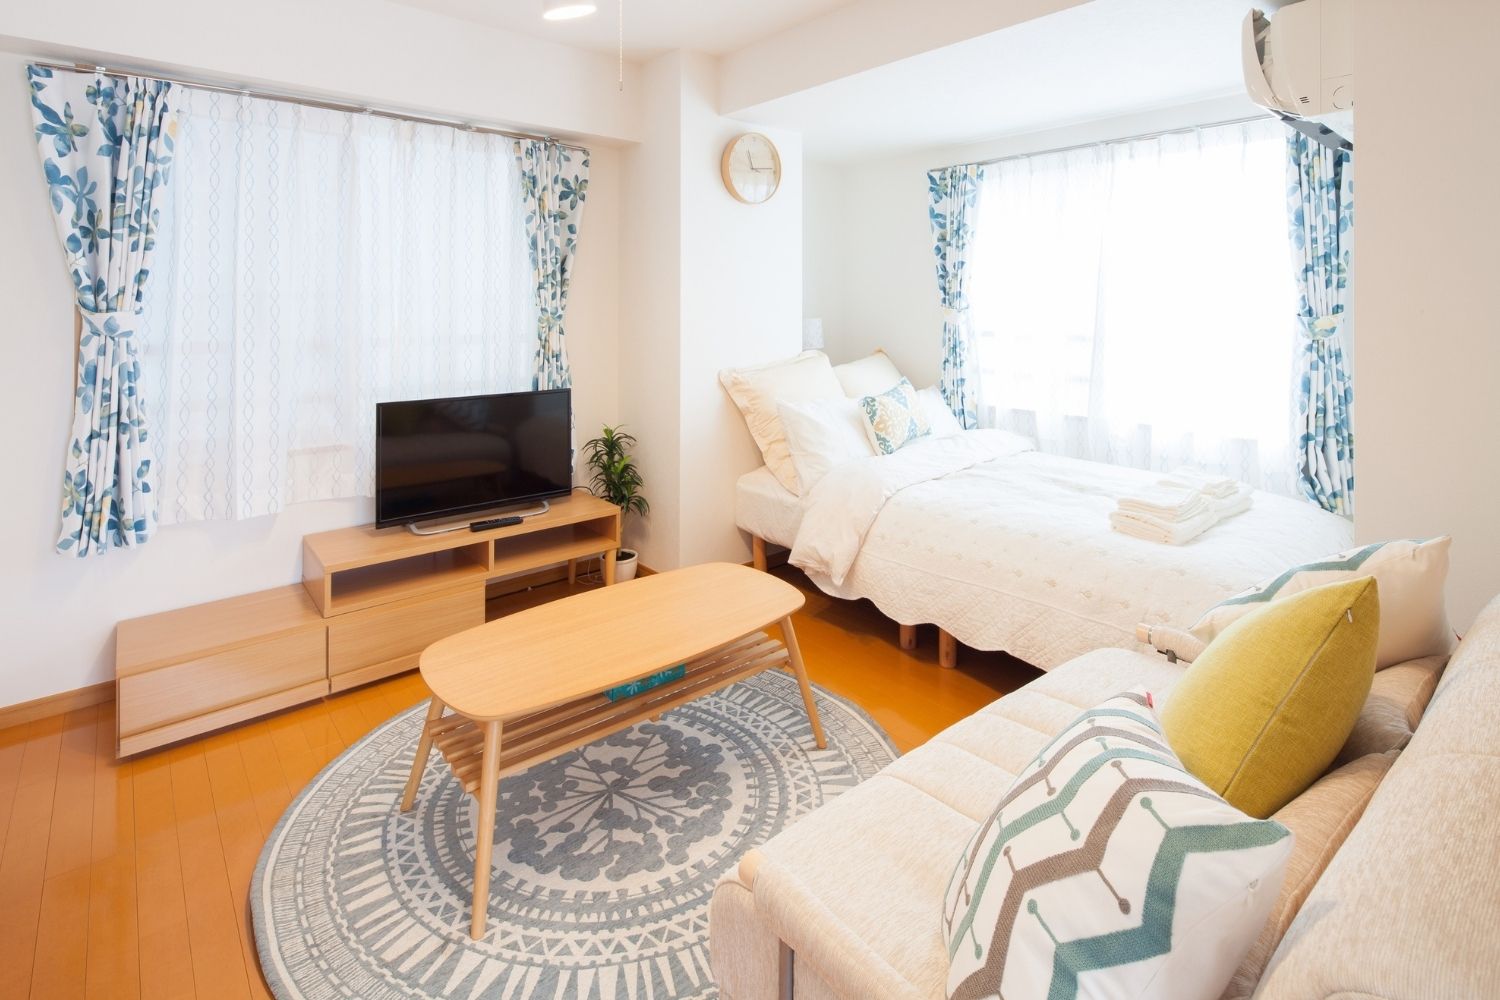
Why Are Tokyo Apartments So Small?
Tokyo is a useful case study because the city’s reputation for tiny units is partly accurate and partly mythologized. The average apartment in Tokyo is approximately 65–66 square meters (about 700 sq ft) according to Japan’s Ministry of Land, Infrastructure, Transport and Tourism, which is smaller than U.S. averages but not dramatically so. The “tiny apartment” image comes from the lower end of the market, where studios and 1K layouts can dip well below 20 m².
The MLIT housing guideline considers 25 m² (269 sq ft) the minimum for a single person living in a city to maintain a healthy life, with 40 m² (430 sq ft) as the ideal. Many central Tokyo units fall below the 25 m² ideal, particularly compact 1R (one-room) and 1K (one-room with separated kitchen) layouts, which typically range from 18 to 30 m². Studio apartments can be as compact as 10 m² (108 sq ft) in extreme cases. Over 1.4 million Tokyo households live in homes smaller than 19.7 m² (212 sq ft).
The reasons are structural. Tokyo combines very high land prices, particularly in the central wards of Chiyoda, Minato, Shibuya, Shinjuku, and Chuo, with a large population of single-person households and a planning culture that has historically been more permissive about small units than London or New York. Developers respond by maximizing every square meter, leading to multipurpose rooms, modular unit baths, and storage built into ceilings and walls.
Apartment Sizes in Other Major Global Cities
Outside North America, Europe, and Japan, apartment averages vary widely. The dataset compiled by Buildworld in 2023 surveyed 72 capital cities and produced median home sizes that include both apartments and houses, but the figures still illustrate the global spread:
| City | Median Home Size (sq ft) | Median Home Size (m²) | Notes |
|---|---|---|---|
| Paris | 560 | 52 | Apartment-dominated stock |
| Mexico City | 665 | 62 | Tight supply, ongoing housing crisis |
| Buenos Aires | 689 | 64 | High-rise apartments and townhouses |
| Tokyo | ~700 | 65 | MLIT data, varies widely by ward |
| New York City | 779 | 72 | Smaller in Manhattan, larger in outer boroughs |
| Manila | 1,668 | 155 | Wide variation between informal and high-end |
| Los Angeles | 1,488 | 138 | Includes single-family stock |
The Manila figure is striking because it reflects the wide spread in Philippine housing — the median is pulled up by spacious gated communities and luxury towers, while a significant share of the population lives in much smaller informal housing. Mexico City and Buenos Aires are tighter than their country averages because of capital-city density. New York’s 779 sq ft median sits in the middle of the global range, though Manhattan-only figures come in well below that.
One useful per-person comparison: in New York, residents have access to about 1,010 square feet of housing space per person, while Paris residents have around 520 sq ft per person, and Manila residents as little as 250 sq ft per person. Los Angeles, with its sprawl and large single-family stock, sits at roughly 3,660 sq ft per person.
📌 Did You Know?
A 2025 Melbourne approval allowed an apartment block with units as small as 24.5 m² (264 sq ft) — smaller than the 30 m² minimum that applies in New York City and the 37 m² minimum that applies in London for new one-bedroom, one-person flats. Australia has no national minimum apartment size, and individual states like Victoria have no statutory floor either, which has made it one of the more permissive markets for compact units in the developed world.
How Have Apartment Sizes Changed Over Time?

The clearest long-term trend in U.S. apartment construction has been a steady reduction in size, followed by a recent reversal. Apartments built between 2015 and 2024 are about 30 sq ft smaller than those built between 2005 and 2014, and 75 sq ft smaller than units from the early 2000s. Studios took the biggest hit at one point, shrinking by 54 sq ft in a decade before regaining 13 sq ft in 2024.
The drivers behind shrinking apartments are well documented. Construction costs rose, urban land prices climbed, and developer attention shifted toward studios and one-bedrooms — which together accounted for 52.7% of new units in 2024, with one-bedrooms alone making up 48% of all new construction. Smaller floor plans let developers fit more units into a building, helping unit economics in expensive land markets. The countertrend is that two- and three-bedroom apartments have actually been growing slightly in some Sunbelt cities, where land is cheaper and demand for larger units is still strong.
The shrinkage trend has had a measurable knock-on effect. Self-storage construction has expanded by 547 million square feet since 2015, bringing the U.S. national total to over 2 billion sq ft, with research showing a tight correlation between apartment size compression and storage demand. Renters who can’t fit their belongings in 600 sq ft are leasing the difference elsewhere.
European trends have moved in similar directions but with more regulatory friction. London introduced its Nationally Described Space Standard in 2015 specifically because office-to-residential conversions under permitted development had been producing units far smaller than was considered acceptable, including some at around 13–14 m². The minimum standard now applies to most new builds and conversions, although co-living and student housing remain exempt and continue to fill the gap for very small units.
What Drives the Difference Between Cities?
Three factors explain most of the variation in apartment sizes between cities: land economics, regulation, and household structure.
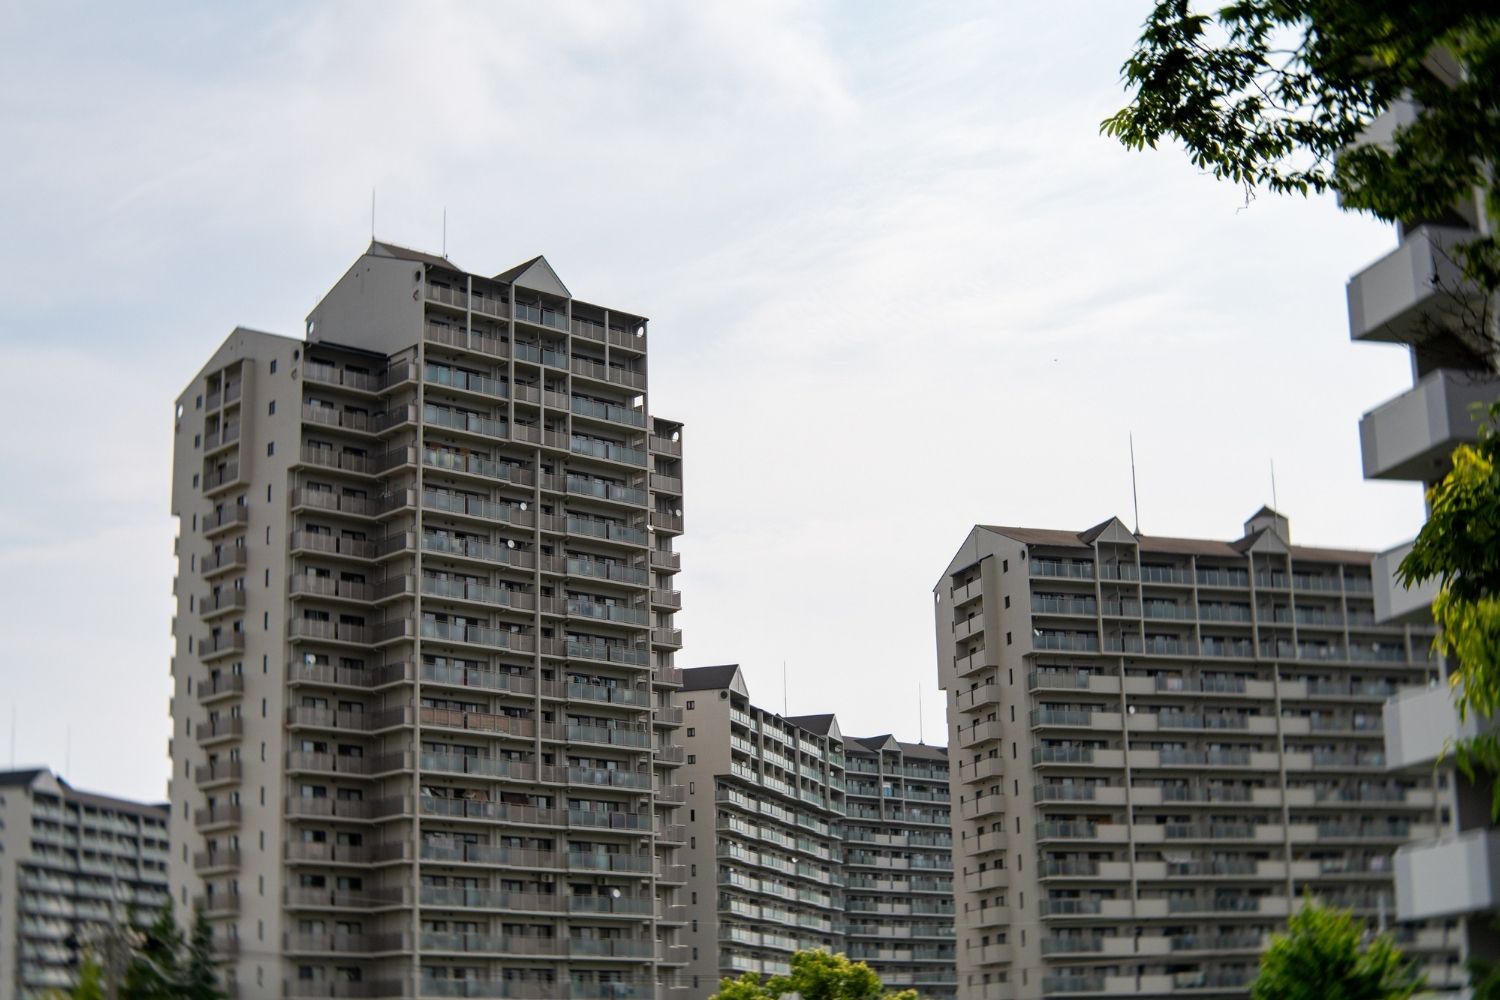
Land economics set the basic incentive. When land is expensive, every square meter of an apartment building has to generate more revenue, so developers respond by either building taller, building denser, or shrinking individual units. Tokyo, Hong Kong, Paris, and Manhattan all have very high land prices and correspondingly small apartment averages.
Regulation shapes how that incentive plays out. Cities with strict minimum size rules — London, New York, Singapore — set a floor below which new builds cannot legally go (though there are usually exceptions for student housing, co-living, or short-term rentals). Cities without minimums, including Tokyo, Melbourne, and most of the U.S., let the market drive size all the way down to whatever developers can sell.
Household structure affects what people actually want. Cities with high shares of single-person households — Stockholm, Berlin, Tokyo — see strong demand for studios and one-bedrooms. Cities where multigenerational households are common see more demand for larger units. Architects and planners working on residential projects increasingly need to factor in flexible apartment design ideas that adapt to changing household sizes over a unit’s lifetime.
🏗️ Real-World Example
The Pinnacle@Duxton (Singapore, 2009): This public housing development by Singapore’s Housing & Development Board stacks 1,848 apartments across seven 50-story towers connected by sky bridges. Unit sizes range from compact one-bedrooms around 60 m² to four-bedroom flats of 105 m², housing thousands of residents on a tight central lot. The project illustrates how regulated minimum standards combined with high-density vertical planning can deliver liveable apartments in one of the world’s tightest land markets.
How Small Is Too Small?
The question of livability at smaller sizes is where architecture, regulation, and individual preference meet. The Japan MLIT guideline of 25 m² as a minimum and 40 m² as the ideal for a single urban resident is one widely cited threshold. London’s 37 m² minimum is more conservative. Paris allows units as small as 9 m², and Tokyo will technically allow even smaller. The arguments for and against very small units depend on what’s available in the building and the neighbourhood — a 25 m² apartment in a building with shared lounges, gym, and outdoor space is a different proposition from a 25 m² unit with no amenity at all.
Coliving and microhome design have responded to this debate with hybrid models that compress private space while expanding shared facilities. Coliving developments typically offer private rooms or studios in the 18–27 m² range with significant shared kitchens, lounges, work areas, and outdoor space, on the principle that the building amenity compensates for the smaller unit. London’s Mayor introduced specific co-living standards setting unit sizes between 18 and 27 m². Architecture competitions like the Compact City Living Microhome Challenge have pushed designers to think about how very small footprints can still deliver good living experiences through clever layouts and shared resources.
For renters and buyers comparing cities, the practical question is usually how much usable space the floor plan offers, not just the headline number. Two 50 m² apartments can feel completely different depending on ceiling height, window placement, storage, and how rooms are configured. Small apartment design strategies like Murphy beds, fold-out desks, sliding partitions, and built-in storage can extend the functional capacity of a unit significantly beyond what its raw square footage suggests.
Outlook for Apartment Sizes in 2026
Several signals point to continued size growth in the U.S. through 2026, particularly for studios and one-bedrooms in major coastal cities. San Francisco, Manhattan, and parts of Brooklyn and Queens have already added square footage to their new builds compared to a decade ago. The Sunbelt continues to deliver larger units, with cities like Tallahassee, Gainesville, Wake Forest, and Knoxville building new apartments above 1,000 sq ft on average.
In Europe, the regulatory floor will likely keep apartment sizes relatively stable in cities like London, Berlin, and Amsterdam, with growth in co-living and student accommodation filling demand for smaller units that fall outside standard residential rules. Tokyo and other Japanese cities are seeing modest size increases at the average level, although the lower end of the market continues to support tiny studios because demand from single workers and students remains strong.
The biggest open question is whether tools like office-to-residential conversion will keep producing very small units in expensive cities or whether tightened standards will gradually push average sizes back up. Office conversions reached record numbers in the U.S. in 2025, with more than 70,700 apartments created from former offices, and the layouts of those buildings often produce unusually small or unusually large units depending on how the original floor plate was carved up.
✅ Key Takeaways
- The average studio apartment size in the U.S. is 457 sq ft (42 m²), with overall new apartments averaging 908 sq ft.
- Tokyo’s average apartment is around 65 m² (700 sq ft), but studios can dip below 20 m² and even 10 m² in extreme cases.
- Paris has one of the smallest median home sizes among global capitals at 560 sq ft (52 m²), reflecting its dense apartment-dominated stock.
- London enforces a minimum apartment size of 37 m² for one-bedroom, one-person flats, while best-practice guidance pushes this to 41 m².
- U.S. apartment sizes have started growing again after a decade of compression, with studios and one-bedrooms gaining the most.
- Land economics, regulation, and household structure are the three biggest drivers of size variation between cities.
Final Thoughts
Apartment size is one of the clearest ways to read a city’s housing market at a glance. A 40 m² studio in Tokyo, a 37 m² minimum-standard flat in London, a 457 sq ft new build in Seattle, and a 1,130 sq ft Tallahassee unit are all responses to local land prices, planning rules, and household demand — and they each shape how their occupants live, work, and move through the city. For architects and developers, the global comparison is a useful reminder that “average” is highly local, and that the same square footage means very different things in different places.
Apartment size figures cited in this guide are drawn from 2023–2025 research by RentCafe, MLIT (Japan), the Greater London Authority, and Buildworld’s 2023 capital city dataset. Local market figures vary year to year and by data source.


Designing Adaptive Homes for People Living With Cerebral Palsy
Table of Contents Show Understanding Cerebral PalsyAdvantages of Adaptive Home Design for...

How Can You Make Your Patio More Comfortable in Every Season?
Table of Contents Show Study the Sun Before Making Major ChangesHow Louvered...

What Should Business Owners Prioritise When Upgrading Their Property?
Table of Contents Show Begin With the Building’s PurposePrioritise Safety Before AppearancePlan...

How Much Does It Cost to Hire an Architect for a House Extension?
A clear look at the cost to hire an architect for a...

Leave a comment