

Understanding Architectural Axonometric Diagrams: A Guide
Axonometric drawing is one of the most essential architectural representation techniques. This complete guide covers what axonometric projection is, the differences between isometric, dimetric and trimetric views, how to draw axonometric diagrams by hand and digitally, exploded axonometric methods, and best practices for architectural presentations.

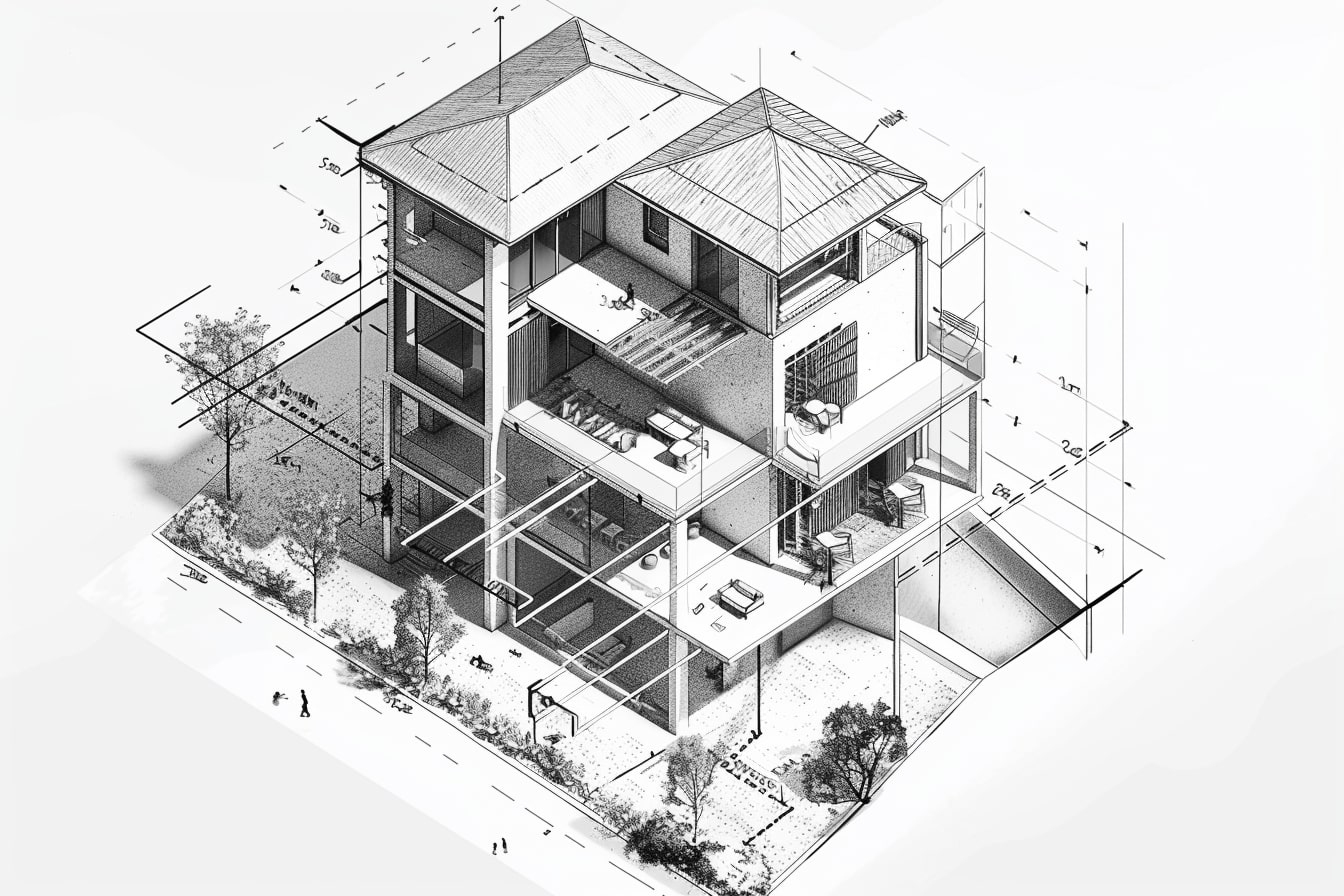
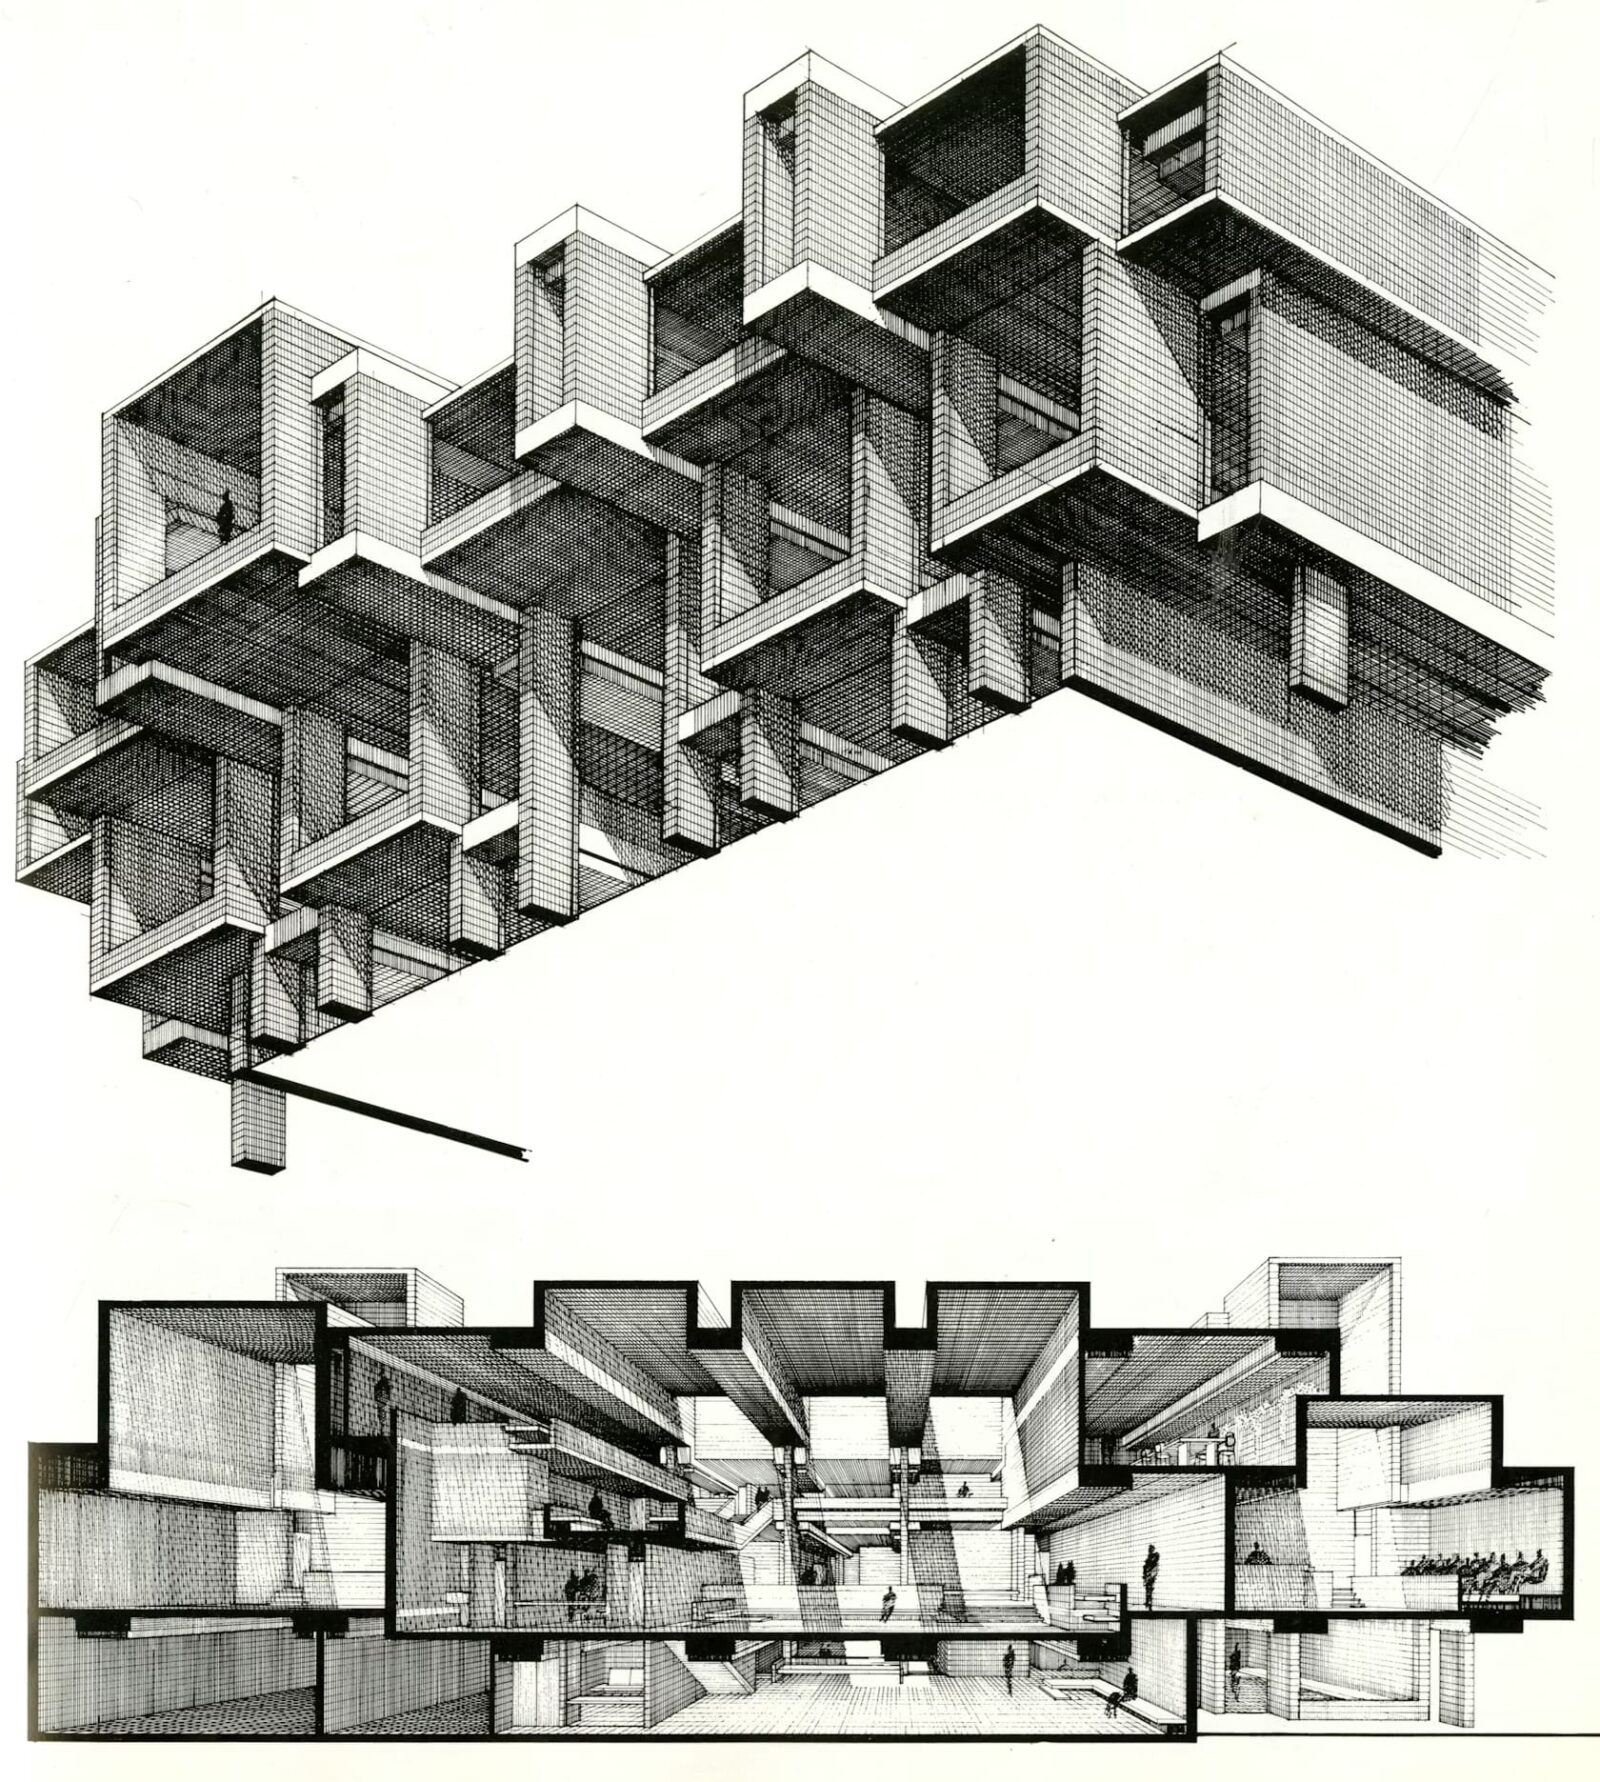


Table of Contents Show
Quick answer: An axonometric drawing is a three dimensional view that shows a building’s length, width, and height in one image, drawn to scale with parallel lines that never converge. Unlike perspective, true angles and measurements are kept, so dimensions can be read straight off the drawing.
Axonometric drawing is a parallel projection technique that architects use to represent three-dimensional buildings on a two-dimensional surface, keeping all three axes to true scale. Unlike perspective drawings, parallel lines stay parallel throughout the image, so measurements can be taken directly from the drawing. This makes axonometric projection one of the most reliable methods for communicating spatial organization, structure, and design intent in architecture.
\nFor the full picture, see our complete guide to architectural diagrams and their types.
Axonometric drawing is one of the most powerful representation techniques in architectural visualization, offering designers a unique way to communicate three-dimensional concepts on a two-dimensional surface. But what is an axonometric view exactly, and why do architects rely on axonometric projection so heavily in 2026? In the realm of architectural design, the axonometric diagram stands out as a key tool, offering a unique axonometric perspective that bridges the gap between two-dimensional plans and the three-dimensional reality of structures. These diagrams, by employing techniques such as dimetric and trimetric projections, allow us to see a building from a vantage point where dimensions and spatial relationships are clarified, despite the complexity of the design. This method not only enhances our understanding of architectural concepts but also simplifies communication among professionals and clients alike. Whether you are an architecture student learning axonometric architecture for the first time or a seasoned professional refining your sketching skills, understanding axonometrics is fundamental to effective design communication. For those searching “axometric,” “axnometric,” “axionometric,” or “axonmetric” — these are common misspellings of axonometric, derived from the Greek roots for axis (axon) and measure (metron).
We cover the details of axonometric diagrams, exploring how they’re crafted to represent objects and spaces accurately. Unlike traditional perspectives that mimic human vision, axonometric diagrams maintain scale and proportion across all axes, providing a more technical and precise visualization of architectural designs. Whether it’s through the balanced angles of dimetric projections or the varied scales of trimetric views, these diagrams serve as essential tools in the architect’s arsenal, ensuring that every angle and dimension of a proposed structure is thoroughly examined and understood. This practical breakdown — updated for 2026 — covers everything from the axonometric view definition to actionable tips on how to draw axonometric drawing architecture projects with confidence, including step-by-step methods for creating axon drawing architecture representations and setting up an axonometric view in Rhino.
What Is Axonometric Drawing? Definition and Meaning
To define axonometric drawing, we must understand it as a type of parallel projection used to create pictorial representations of three-dimensional objects. The axonometric definition encompasses any drawing where an object is rotated around one or more axes to reveal multiple sides simultaneously. The axonometric meaning comes from the Greek words meaning “to measure along axes,” which perfectly describes how these drawings maintain measurable proportions along each axis. In shorthand, architects often call it simply an “axon drawing” or “axon diagram architecture” representation. Understanding different diagram types helps architects choose the most appropriate representation method for their specific needs.
What is axonometric drawing in practical terms? It’s a technical illustration method where parallel lines remain parallel throughout the drawing, unlike perspective drawings where lines converge at vanishing points. This axonometric drawing definition makes it invaluable for architectural documentation, as measurements can be taken directly from the drawing with reliable accuracy. The importance of architectural diagrams like axonometrics cannot be overstated in professional practice. When someone searches for “what is axonometric projection,” the simplest answer is that it is a method of parallel projection in which the three principal axes of the object are shown in one drawing, each scaled proportionally — making axonometric architecture drawing one of the most reliable techniques for conveying spatial information. The term axonometry refers to the broader mathematical and geometric discipline behind these projection methods, while axonometrics is the plural form commonly used to describe the collection of drawings produced using these techniques.

⚠️ Common Mistake to Avoid
Many students confuse isometric and axonometric drawing, assuming they are different techniques. Isometric is actually a specific subset of axonometric projection — all isometric drawings are axonometric, but not all axonometric drawings are isometric. Using these terms interchangeably in professional communication can cause confusion. When in doubt, specify the exact projection type: isometric (equal angles), dimetric (two equal axes), or trimetric (all axes different).
Axonometric View Definition: What Is an Axonometric View?
So what is an axonometric view? The axonometric view definition refers to a specific way of looking at a three-dimensional object where the viewer is positioned at infinity, meaning all projection lines are parallel rather than converging. This is what distinguishes an axonometric view from a perspective sketch. In an axonometric view architecture context, this means that a building can be represented showing its true proportions along all three axes — width, depth, and height — without the foreshortening distortion typical of photographic or perspective views. The result is a drawing that feels both spatial and diagrammatic, which is why axonometric projection remains central to architectural communication. For those who often type “axometric” or “axnometric” into search engines, note that the correct spelling is axonometric, derived from the Greek roots for axis and measure. In professional practice, you may also hear it shortened to “axon view architecture” or simply “axon” — all referring to this same parallel projection technique.
Understanding Axonometric Diagrams in Architecture
The Basics of Axonometric Projection
Axonometric projection serves as a cornerstone in architectural visualization, transforming how we perceive and articulate space. Unlike perspective drawings that mimic human vision by converging lines at a vanishing point, axonometric diagrams retain parallel lines and scale, offering an undistorted representation of the subject. This technique allows viewers to understand complex structures from a vantage point that provides clarity and precision. Axonometric projection encompasses a process where a three-dimensional object is depicted on a two-dimensional plane, ensuring that each axis remains scale-true. The result is a drawing that accurately communicates spatial dimensions and relationships, making it an invaluable tool for architects and designers. It bridges the conceptual gap between flat architectural plans and the three-dimensional reality they represent, thereby facilitating a clear understanding of designed spaces. This is the core of the axonometric projection definition: a parallel projection method where the object’s principal axes are inclined to the projection plane so that all three are visible in a single image.
Types of Axonometric Diagrams: Axonometric vs Isometric and Dimetric Projection
Within the broad category of axonometric diagrams, three primary types stand out: isometric, dimetric, and trimetric projections. Each offers a distinct way of representing three-dimensional objects on two-dimensional surfaces. Understanding the difference between isometric and axonometric drawing — or more precisely, understanding that isometric is a subset of axonometric — is essential for choosing the right technique for your project.
- Isometric Projections: In an isometric diagram, all three axes of the object are angled equally with the plane of projection, typically at 30 degrees, creating 120° angles between axes. This equality results in a uniform foreshortening of scales, providing a balanced view of the object that is particularly effective for conveying structural and spatial relationships in architectural designs. When comparing axon vs isometric, remember that isometric is actually a specific type of axonometric projection where all three foreshortening ratios are equal. Isometric architectural drawing (sometimes searched as “architectural isometric drawing”) is the most common form of axonometric view used in architecture today, thanks to the equal emphasis it places on all three dimensions.
- Dimetric Projections: Dimetric diagrams take a slight deviation by displaying two of the three axes with the same degree of foreshortening while the third axis is represented differently. A dimetric projection enhances the depiction of depth, making it easier to illustrate and understand more complex volumes and shapes in architectural elements. The question of what axonometric angle to use is most relevant here, as dimetric perspective projections use specific angle combinations such as 7°/42° or 15°/35° to achieve distinct visual effects. Dimetric projections are favored in axonometric detail drawings where one face of the building needs more visual emphasis than the others.
- Trimetric Projections: Offering the most detailed view, trimetric diagrams depict all three axes with different degrees of foreshortening. Although this method can present a more detailed visualization of architectural designs, it is less commonly used due to its complexity in construction and interpretation. Trimetric projections excel in showing specific spatial dynamics and fine details that other diagrams might not capture as effectively.
Understanding these types of axonometric diagrams helps you choose the most appropriate method for presenting architectural ideas. Each type brings its own advantages to the table, allowing architects and designers to convey depth, scale, and spatial relationships accurately. Through careful selection and application of these diagrams, you can enhance the clarity of architectural communications, ensuring that every dimension and detail of the design is understood accurately by clients, contractors, and team members alike.
Exploded Axonometric Drawing: Revealing Hidden Layers
The exploded axonometric drawing represents one of the most powerful variations of axonometric views in architectural representation. An exploded axonometric separates the components of a building or structure along specific axes, revealing how different elements interact and assemble together. This technique — sometimes called an exploded axon diagram — is particularly valuable for showing construction details, structural systems, and the relationship between interior and exterior elements that would otherwise remain hidden in standard architectural diagrams. The exploded axonometric architecture approach has become a signature representation in many award-winning programmatic diagrams and competition entries, and it is closely related to the concept of space as solid architecture diagram 3D axon representations, where volumes are treated as positive solids to reveal spatial hierarchy.
Creating an effective exploded axonometric drawing requires careful consideration of which elements to separate and how far to space them apart. The spacing must be sufficient to reveal the connections and relationships between components while maintaining visual coherence. Architects often use this technique to demonstrate floor-by-floor organization, structural framing systems, facade assemblies, and MEP (mechanical, electrical, plumbing) systems. The exploded view transforms complex assemblies into understandable visual narratives that communicate both technical information and design intent.
🏗️ Real-World Example
OMA’s CCTV Headquarters (Beijing, 2012): Rem Koolhaas and the OMA team used exploded axonometric diagrams extensively during the design development of this project to communicate the building’s looping structural logic to engineers and clients. The axonometrics separated the structural diagrid, floor plates, and programmatic zones along the vertical axis, making the unconventional structural system legible to a non-specialist audience. This approach has since become a standard presentation strategy for projects with complex structural or spatial narratives.
The Role of Axonometric Diagrams in Architectural Design
Axonometric diagrams, including isometric, dimetric, and trimetric axonometric projections, play a central role in the world of architectural design. By bringing together two-dimensional plans and three-dimensional structures, these diagrams serve as a bridge that enhances understanding, communication, and collaboration in architectural projects. Below, we look at how axonometric diagrams contribute to visualizing complex structures, communicating design intent, and facilitating multidisciplinary collaboration.
Visualizing Complex Structures
Axonometric diagrams provide architects and designers with a powerful tool for visualizing complex structures. Unlike traditional two-dimensional floor plans or elevations, axonometric projections maintain scale and proportion across all axes, allowing for a more accurate representation of spatial dimensions and relationships. This accuracy is critical when dealing with complex designs, as it ensures that all stakeholders can correctly perceive the scope and details of the project. Whether it’s an isometric projection that simplifies the perception by giving equal emphasis to all three dimensions or a trimetric projection that offers a more nuanced view by varying the scale and angles, axonometric diagrams enable a clear and precise visualization of architectural concepts.
Communicating Design Intent
One of the primary benefits of axonometric diagrams is their ability to communicate design intent effectively. By presenting a detailed and proportionally accurate depiction of a design, these diagrams allow architects to convey their ideas clearly and unambiguously. This clarity is essential not only for clients, who may not have a technical background, but also for all team members involved in the project. Axonometric projections make it easier to understand the spatial relationships between different elements of a design, helping stakeholders to appreciate the aesthetic and functional aspects of a project fully. Moreover, these diagrams can help identify potential design issues early in the process, enabling timely adjustments that can save time and resources.
Facilitating Multidisciplinary Collaboration
In today’s architectural practice, projects often require the collaboration of professionals from various disciplines, including architects, engineers, and construction managers. Axonometric diagrams facilitate this multidisciplinary collaboration by providing a common visual language that all parties can understand and use to discuss the project. The precision and clarity of axonometric projections enable team members to analyze design proposals accurately, coordinate their efforts, and make informed decisions. This collaborative approach, supported by effective visual communication tools, leads to more efficient project workflows, reduced errors, and a higher quality of the final structure.
The role of axonometric diagrams in design extends far beyond mere representation. These diagrams are indispensable tools that aid in visualizing complex structures, communicating design intent, and facilitating multidisciplinary collaboration. By applying the unique characteristics of isometric, dimetric, and trimetric projections, architects and designers can ensure their visions are understood, appreciated, and brought to life with precision and efficacy.
Axonometric Drawing Angles: Understanding the Geometry
One of the most critical aspects of creating accurate axonometric drawings is selecting the correct axonometric drawing angles. The angle you choose directly affects the visual emphasis and spatial clarity of the final image. In an isometric projection, both receding axes are drawn at exactly 30° from the horizontal, creating a symmetrical view. For plan oblique projections — the most popular form of axonometric drawing architecture — the plan is typically rotated at 45°/45° or 30°/60° before heights are projected vertically. The 45°/45° rotation gives equal weight to both sides of the building, while the 30°/60° rotation emphasizes one facade over the other. When working with an axonometric grid, these angles are pre-established, making it easier to plot points and maintain consistency throughout the drawing. Many architects set up custom axonometric grids in software such as Adobe Illustrator or Rhino to streamline repetitive drafting tasks. Understanding axonometric view angle selection is what separates a mediocre drawing from a compelling one.
📐 Technical Note
Standard axonometric angle references used in professional architectural drawings: Isometric: 30°/30° (all axes equal, 120° between each). Plan oblique (military): 45°/45°, scale factor 1:1 on all axes. Plan oblique (cabinet): 30°/60°, one facade emphasized. Dimetric: 7°/42° or 15°/35°, foreshortening factor applied to one axis. Trimetric: all three axes at different angles, no standard values. When setting up drawings in Revit or Rhino, these values should be input precisely to ensure drawings are reproducible across the project team.
Axonometric Drawings in Sci-Fi and Conceptual Architecture
The aesthetic qualities of axonometric drawings in sci-fi style representations have made them particularly popular in conceptual and speculative architecture. The flat, graphic nature of axonometric projection lends itself well to futuristic visualizations, where the lack of perspective distortion creates an otherworldly, almost impossible quality. This characteristic has been embraced by architects and artists creating visionary proposals, utopian schemes, and science fiction environments.
From the constructivist works of the early 20th century to contemporary digital explorations, axonometric diagrams have served as vehicles for architectural imagination. The technique allows designers to present complex spatial relationships and impossible geometries that would be difficult to communicate through conventional perspective drawings. This makes axonometric drawings particularly effective for storytelling in architecture and creating compelling visual narratives. Architects like Zaha Hadid and the members of OMA have used axonometric sketch techniques extensively in their early conceptual work, demonstrating how the axonometric perspective can blur the line between technical drawing and art.
The Artistic Side of Axonometric Diagrams
In architecture, axonometric diagrams go beyond functional layouts and technical details. They embody an artistic side that enhances the visualization of projects. Through the following sections, we look at how these diagrams impact the aesthetic appeal of architectural representations and play a key role in presentations.
Enhancing Aesthetic Appeal
Axonometric diagrams possess the unique ability to transform standard architectural drawings into visually appealing representations. By employing various artistic techniques such as shading, coloring, and texturing, these diagrams bring a vibrant life to designs. This not only aids architects and designers in conveying complex spatial relationships in a more digestible format but also captures the viewer’s attention through striking visuals.
For instance, using different opacities and colors to highlight materials and layers creates depth in the presentation, portraying the envisioned environment in a more tangible and engaging manner. A soft pencil grey with an opacity of 94% can provide a delicate shading effect, subtly distinguishing different elements without overwhelming the viewer. Similarly, incorporating filled strokes with varying opacities and colors, like a light blue at 33% opacity, can simulate realistic shadows, adding a layer of depth and realism to the diagrams.

Axonometrics in Architectural Presentations
In architectural presentations, axonometric diagrams serve as a powerful tool to convey the essence of a design. They bridge the gap between purely technical drawings and the final built environment, offering a glimpse into the future of the project. By integrating people, landscape objects, and even theoretical yet impossible geometries, architects can invoke a sense of scale, space, and dynamics in their designs.
This inclusion of human figures and natural elements, easily sourced from object libraries or created using tools like the “Filled Stroke” for drop shadows, introduces a narrative to the axonometric view. It allows the audience to imagine the interaction between the space and its potential users. Furthermore, the strategic use of transparency in PNG objects embeds a layer of sophistication into these presentations, making them readily accessible and understandable to clients and stakeholders without an architectural background.
Moreover, the artistic rendering of axonometric diagrams sparks curiosity and invites viewers to explore the details of the design. Whether through the exploration of optical illusions like those found in op art, or the careful crafting of impossible objects that challenge perceptions, these diagrams exceed their functional purpose. They become a canvas where the laws of physics and conventional viewpoints are reimagined, engaging viewers in a dialogue that extends beyond the physical blueprint into the realm of artistic expression.
The artistic side of axonometric diagrams plays a crucial role in enhancing the aesthetic appeal and effectiveness of architectural presentations. Through creative techniques and thoughtful integration of artistic elements, these diagrams transcend their traditional boundaries, offering not just a detailed view of the proposed architecture but also an engaging visual experience.

How to Draw Axonometric Drawing Architecture: Step-by-Step Guide
Learning how to draw an axonometric drawing is an essential skill for architecture students and professionals. Whether you’re working by hand or using digital tools, understanding the fundamental principles will help you create accurate and compelling architectural diagrams. Here’s a focused guide on how to draw axonometric drawing architecture projects effectively. If you’re wondering how to make quick architectural axonometric drawings, the process can be streamlined significantly once you master the basic principles below. This section also addresses the common query “how to axonometric drawing” and “how to draw axonometric view” for those seeking quick answers.
How to Draw Axonometric: Manual Method
For those wondering how to draw axonometric drawings by hand, the process begins with your floor plan. Start by rotating your plan 45 degrees (for oblique projection) or positioning it at 30-60 degrees for other variations. From each corner of the plan, draw vertical lines upward to the appropriate height, maintaining consistent scale throughout. Connect the tops of these vertical lines to complete the three-dimensional form. The key to successful axonometric architecture drawing lies in maintaining parallel lines and consistent measurements along each axis. Combining this skill with a strong foundation in architectural sketching will significantly improve the quality of your work.

💡 Pro Tip
When drawing axonometrics by hand, tape a printed floor plan directly to your drawing board and rotate it to the desired projection angle before tracing. This avoids measurement errors that occur when trying to draw the rotated plan freehand. Use a 30-60-90 triangle to project all vertical heights consistently. Keep a spare triangle dedicated to your axonometric angle so you don’t have to reset each time.
How to Make Quick Architectural Axonometric Drawings
One of the most common questions architects face is how to make quick architectural axonometric drawings for presentations, pin-ups, and design reviews. Speed is essential in studio environments and professional practice, so here are proven methods to produce axonometric drawings efficiently. First, use your existing 3D model as the foundation — most BIM and modeling software can export an axonometric view directly. In Rhino, set a parallel projection and rotate to 45-45 or 30-60 degrees, then use the Make2D command to generate clean line work. In SketchUp, switch to parallel projection under the Camera menu and rotate to your desired angle. For hand-drawn axonometric sketches, keep a 30-60-90 triangle nearby and work directly from a printed plan — trace your plan at the correct rotation angle, then project heights vertically. The key is to focus on the essential building volumes first and add detail layers progressively.
Axonometric Section: Combining Section Cuts with Axonometric Views
An axonometric section is a hybrid drawing type that combines the clarity of a section cut with the spatial depth of an axonometric projection. By slicing through a building along a chosen plane and then projecting the remaining form in axonometric view, architects can reveal interior conditions, wall assemblies, structural connections, and spatial sequences that neither a flat section nor a standard axon could show alone. This technique is particularly effective in sectional diagrams for competition boards and design reviews, where conveying both interior depth and overall massing simultaneously is critical. To create an axonometric section, start with a 3D model, apply a section plane, and then set the camera to parallel projection at the desired axonometric angle. For a broader look at how sections work across different drawing types, see our guide to architectural section drawings. Tools like Rhino, Revit, and ArchiCAD all support this workflow natively.
Axonometric Drawing in Landscape Architecture
Axonometric drawing landscape architecture applications have grown significantly in recent years. Landscape architects use axonometric projections to represent terrain, planting schemes, water features, and hardscape elements in a way that clearly communicates spatial relationships across large areas. The bird’s-eye quality of an axonometric view is particularly well suited for master plans, park designs, and urban landscape interventions where showing the relationship between topography and built elements is essential. By combining landscape layers — grading, vegetation, paving, structures — in an exploded axonometric format, landscape architects can present phasing strategies and ecological systems with remarkable clarity. For a broader overview of how drawing techniques apply across the discipline, see our landscape architecture guide. The American Society of Landscape Architects (ASLA) also publishes resources on visualization standards for landscape practice. This crossover between architecture and landscape design demonstrates the versatility of architectural diagramming techniques.
Creating Axonometric Diagrams
Creating axonometric diagrams is a process that can significantly elevate architectural design, offering a bridge between the simplicity of 2D blueprints and the compelling depth of 3D models. These diagrams not only enhance the presentation of architectural ideas but also provide a clear understanding of spatial relationships and building structures. In this section, we explore the tools and software best suited for creating axonometric diagrams and provide actionable tips to ensure your diagrams are both effective and aesthetically appealing.
Tools and Software for Axonometric Drawings: Axonometric Rhino Workflow
When it comes to generating axonometric diagrams, the choice of tools and software plays a key role in achieving desired outcomes. The evolution of architectural visualization has made digital tools the preferred option for this task, given their efficiency and versatility.
Firstly, 3D modeling software like Rhino has become indispensable in our toolkit. Rhino particularly stands out for its Make2D command, which effortlessly translates complex 3D models into accurate 2D axonometric projections. Setting up an axonometric view in Rhino is straightforward: switch to a parallel projection viewport, rotate to 45-45 or 30-60 degrees, and then run Make2D to generate clean vector line work. This axonometric Rhino workflow is one of the most efficient methods for creating publication-quality axonometric projection drawings. For those searching “how to make an axon in Rhino” or “how to make axon in Rhino” or “axonometric view Rhino,” the process involves: (1) setting up a named view with parallel projection, (2) rotating the camera to the desired axonometric angle, (3) using Make2D to flatten the 3D geometry, and (4) exporting to Illustrator or Photoshop for post-production. For a broader look at the tools architects use alongside Rhino, see our overview of diagram tools for architects.
Furthermore, image editing software enhances these basic line drawings by adding layers of textures, shadows, and colors, thus bringing the axonometric drawings to life. Photoshop, with its extensive toolkit for image manipulation, stands as a powerful ally in refining axonometric diagrams.
Lastly, the digital age brings with it an abundance of online resources and communities. Platforms like YouTube serve as a treasure trove of tutorials and guides, catering to a wide range of skill levels and creative aspirations. These resources are instrumental in not only learning the basics but also exploring advanced techniques to take axonometric diagrams to the next level. For comprehensive detail drawing workflows, many architects combine Rhino or Revit output with vector editing in Adobe Illustrator.

Tips for Creating Effective Axonometric Diagrams
Creating effective axonometric diagrams extends beyond mere technical execution. It involves a deliberate approach to composition, detail, and storytelling. Here are several tips that prove invaluable across architectural projects:
- Prioritize Clarity and Purpose: Before starting the drawing, define the diagram’s purpose. Whether it’s to highlight spatial relationships, show a building’s form, or present a design concept, the intent will guide your choice of projection, detail level, and elements to include.
- Select the Right Projection: When deciding between isometric vs axonometric drawing approaches, consider the spatial qualities you wish to emphasize. Isometric, dimetric, and trimetric projections each offer a unique view of the structure, varying in the angles and distortions they present.
- Incorporate Textures and Shadows: Use textures and shadows judiciously to add depth and realism to your diagrams. These elements, when used effectively, can greatly enhance the three-dimensionality and legibility of the axonometric view.
- Consider Your Audience: Tailor the complexity and style of your axonometric drawings to your intended audience. Simplified diagrams work well for client presentations, while more detailed technical axonometric detail drawings suit construction documentation.
💡 Pro Tip
Before finalizing any axonometric drawing for a presentation board, print it at the intended display size and view it from a standing distance of 1 to 2 meters. Line weights and text labels that look fine on screen often become unreadable at print scale. Experienced architects typically use a minimum line weight of 0.25 mm for secondary lines and 0.5 mm for primary outlines at A1 size.
Axonometric vs Perspective: What Is the Difference?
Understanding what is axonometric projection in relation to perspective drawing is one of the most important distinctions in architectural representation. Both methods translate three-dimensional space onto a two-dimensional surface, but they do so in fundamentally different ways. In axonometric projection, all projection lines are parallel to each other and perpendicular to the picture plane, which means objects do not appear smaller as they recede into the distance. In contrast, perspective projection mimics how the human eye perceives space — lines converge toward one or more vanishing points, and distant objects appear smaller. This is why axonometric drawings look “flatter” and more diagrammatic, while perspectives feel more photorealistic.
| Aspect | Axonometric Drawing | Perspective Drawing |
|---|---|---|
| Projection lines | Parallel (no vanishing points) | Converge at vanishing points |
| Scale accuracy | Measurable along all axes | Distorted by foreshortening |
| Best use | Technical docs, diagrams, competition boards | Experiential renderings, client visuals |
| Construction complexity | Easier to construct and modify | More complex setup required |
| Appearance | Flat, graphic, diagrammatic | Photorealistic, spatially immersive |
| Common types | Isometric, dimetric, plan oblique | 1-point, 2-point, 3-point perspective |
The choice between axonometric and perspective depends on your communication goals. Use an axonometric view when you need measurable accuracy, equal emphasis across all parts of the design, and a clear representation of spatial organization. Choose perspective when you want to show how a space will feel to someone standing inside or outside it. Many architects use both representations within the same project: axonometrics for functional and programmatic diagrams, and perspectives for experiential renderings. Understanding this distinction is essential for anyone studying what is axonometric drawing and how it fits within the broader landscape of architectural representation.
Is Axonometric Architectural Drawing at a Certain Angle?
A frequently asked question is whether an axonometric architectural drawing must be at a certain angle. The answer depends on the type of axonometric projection you are using. In an isometric projection, the angle is fixed: all three axes are tilted at exactly 30 degrees from horizontal, creating equal 120-degree intervals. However, the broader family of axonometric drawing in architecture is not restricted to a single angle. Dimetric projections commonly use angle pairs like 7°/42° or 15°/35°, while trimetric projections allow all three axes to have different angles. The most widely used axonometric drawing architecture convention is the 45-45 degree plan oblique (also called a military projection), where the plan is drawn true to scale and heights are projected vertically. Another popular variation is the 30-60 degree plan oblique, which places greater visual emphasis on one side of the building. Understanding planimetric diagrams alongside axonometric views gives you a more complete toolkit for architectural representation.
Axonometric Diagrams: From Practical to Conceptual
Axonometric diagrams have transitioned remarkably from practical design tools to conceptual frameworks in architectural design. These diagrams are not just representations but key tools that articulate the spatial dynamics of structures, enhance understanding, and facilitate communication within the design and construction industries. As we expand on this topic, we explore how iconic axonometric diagrams have shaped architectural presentation and where axonometric representation is heading next.
Case Studies: Iconic Axonometric Diagrams in Architecture
Examining iconic axonometric diagrams provides invaluable insights into their practical and conceptual significance in architecture. For instance, the works of architects like Le Corbusier and I.M. Pei stand out for their use of axonometric diagrams to convey complex architectural ideas in a digestible format. Le Corbusier’s Villa Savoye diagram breaks down the five points of his new architectural aesthetic, offering a clear, three-dimensional understanding of his design principles without the need for physical presence. Similarly, I.M. Pei‘s axonometric diagrams for the Louvre Pyramid carefully illustrate the integration of contemporary design within a historical context, showing the power of these diagrams in bridging time and style.
These case studies show how axonometric diagrams serve as comprehensive tools for architects, enabling the visualization of conceptual throughlines in designs and facilitating the externalization of spatial relationships. The precision and clarity inherent in axonometric projections allow both architects and viewers to grasp the essence of designs, making them indispensable in the architectural process.

Future Trends in Axonometric Representation
The future of axonometric representation in architecture looks promising, integrating advancements in technology with evolving design philosophies. With the advent of software like Rhino, architects now have powerful tools that automate and refine the creation of axonometric diagrams, enhancing both their accuracy and aesthetic appeal. Furthermore, virtual reality (VR) and augmented reality (AR) technologies are set to extend the capabilities of traditional axonometric diagrams by offering immersive experiences that enable users to explore architectural spaces in three dimensions before they are constructed.
Moreover, we’re witnessing a conceptual shift as more architects treat axonometric diagrams not only as tools for representation but as part of the narrative process of design. This trend speaks to the growing recognition of narrative and storytelling in architecture, where axonometric diagrams contribute to the storytelling aspect of projects, providing deeper insights into the conceptual underpinnings of designs.
Axonometric diagrams have evolved significantly, from practical drafting tools to complex representations that offer both conceptual insight and a narrative framework in architectural design. As technology continues to advance, we anticipate even more innovative uses of axonometric diagrams, further cementing their value and utility in the architectural domain. The integration of AI-powered tools is also beginning to influence how architects generate and refine their diagrammatic storytelling techniques.

Axonometric Drawing Architecture: Best Practices
Mastering axonometric drawing architecture requires understanding both the technical fundamentals and the artistic considerations that make these drawings effective communication tools. Whether you’re creating an architectural axonometric drawing for a competition entry, client presentation, or construction documentation, following established best practices will ensure professional results.
When developing your diagramming skills, consider the viewing angle carefully. A 45-45 degree oblique projection preserves plan accuracy and is easy to construct, while 30-60 degree angles offer more dynamic views. The choice should align with what aspects of the design you want to emphasize. For sectional diagrams, combining axonometric projection with section cuts can reveal interior conditions effectively.

✅ Key Takeaways
- Axonometric drawing is a parallel projection method where all three axes remain to scale, making measurements directly readable from the drawing.
- Isometric, dimetric, and trimetric are the three main types — isometric is a specific subset of axonometric, not a separate technique.
- The most common angle for plan oblique axonometrics is 45°/45° (equal facades) or 30°/60° (one facade emphasized).
- Exploded axonometric drawings separate building components along an axis to reveal structure, systems, and assembly logic.
- In Rhino, the Make2D command with a parallel projection viewport is the most efficient workflow for generating publication-quality axonometric line work.
- Use axonometrics for technical documentation and diagrams; use perspectives when you need to communicate how a space will feel experientially.
What Is an Exploded Axonometric Diagram?
An exploded axonometric, sometimes called an exploded isometric, takes a standard axonometric view and pulls the building’s parts apart along an axis, usually vertically, so each layer floats separately above the next. Floors, roof, structure, facade and services appear as distinct pieces, which reveals how the building is assembled and how its systems stack. Because the projection stays parallel, every part keeps its true scale and the separated layers still line up cleanly.
When Should You Use an Exploded Axonometric?
An exploded axonometric works best when you need to explain construction, layering or systems that a single solid view would hide. Architects use it to show structural assembly, how floors and program stack across levels, or how mechanical and facade layers fit together. It is a favourite for competition boards and technical presentations, where one clear image can replace several plans and sections.
How Do You Draw an Exploded Axonometric?
Start with a standard axonometric of the whole building, then separate it into logical layers such as foundation, floors, structure, envelope and roof. Move each layer along a single shared axis, keeping the spacing consistent, and add thin guide lines to show how the pieces align. Label each layer so the assembly reads clearly, and keep the order the same as the real construction sequence.
Frequently Asked Questions About Axonometric Drawing
What is the difference between axonometric and isometric drawing?
The key difference between isometric and axonometric drawing is that isometric is actually a specific type of axonometric projection. In isometric drawing, all three axes are equally foreshortened at 30 degrees from horizontal, creating 120-degree angles between them. Axonometric is the broader category that includes isometric, dimetric (two axes equal), and trimetric (all axes different) projections. When comparing axon vs isometric, think of it this way: every isometric drawing is axonometric, but not every axonometric drawing is isometric. Understanding this distinction helps architects choose the most appropriate technique for their specific visualization needs.
How do you create an exploded axonometric drawing?
To create an exploded axonometric drawing, start by building a complete 3D model with all components properly grouped. Then, separate elements along the vertical axis (or other axes as needed) while maintaining their relative positions. The key is consistent spacing that reveals relationships without losing visual coherence. Software like SketchUp, Rhino, or Revit can facilitate this process by allowing you to move grouped elements while maintaining the axonometric view settings. This exploded axon diagram technique is widely used in competition boards and architectural presentations.

What software is best for axonometric drawings in architecture?
Popular software for creating axonometric drawings includes Rhino (with its Make2D command for axonometric Rhino workflows), SketchUp, AutoCAD, Revit, and ArchiCAD for 3D modeling, combined with Adobe Illustrator or Photoshop for post-processing. The choice depends on your workflow preferences, the complexity of the project, and the desired output style. Many architects use a combination of tools, modeling in 3D software and refining in vector or raster editors. For setting up an axonometric view in Rhino, use a parallel projection viewport, rotate to your desired angle, and run Make2D.
Why use axonometric instead of perspective drawings?
Axonometric drawings offer several advantages over perspective drawings: they maintain measurable proportions along each axis, making them useful for technical documentation; they show multiple sides of a building equally without depth distortion; they’re easier to construct and modify; and they can reveal spatial relationships that perspective might obscure. However, perspective drawings better represent how humans actually perceive space, making them preferable for realistic visualizations.
How to draw axonometric by hand?
To draw axonometric by hand, begin by positioning your floor plan at the desired angle (typically 45 or 30-60 degrees). Use a set square or triangle to maintain consistent angles. Draw vertical lines from each plan point to the appropriate height using your scale ruler. Connect the tops of verticals to complete the form. Add line weights to distinguish between different elements and enhance readability. Practice with simple geometric forms before attempting complex architectural subjects. A common axonometric drawing example to start with is a simple rectangular room with a single window and door opening.
What is an axonometric drawing in architecture?
An axonometric drawing in architecture — sometimes called an axon drawing architecture representation or simply an “axon” — is a type of parallel projection that represents a three-dimensional building or space on a two-dimensional surface while preserving measurable scale along all three axes. Unlike perspective drawings, axonometric views do not use vanishing points, so parallel lines remain parallel in the final image. This makes axonometric drawing architecture an invaluable tool for communicating spatial organization, structural systems, and design intent with technical accuracy. Common types used in architecture include isometric (equal angles), plan oblique (45° or 30-60° rotated plan), and exploded axonometric (separated layers). For a deeper understanding of how axonometric diagrams relate to other drawing types, explore our overview of diagram types in architecture.
What is the best axonometric view angle for architecture?
The best axonometric view angle depends on your design goals. The 45°/45° plan oblique is the most commonly used because it preserves the plan geometry accurately and gives equal visual weight to both primary facades. The 30°/60° plan oblique is ideal when you want to emphasize one side of the building over the other. For isometric views, all axes are at 30° from horizontal. Dimetric angles like 15°/35° or 7°/42° create more dynamic compositions but require foreshortening calculations. Experiment with different axonometric drawing angles to find the one that best communicates your design intent.
Last updated:


2 Comments


Bubble Diagram for Residential Projects: From Brief to Layout
A step-by-step look at how a bubble diagram organizes a residential brief...

Spatial Organization Diagrams in Architecture: Types, Examples, and How to Choose
This guide breaks down the five core types of spatial organization diagrams...

Bubble Diagram School Design: A Step by Step Guide for Educational Buildings
A practical look at bubble diagram school design for educational buildings. It...

Understanding Architectural Functional Relationship Diagrams: A Practical Guide
Functional relationship diagrams are essential planning tools that architects use during the...

This article explains axonometric drawings and their importance in architecture. It’s interesting to learn how they help in visualizing structures better.
This article explains axonometric drawing well. I learned that it helps in showing buildings from different angles without distortion. It’s interesting to see how this technique can make complex designs clearer.