

Free Online Zoning Diagram Maker for Architecture
Everything this zoning diagram maker does, free, no account, nothing to install
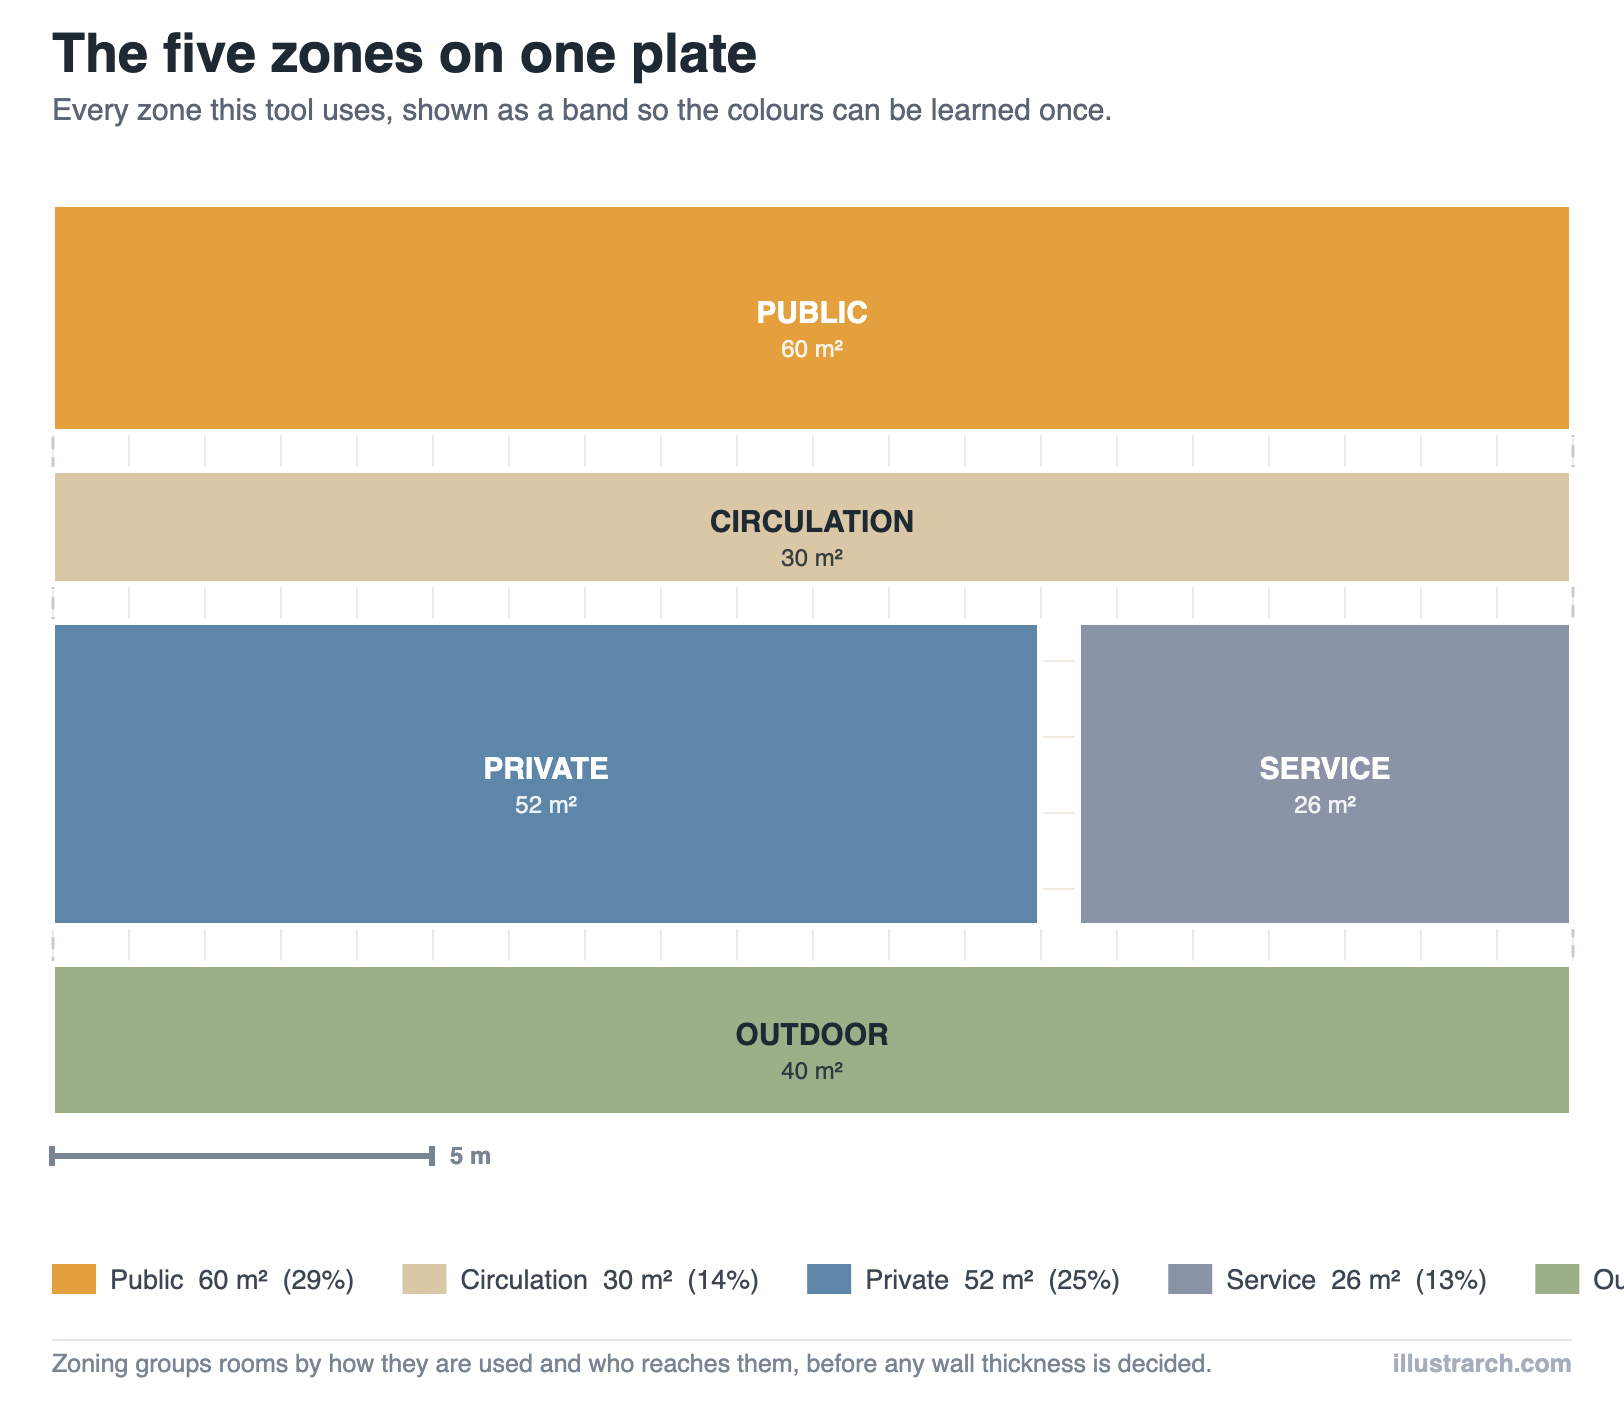
- Five fixed zones, public, private, service, circulation and outdoor, instead of a palette of colours you have to explain in a key.
- Rooms drawn to scale as rectangles on a plate measured in metres, with a one metre grid and a scale bar, so the diagram reads as a plan and not as a mood board.
- A live area tally: every room in square metres, every zone in square metres and as a share of the total.
- Drag and snap at 0.1, 0.25, 0.5 or 1 metre. Drag the bottom-right corner of a room to resize it.
- Tidy up repacks every room into zone bands that fill the plate, keeping each room’s area exactly.
- PNG, CSV and JSON export. The PNG carries the title, the legend, the tally and the scale bar, so it can go straight into a portfolio sheet.
- A two-way bridge with our bubble diagram maker: bring a room list in, send zone rectangles back.
- Nothing is uploaded. The diagram lives in your browser and keeps itself there between visits.
What a zoning diagram actually is
A zoning diagram divides a building, a floor or a site into areas grouped by how they are used and who is allowed to reach them. It is not a floor plan. There are no wall thicknesses, no door swings, no furniture and no structure. There is only territory, the construction reference Designing Buildings quotes the OECD definition of zoning as assigning specific functions or uses to certain areas, which is exactly this drawing: this part is for visitors, this part is for the people who live or work here, this part keeps the building running, and this is how you move between them.
That is why zoning is the first drawing that looks like architecture. An adjacency matrix tells you which spaces need to be near each other. A bubble diagram turns that into a loose arrangement, and a programmatic diagram records which group each space belongs to. A zoning diagram is the first time those relationships take up measured space on a real plate.
For the full background, the history of the technique, the types, and how zoning fits into a master plan, read our guide to architectural zoning diagrams. This page is the tool that draws one.
Why zoning comes before the plan
Once you draw a wall, you start defending it. This is the part of space planning that is cheapest to change and most expensive to get wrong. Zoning is cheap to change and a plan is not, so the decisions that are expensive to reverse belong here: which side the entrance faces, whether service can reach the back without crossing the public route, whether every bedroom sits behind one corridor or three.
Zoning also catches the mistakes that survive into construction. A plant room next to a consulting room, a kitchen opening onto a WC, a delivery route through the waiting area, these are zoning failures, and they are almost invisible once the plan is full of detail.
The five zones, and what belongs in each
The tool uses five zones and no more. A key with twelve colours is a key nobody reads.
| Zone | What it holds | Test to apply |
|---|---|---|
| Public | Entrance, reception, waiting, living and dining rooms, meeting rooms, halls, galleries, shops | Could a visitor stand here without being escorted? |
| Private | Bedrooms, consulting rooms, treatment rooms, offices, classrooms, workspaces, study | Does someone need permission, or an appointment, to be here? |
| Service | Kitchens, WCs, utility, plant, server rooms, stores, laundry, staff areas | Does the building need it to work, rather than the people in it? |
| Circulation | Corridors, lobbies, stairs, lifts, landings, passages | Is its only job getting you somewhere else? |
| Outdoor | Gardens, terraces, courtyards, yards, patios, roof terraces, parking | Is it outside the envelope but inside the project? |
The awkward cases are worth deciding once and applying consistently. A domestic kitchen is service in this scheme even though the family lives in it, because its adjacency requirements behave like service. A hotel lobby is public even though it also circulates. A staff room is service in a school and private in an office, pick one and note it in the subtitle.
How to use this zoning diagram maker
- Set the plate. Type the width and depth of the floor or site in metres at the top. The drawing rescales to fit.
- Load or list your rooms. Pick one of the four presets to start from, add rooms one at a time, or bring a room list in from the bubble diagram maker with Load JSON.
- Assign a zone to each room in the left-hand list. The swatch beside the name shows what it will be coloured.
- Set each room’s size in metres, width, then depth. The area is calculated for you.
- Arrange them. Drag a room to move it, drag its bottom-right corner to resize. Snapping keeps everything on a sensible increment. Tidy up repacks everything into zone bands if the layout gets away from you.
- Read the tally under the drawing before you export anything. That is the part of this tool a coloured sketch cannot give you.
- Export. PNG for the sheet, CSV for the schedule, JSON to come back to it later.
Reading the area tally: what the numbers are telling you
The tally is the reason to draw zoning in a tool rather than in a sketchbook. Here is what the four presets in this maker come out at, so you have something real to compare against.
| Preset | Public | Private | Service | Circulation | Outdoor | Total |
|---|---|---|---|---|---|---|
| House | 56.3 m² | 50.6 m² | 29.7 m² | 15.4 m² | 60 m² | 211.9 m² |
| Small office | 48 m² | 120 m² | 33.6 m² | 22.7 m² | 25 m² | 249.3 m² |
| Clinic | 68 m² | 72 m² | 30 m² | 27.8 m² | 197.8 m² | |
| School | 116 m² | 156 m² | 56 m² | 52.2 m² | 35 m² | 415.2 m² |
Three things are worth checking every time.
Circulation. Across these four, circulation lands between 10% and 14% of the indoor area. Under about 8% and you are probably drawing rooms that open into each other with nowhere to walk; over about 20% and you are paying for corridor. This is a smell test, not a standard, a gallery or a school will legitimately run higher than a house.
The public-private balance. In the house the two are almost equal, in the office private outweighs public more than two to one, and in the clinic they are level because waiting is a large public room. If your split does not match the way the building is actually used, the zoning is wrong before the plan starts.
Plate coverage. The line under the legend tells you what share of the plate the rooms take up. Well under 100% means unallocated space you have not thought about yet. Over 100% is impossible on one floor, and the tool will list any room hanging off the plate in red.
Zoning diagram vs bubble diagram vs adjacency matrix
These three get used interchangeably and they are not the same drawing. This is the question we get asked most often, so it is worth being exact.
| Adjacency matrix | Bubble diagram | Zoning diagram | |
|---|---|---|---|
| Question it answers | Which spaces must be near each other? | Roughly how do they arrange? | How much space does each kind of use take, and where? |
| Form | A grid of pairs | Circles and connecting lines | Rectangles on a measured plate |
| To scale? | No | Areas suggested by bubble size | Yes, in metres |
| Shows separation? | Yes, explicitly | By distance | By which band a room sits in |
| Gives you areas? | Per room, if you enter them | Per room | Per room and per zone, with shares |
| Where it sits | First | Second | Third, just before the plan |
The short version: a bubble diagram shows relationships, a zoning diagram shows territory. You can have a perfect bubble diagram and still discover, when you zone it, that the private wing needs 40% more floor than the plate has.
The order that works: matrix, then bubbles, then zones
Each of the three tools hands its output to the next, so you are not retyping room names three times.
- Start in the adjacency matrix maker. List every space with its area and mark the pairs: essential, desirable, neutral, or must be separated.
- Send it to the bubble diagram maker with one click. Essential adjacencies become solid lines, desirable ones dashed, and anything you marked must be separated is written into the description so it does not get quietly lost.
- Save that as JSON and open it here with Load JSON. Every room arrives with its area, gets a first guess at a zone from its name, and is packed onto the plate.
Bringing a room list in from the bubble diagram maker
Press Load JSON and choose a file saved by the bubble diagram maker. The tool reads each bubble’s name and area, guesses a zone from the name, and packs the rooms into zone bands.
The guess is a guess. Corridor, lobby, stair and lift go to circulation; kitchen, WC, store, plant and server to service; garden, terrace, yard and courtyard to outdoor; bedroom, consult, office and classroom to private; and the rest to public. Anything the tool has not seen before lands in public. Run your eye down the left-hand list and fix the ones it got wrong before you read the tally, a misfiled room moves real square metres between zones.
If a bubble has no area recorded, the room comes in at 12 m² so it is visible and obviously provisional.
Sending your zoning back to the bubble diagram maker
Press ↓ As bubble diagram. Each room becomes a bubble sized by its area and coloured by its zone, positioned where it sits on the plate. Each zone becomes a labelled zone rectangle around its rooms, and the per-zone tally is written into the description.
This is useful when you want to keep working on relationships after the areas are settled, drawing connection lines between rooms, for instance, while the zone bands stay visible behind them.
Functional, public-private and circulation zoning
The same plate can be zoned in more than one way, and the type you choose should follow the question you are trying to answer.
Functional zoning groups rooms by activity, the approach our guide to spatial organization diagrams sets out in full: sleeping, cooking, working, treating. It is the default and it is what the five zones in this tool approximate.
Public-private zoning ignores activity and grades everything by access, often as a gradient from the street to the most protected room. If this is your question, put every room into just public and private and read the two numbers.
Circulation zoning foregrounds the routes and treats the rooms as what is left over. Draw the corridors first, at their real widths, and you will see quickly whether the plan has one spine or four dead ends. Our guide to circulation diagrams covers this in depth.
Vertical zoning and stacking
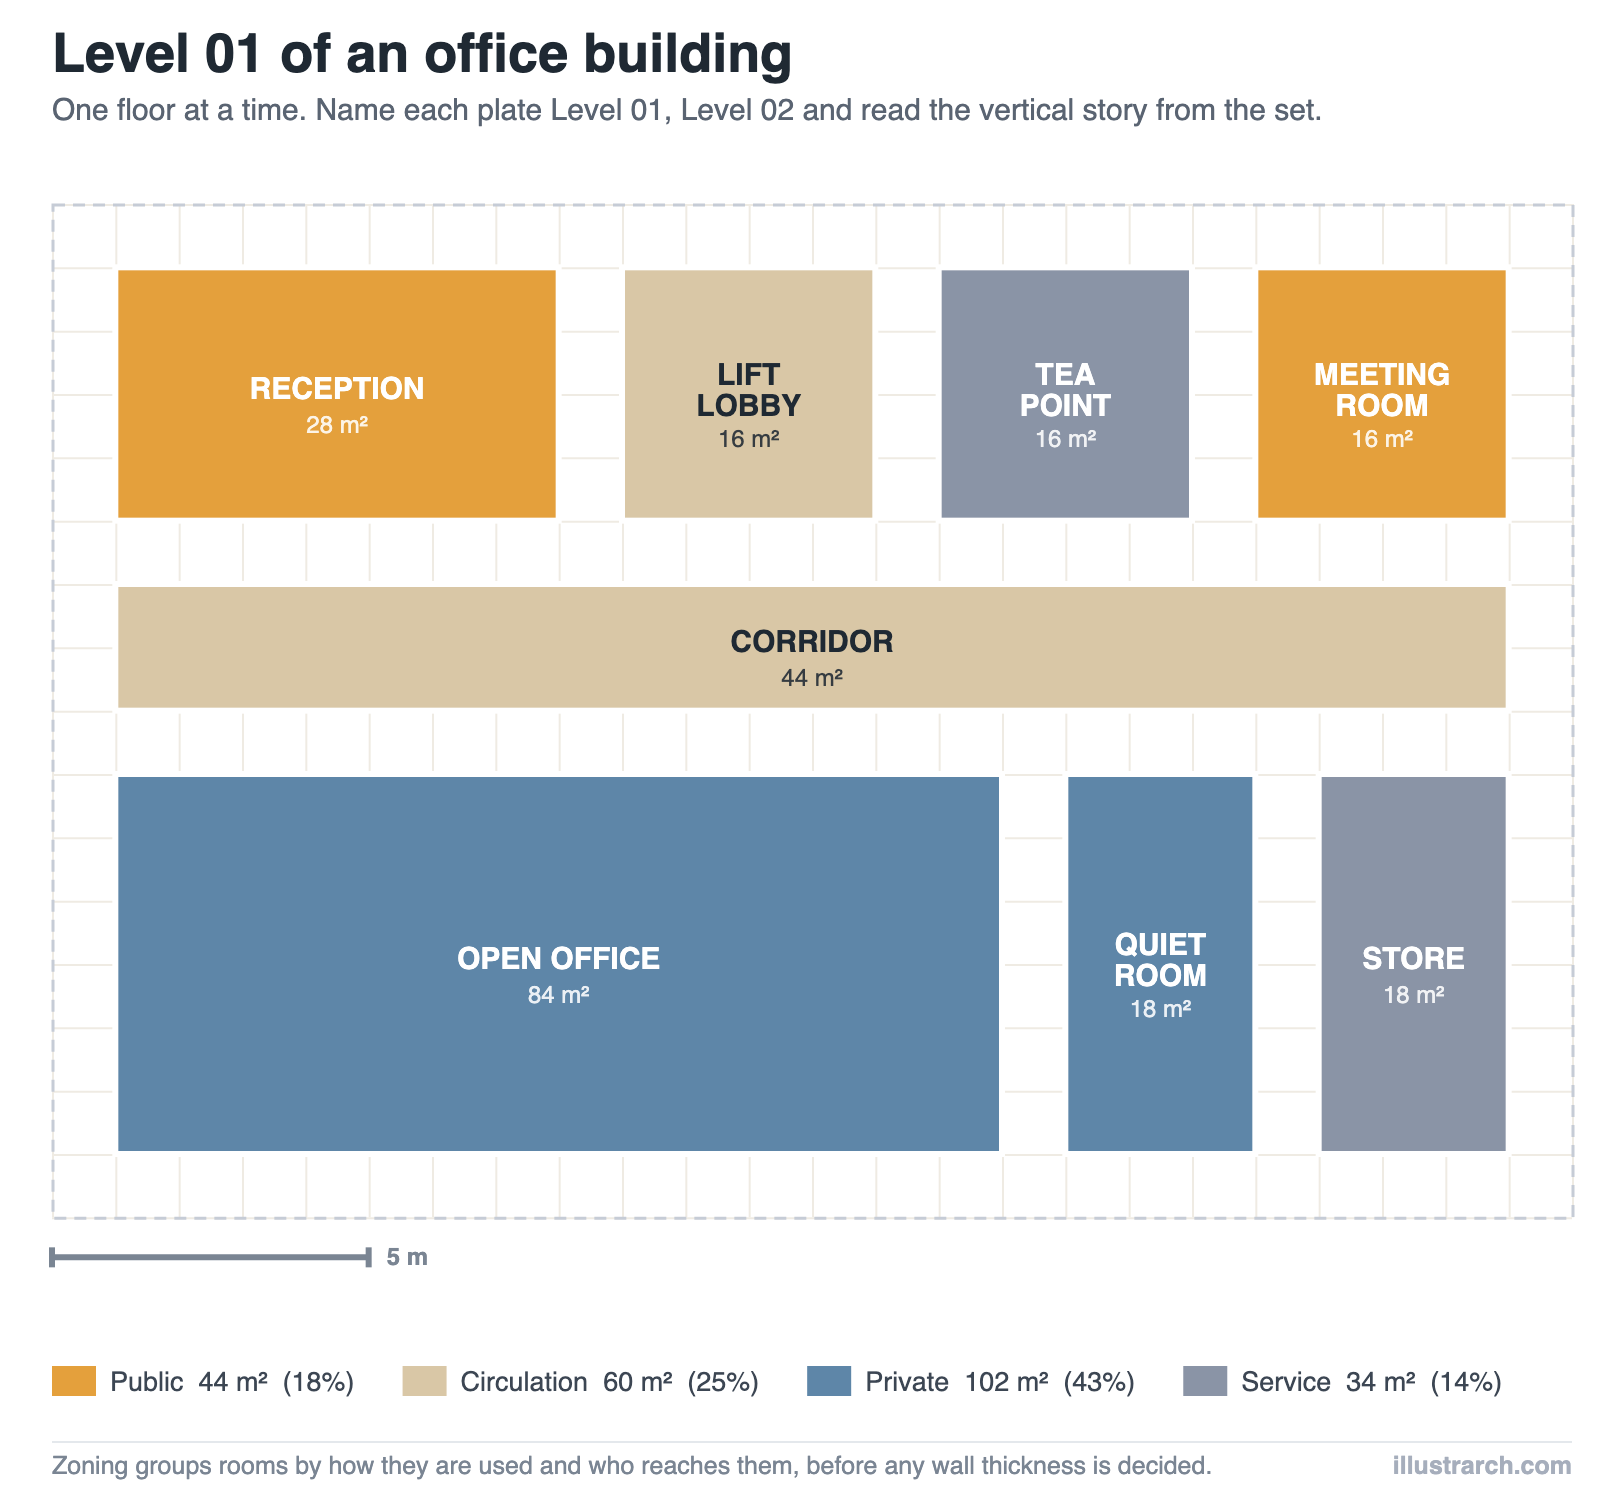
This tool zones one plate at a time. For a building where the question is which use sits on which floor, that is a stacking diagram, not a zoning diagram, see stacking diagrams. A practical approach is to draw one zoning diagram per floor, name them in the title field (“Level 01”, “Level 02”) and export each as PNG, then read the vertical story from the set.
Site zoning and building zoning
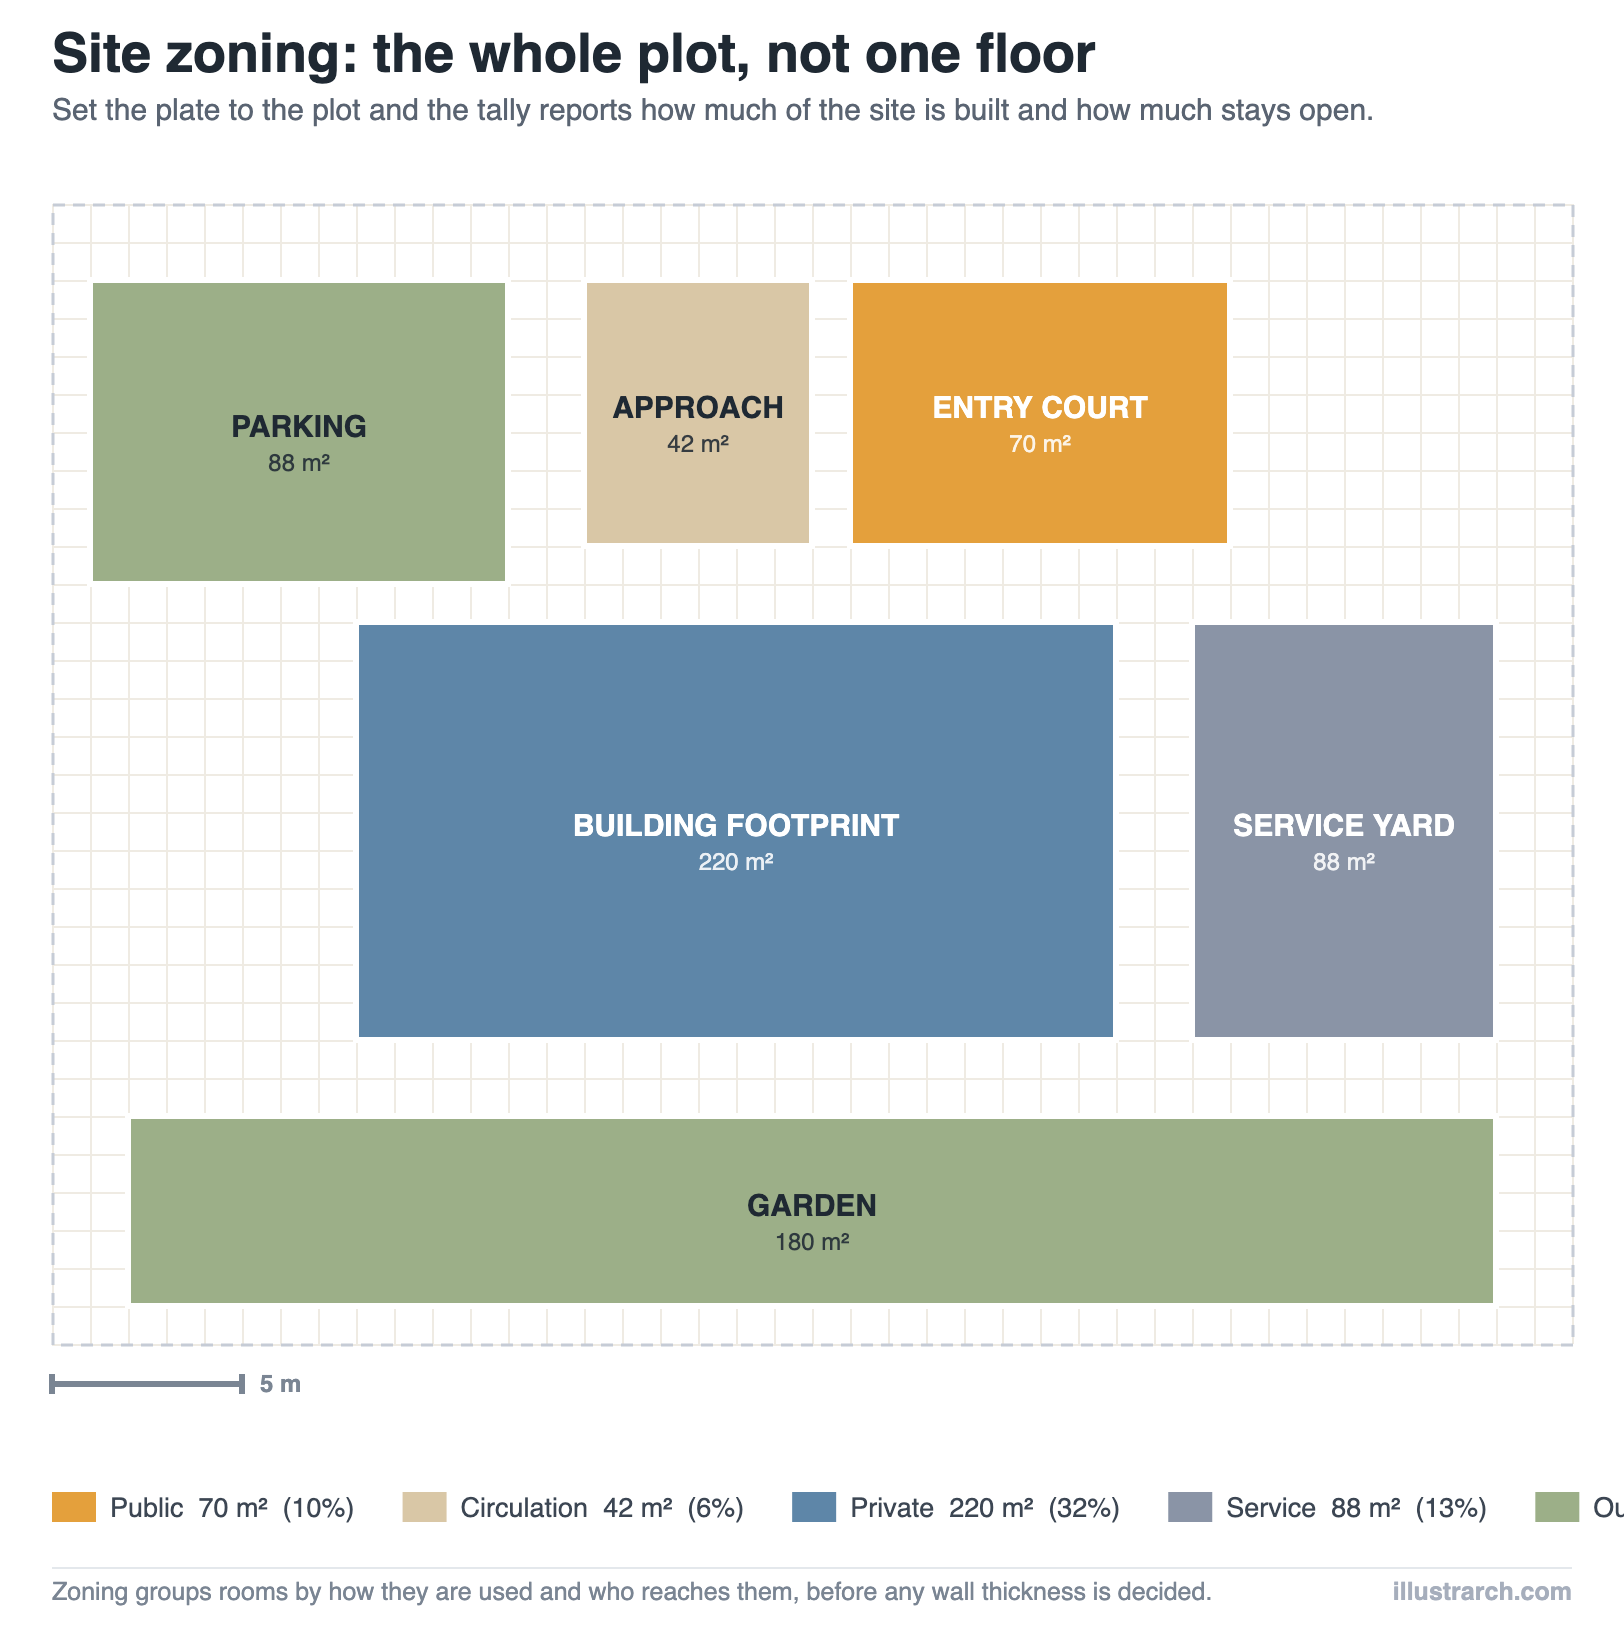
The tool does not care whether the plate is a floor or a site. Set the plate to the plot dimensions, put the building footprint in as one or more rooms, and use the outdoor zone for parking, approach, service yard and garden. The tally then tells you what share of the plot is built and what share is open, often the first number a planning discussion asks for.
One caution: municipal zoning, setbacks, height limits, permitted use classes, is a different discipline entirely and a legal matter and this tool has no knowledge of it. What you get here is a design study, not a compliance check.
A worked example: residential zoning
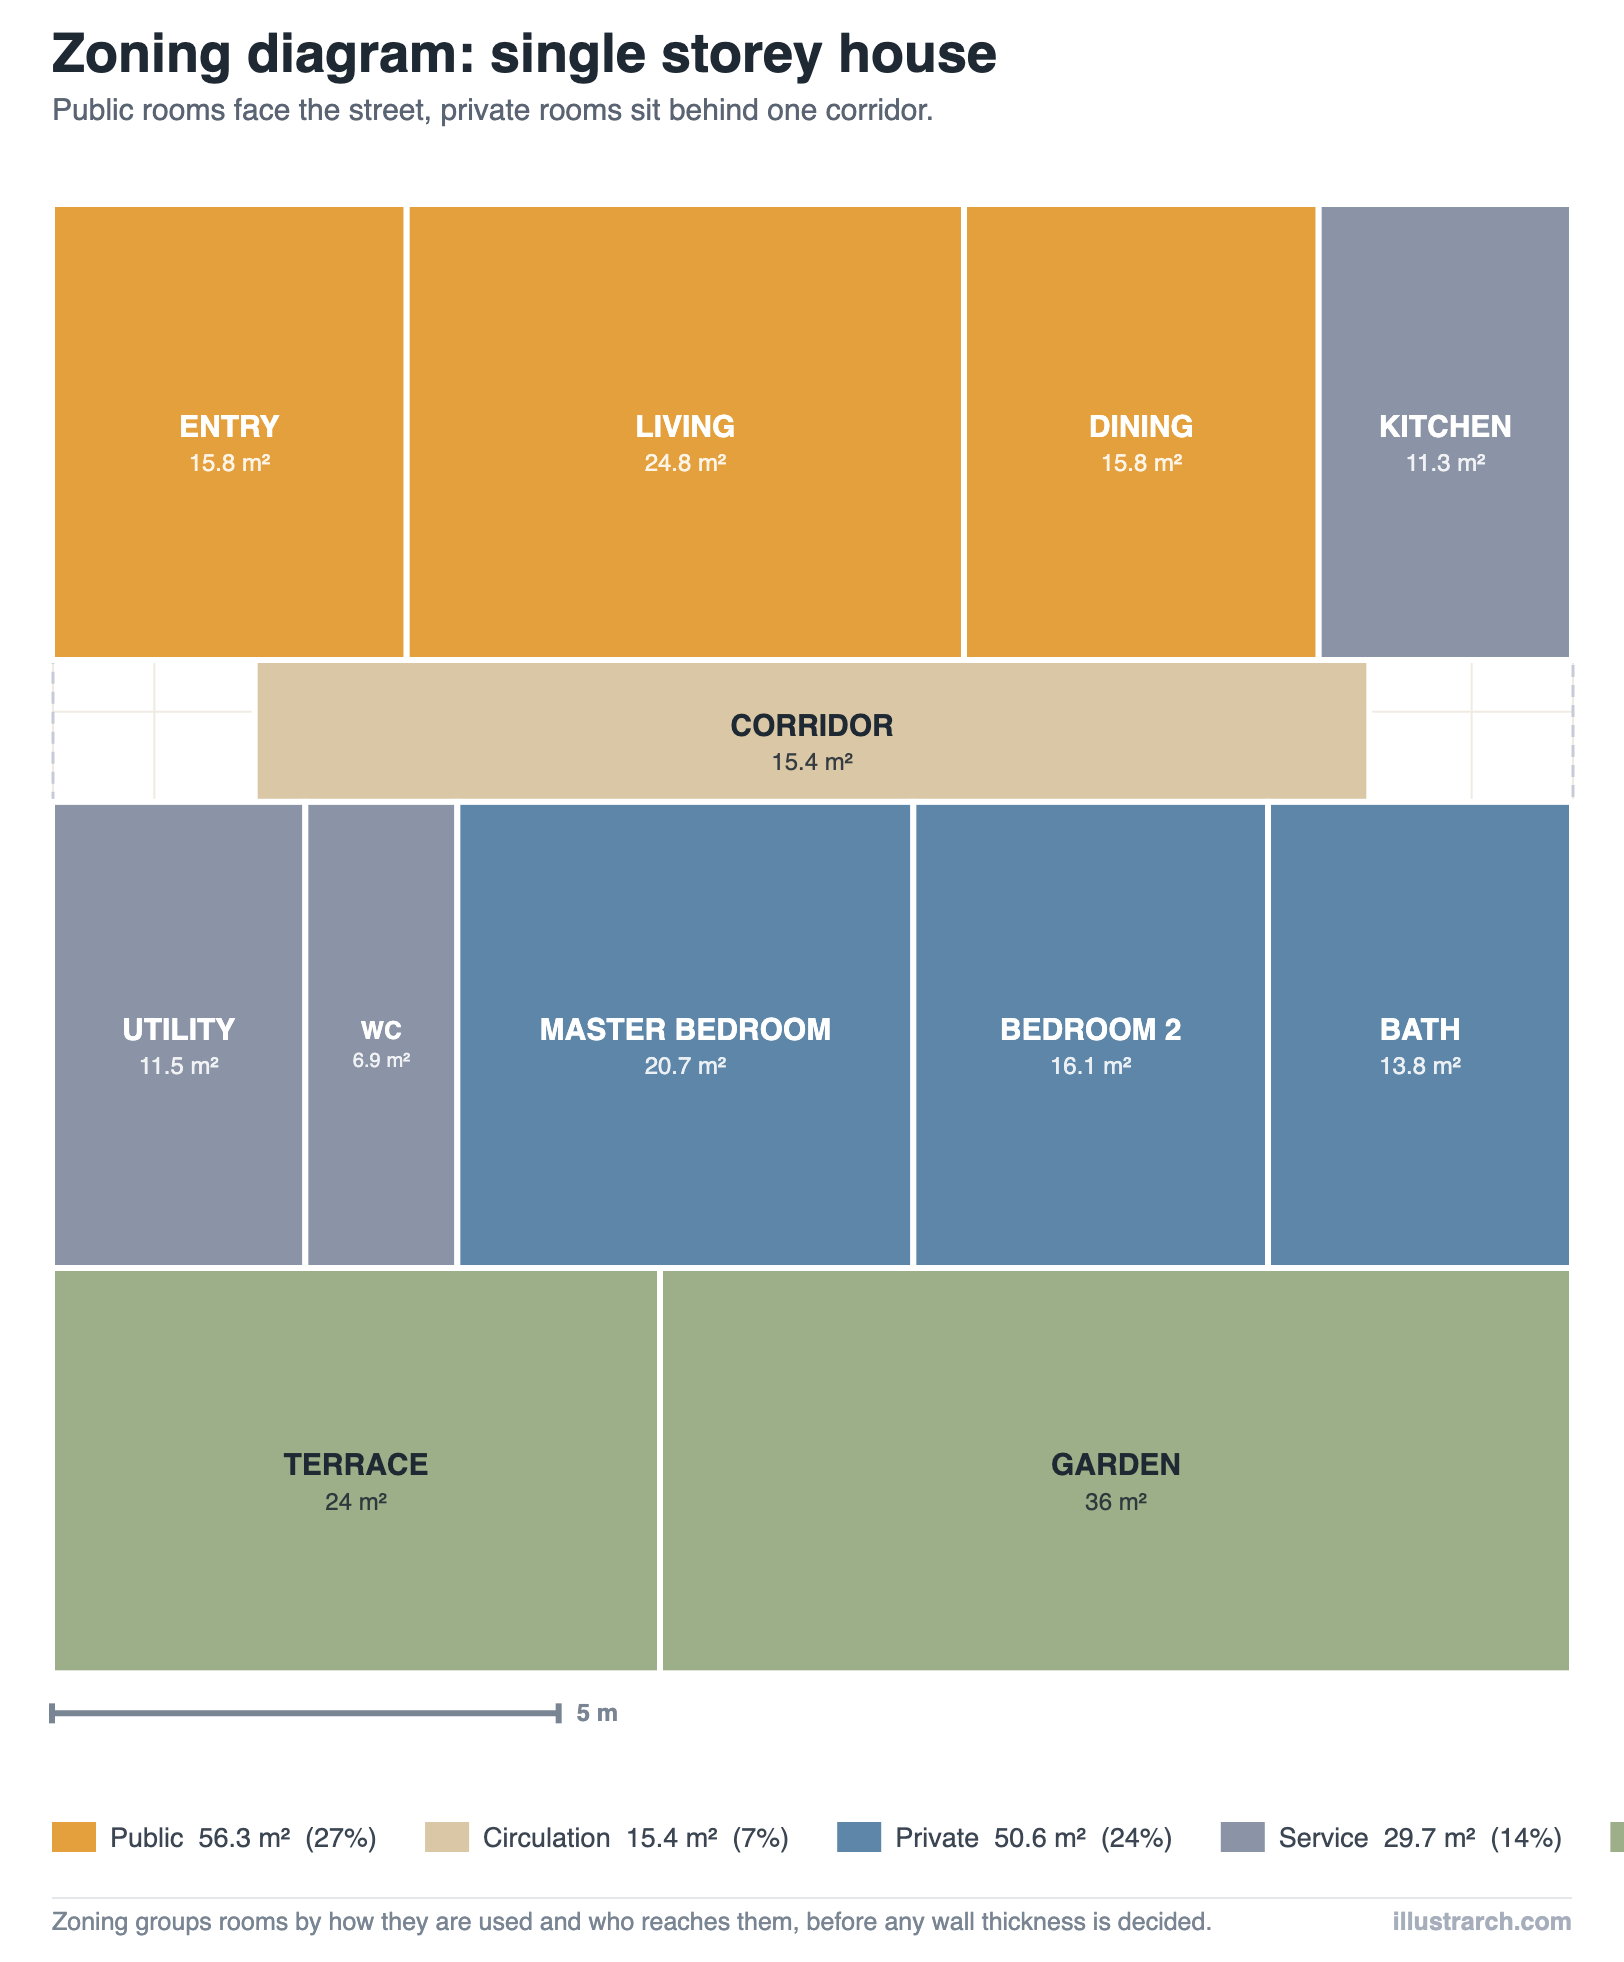
The house preset is a 15 × 14.5 m plate. Public rooms, entry, living, dining, sit along the top edge facing the street. A single 11 m corridor runs across the middle. Every bedroom and the bathroom sit behind it, and the garden and terrace take the whole bottom band.
Read the tally and the design intent is visible as numbers: outdoor is the largest single zone at 60 m², private and public are almost equal, and circulation is 15.4 m², about 10% of the indoor area for a house that never asks you to pass through one bedroom to reach another. Move the corridor and watch that number move.
A worked example: office zoning
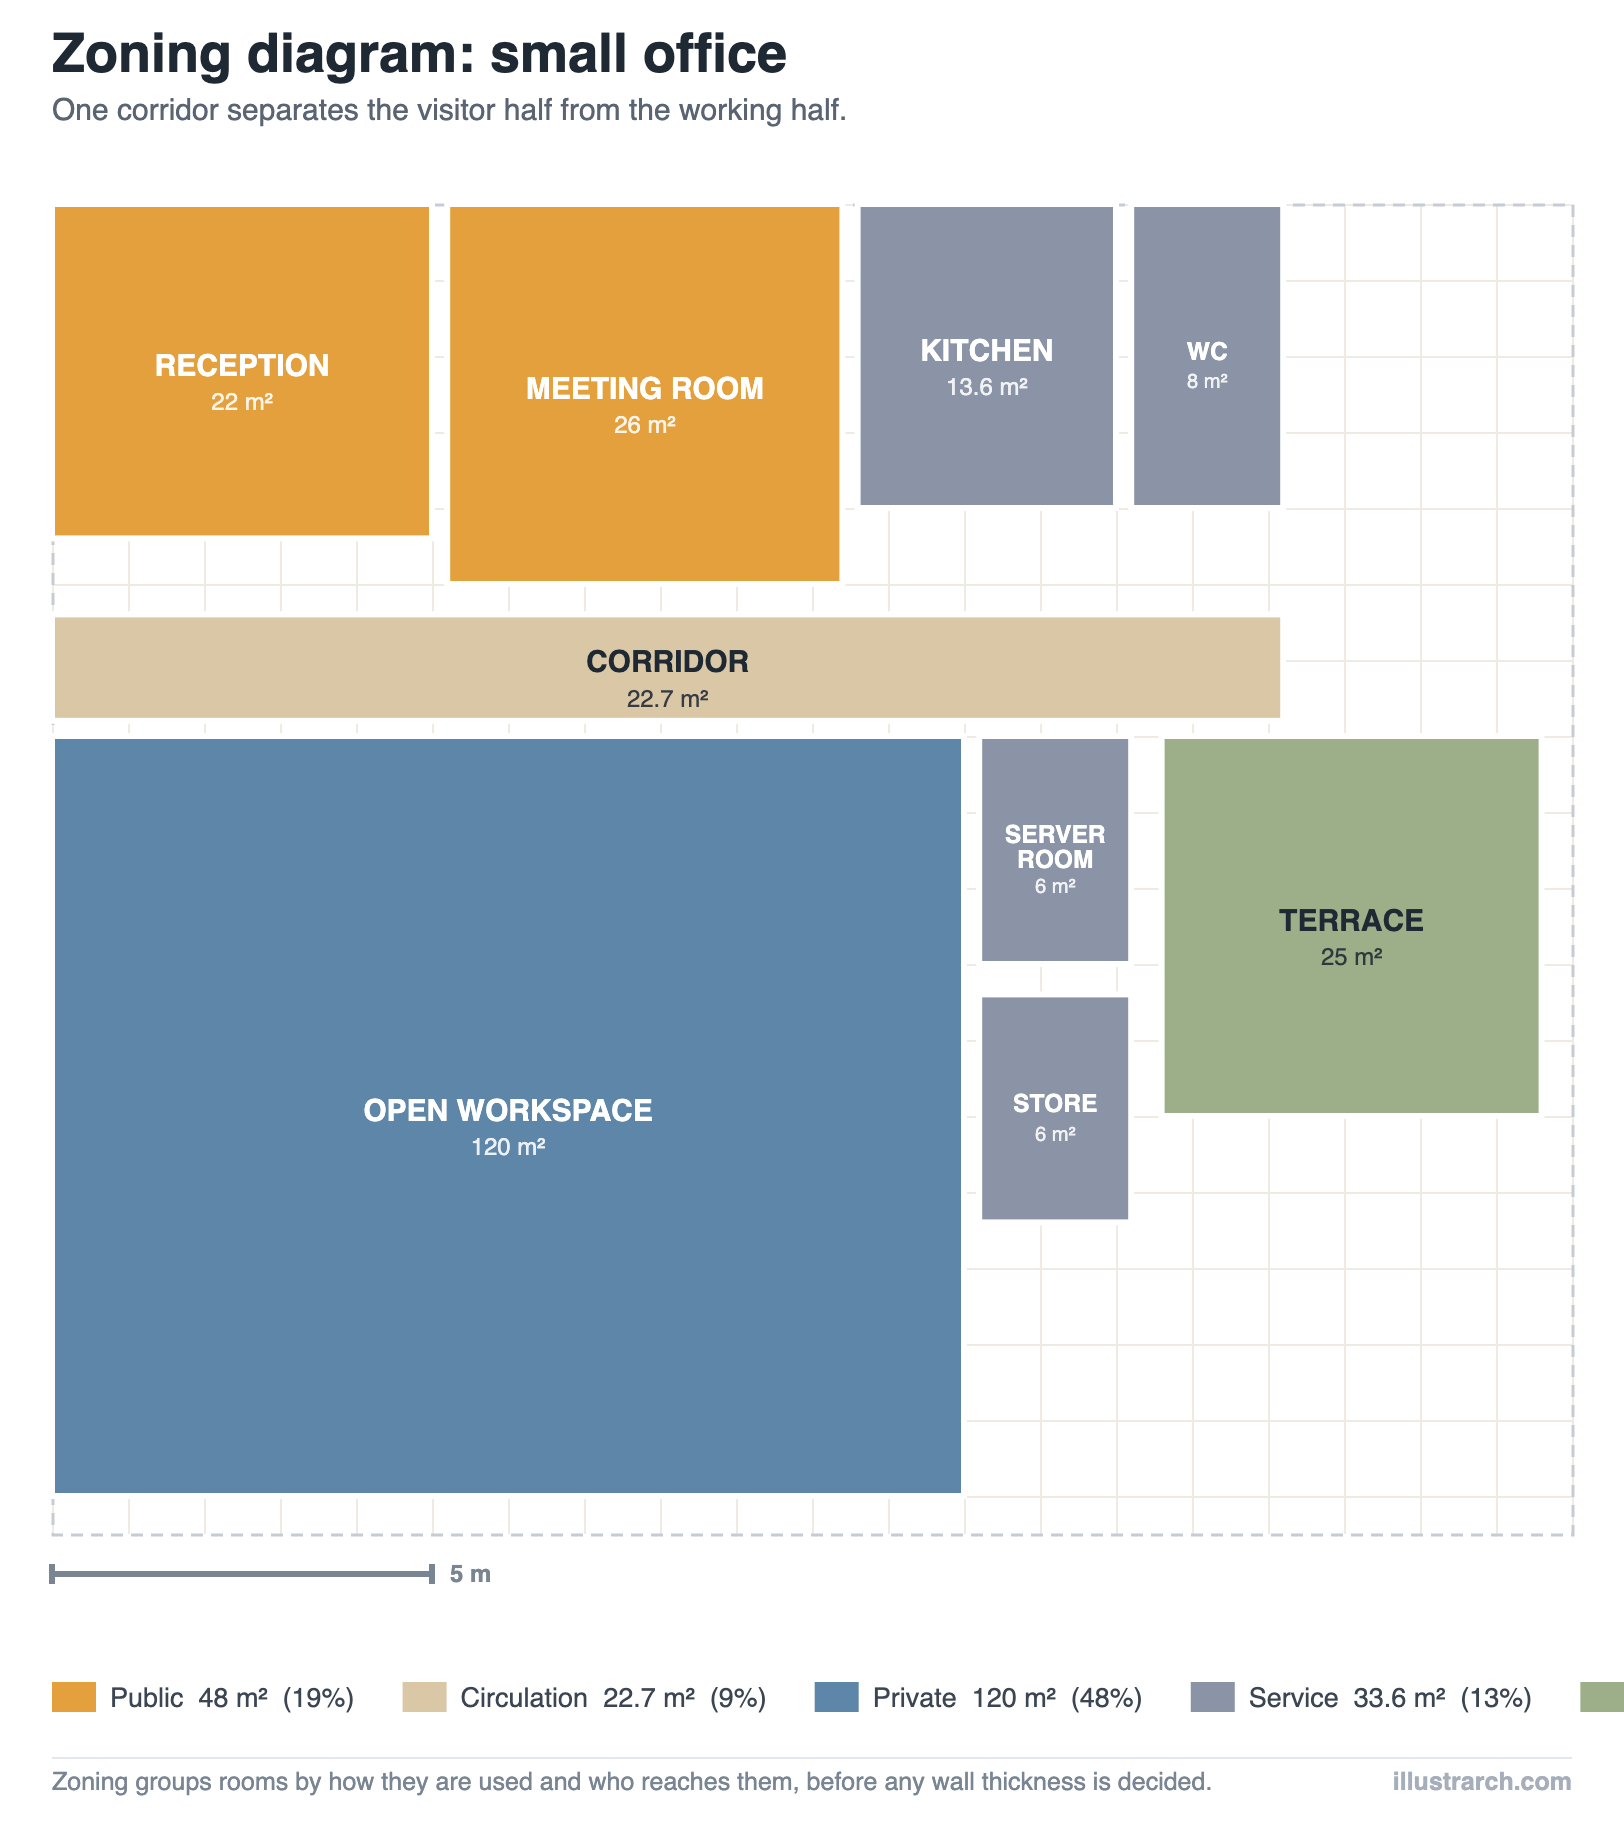
The small office preset puts reception and the meeting room on the visitor side of a 16 m corridor and the open workspace, server and store behind it. Private dominates at 120 m² because open-plan working area counts as private, visitors do not walk through it.
The useful check here is the ratio of workspace to everything else. If reception, meeting and circulation together approach the size of the workspace, the plan is spending too much on being visited and not enough on being worked in.
A worked example: clinic zoning
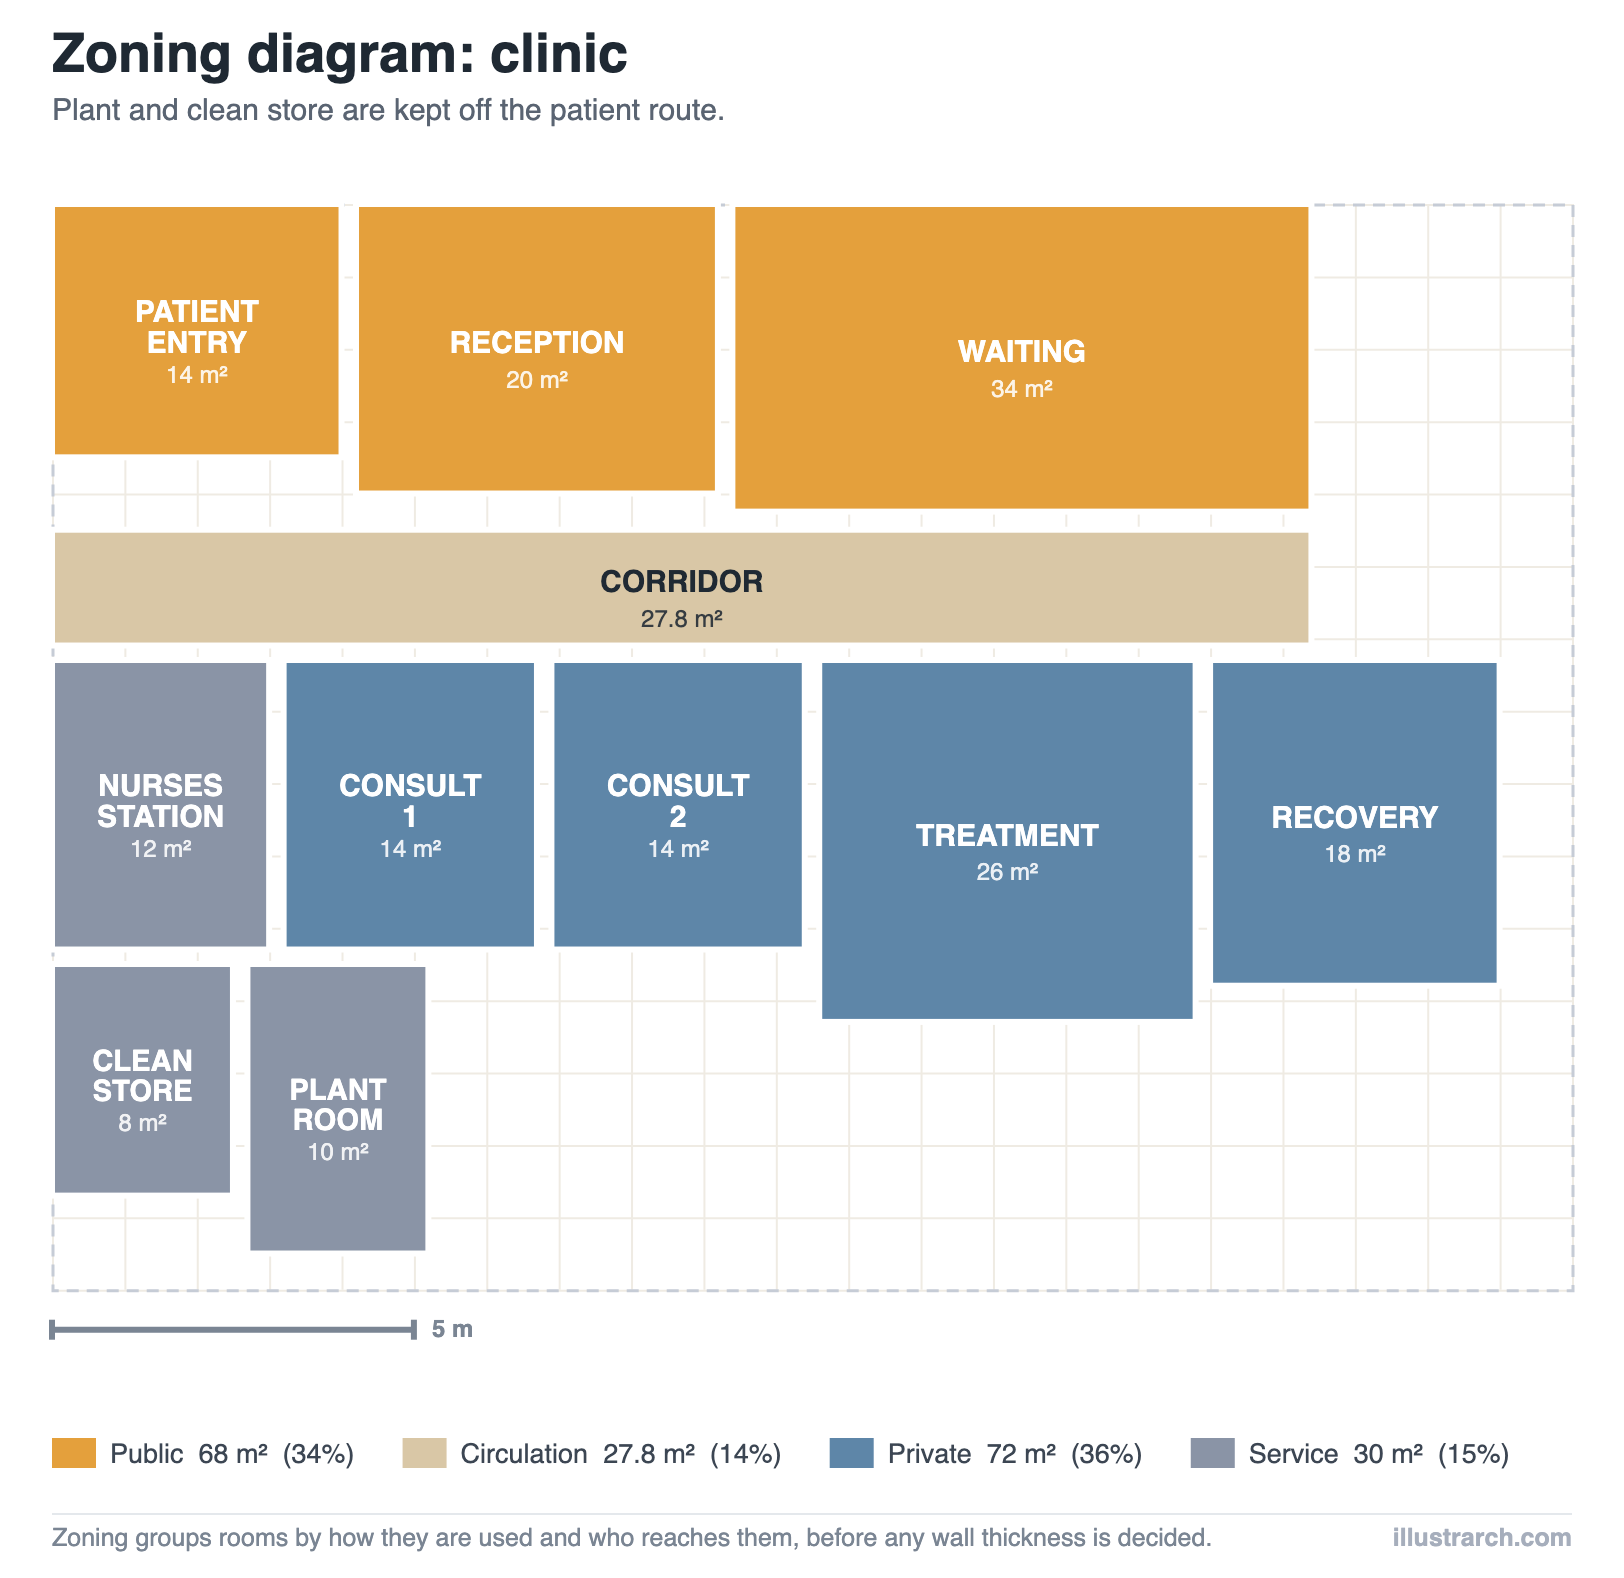
The clinic preset is the clearest case for zoning, because the consequence of getting it wrong is clinical rather than aesthetic. Patient entry, reception and waiting form one public band. A corridor separates it from consulting, treatment and recovery. Clean store and the plant room sit at the far end, off the patient route entirely.
Circulation runs highest of the four presets here at 14%, that is correct, not wasteful. A clinic needs a corridor wide enough for a trolley, our hospital bubble diagram guide works through the same brief one step earlier and routes that do not force staff to cross the waiting room.
A worked example: school zoning
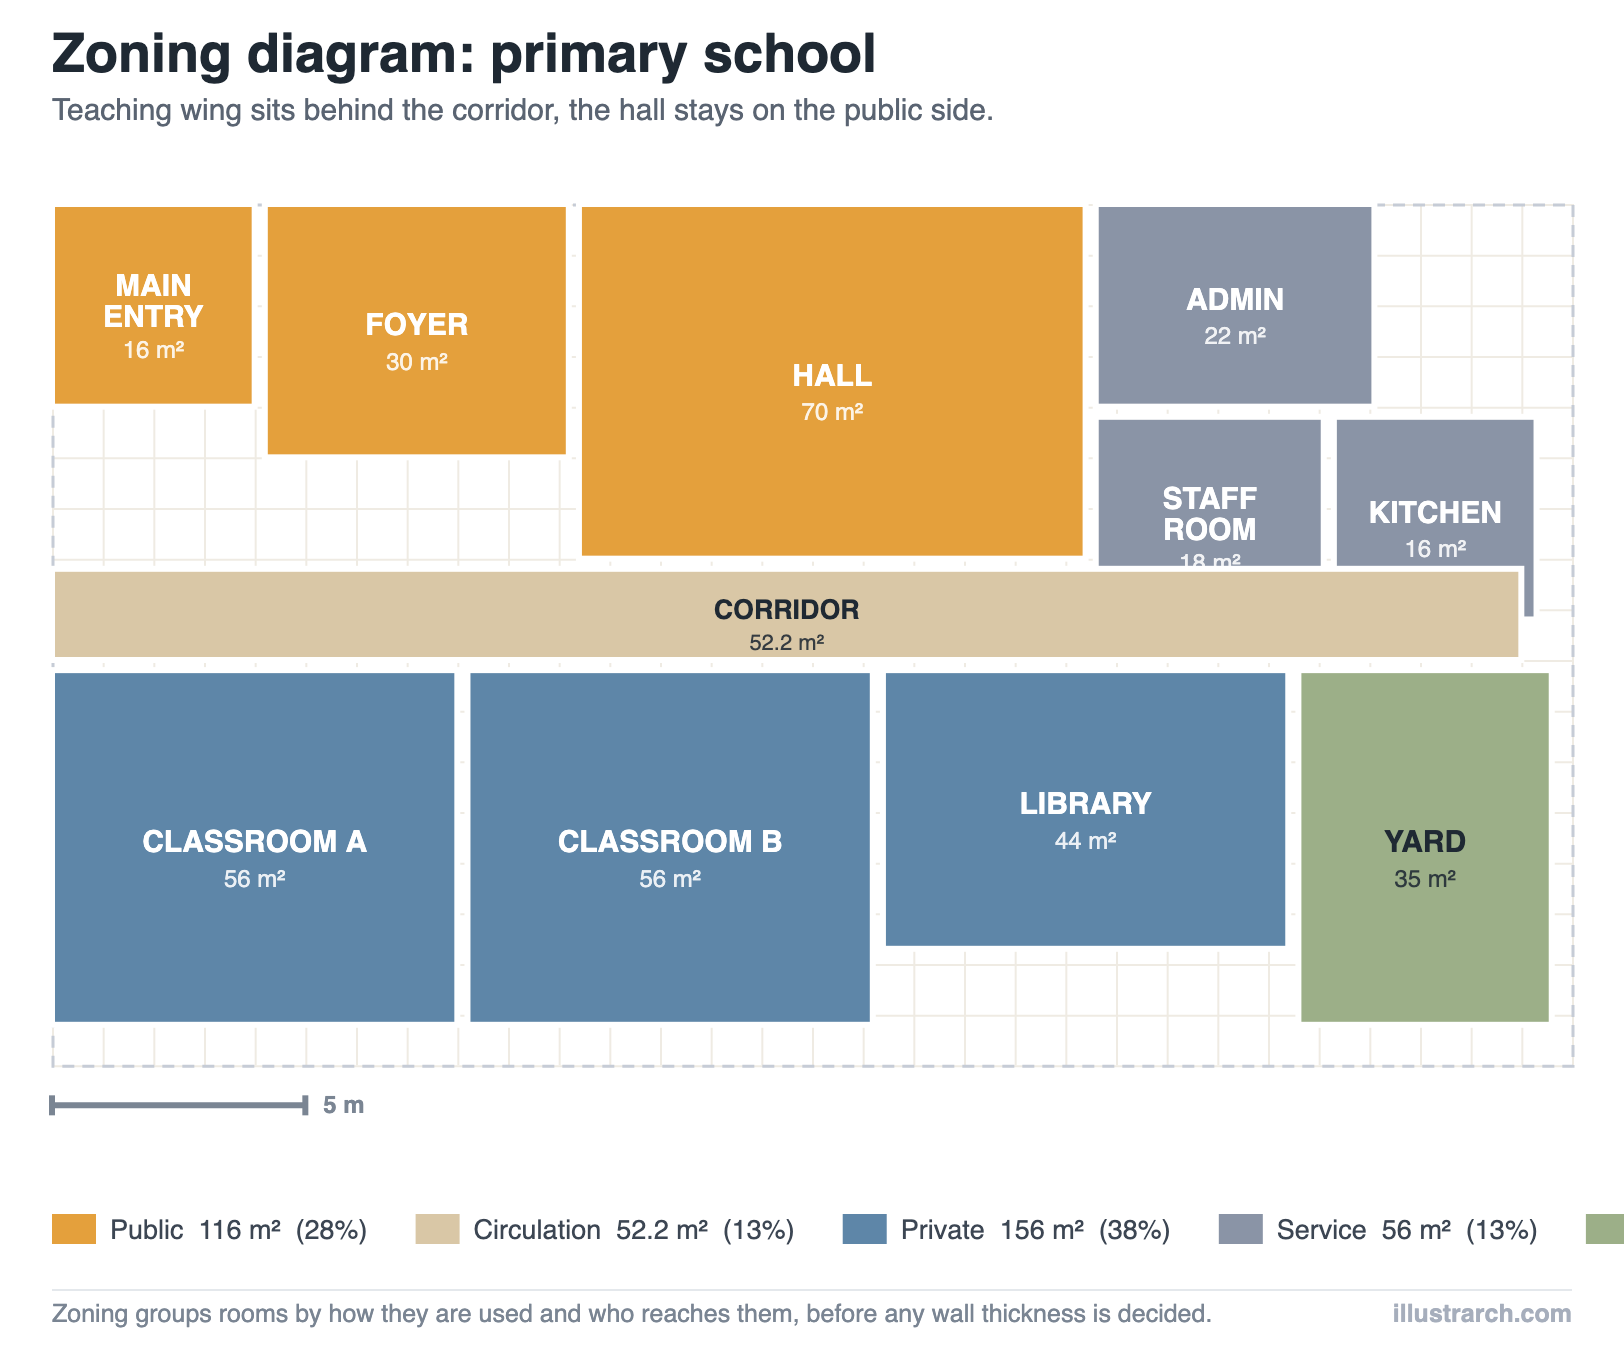
The school preset keeps the hall on the public side, so it can be used out of hours without opening the teaching wing. Classrooms and the library sit behind a 29 m corridor, and admin, staff and kitchen form a service block off the foyer.
Circulation is 52.2 m² here, the largest absolute figure of the four, and that is what a single-loaded corridor serving three teaching spaces costs. Seeing that number is usually the moment someone suggests a double-loaded corridor.
Common mistakes in zoning diagrams
- Colouring a finished floor plan. If you already have walls, you are illustrating a decision, not making one. Zone first.
- Too many zones. Once a key runs past six colours the diagram stops communicating. Merge until it reads at a glance.
- Forgetting circulation is a zone. Corridors left uncoloured make every other percentage wrong.
- No scale. A zoning diagram without a scale bar or dimensions is a bubble diagram wearing rectangles. This tool draws the scale bar into the export for exactly that reason.
- Ignoring the numbers. The tally is the finding. If you export the picture without reading it, you have done the drawing and skipped the analysis.
- Zoning only the inside. Approach, service yard and garden shape the plan as much as the rooms do.
What to export, and when
| Format | What it contains | Use it for |
|---|---|---|
| PNG | Title, subtitle, the diagram to scale, scale bar, legend with areas and shares, at twice screen resolution | Portfolio sheets, presentations, submissions |
| CSV | Every room with zone, position, size and area, then a per-zone tally with shares | Area schedules, spreadsheets, cost checks |
| JSON | The whole diagram, including the plate | Saving your work, coming back to it, sending it to someone else |
| Bubble JSON | Rooms as bubbles, zones as zone rectangles | Continuing in the bubble diagram maker |
Scale, units and precision
Everything in this tool is in metres. The grid is one metre, the scale bar is five metres, and areas are square metres rounded to one decimal place. Snapping defaults to 0.5 m, which is about the precision a zoning study deserves, if you find yourself wanting 0.1 m, you have probably moved on to planning and should be in CAD.
To work in feet, treat the plate as a proportional study rather than converting: zoning answers questions about ratio and adjacency, and those survive the change of unit.
Frequently asked questions
Is this zoning diagram maker free?
Yes, entirely. There is no account, no trial and no watermark on the export. Nothing you draw is uploaded, the diagram is stored in your own browser and is still there when you come back.
What is the difference between a zoning diagram and a floor plan?
A floor plan describes construction: walls, thicknesses, openings, structure. A zoning diagram describes intent: which kinds of use occupy which parts of the plate, and how much of it each one takes. Zoning comes first and takes minutes; the plan comes after and takes weeks.
Can I use it for site zoning as well as building zoning?
Yes. Set the plate to your plot dimensions and use the outdoor zone for everything that is not enclosed. The tally then reports built versus open as a percentage.
Does it do vertical zoning?
Not in one drawing. Draw one diagram per floor and name them in the title, or read our guide to stacking diagrams, which is the drawing type for that question.
Can I change the zone colours?
No, and that is deliberate. The five colours match the zoning diagrams used across illustrarch, so a diagram made here is readable next to the ones in our articles without a key that has to be re-learned each time.
What happens to my work if I close the tab?
It is saved in your browser automatically and reloads when you come back to this page. Use Save JSON if you need it on another machine, or if you want more than one version.
Can I start from an adjacency matrix?
Yes. Build it in the adjacency matrix maker, export it as a bubble diagram, then open that file here with Load JSON. The room names and areas come through; you set the zones.
Keep going
The theory behind this drawing type is in architectural zoning diagrams. For the two drawings that come before it, see the adjacency matrix maker and the bubble diagram maker. For the whole family of diagrams architects draw, start at 10 successful architectural diagrams.
Rate this tool
Was Free Online Zoning Diagram Maker for Architecture useful? One tap, no sign-up.

