

Architectural Zoning Diagrams: A Practical Guide for Architects
Architectural zoning diagrams are schematic drawings that group a building's spaces by function, showing how zones like public, private, and service areas relate before any floor plan is drawn. This guide covers the main diagram types, how to create them step by step, and common mistakes to avoid in practice.


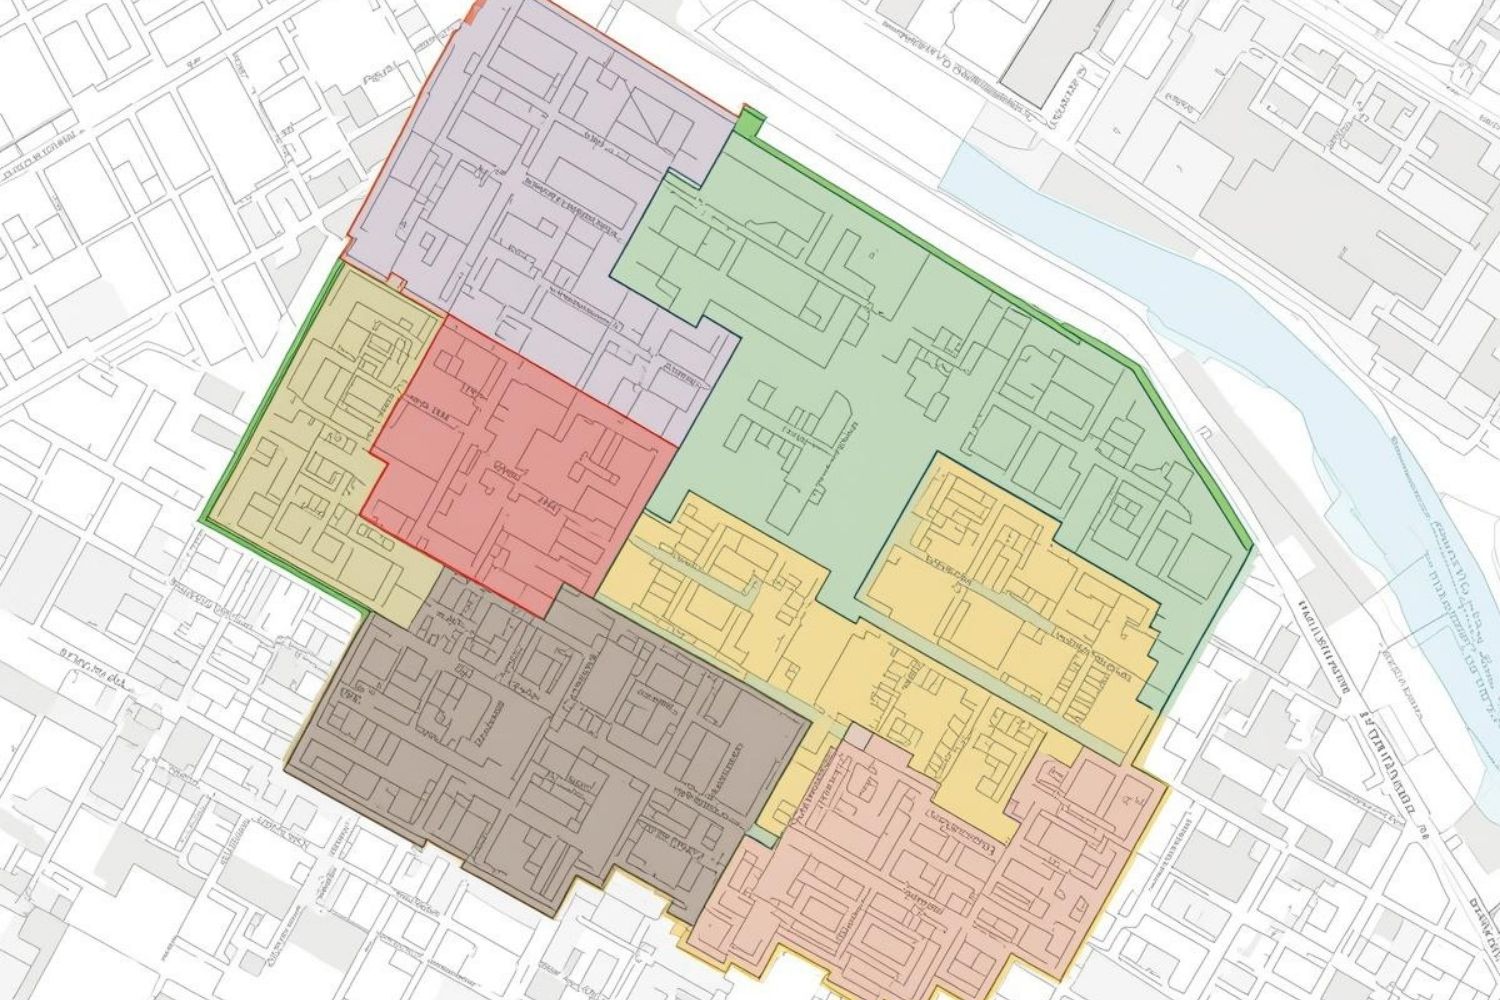
Table of Contents Show
Quick Answer: An architectural zoning diagram groups a building’s spaces into functional zones, such as public, private and service, using colour or pattern over a plan or section. It shows how a project is organized at a glance, helping architects plan circulation and separation early.
An architectural zoning diagram is a schematic drawing that groups a building’s spaces into functional categories and shows how those categories relate to one another. Unlike a floor plan, it carries no precise dimensions. Instead, it uses color coding, labeled zones, and connector lines to communicate hierarchy, adjacency, and separation before any walls are committed to paper. For architects, it is the first translation layer between a written program brief and an actual layout.
What Is an Architectural Zoning Diagram?
A zoning diagram in architecture identifies which spaces belong together and which must stay apart. A hospital cannot place a sterile operating zone adjacent to a high-traffic public corridor. A school cannot scatter classrooms randomly if the library and maker space are meant to serve as shared resources. The zoning diagram sorts these relationships out visually before detailed design begins.
The diagram typically assigns a distinct color or hatch pattern to each functional zone, then draws proximity lines or adjacency arrows between zones that require a direct connection. Zones that need separation are kept physically distant on the diagram, often with a buffer zone or circulation band between them. This early-stage clarity prevents expensive layout mistakes that would otherwise surface only after construction documents are underway.
Zoning diagrams sit within the broader family of architectural diagram types, each of which serves a different phase of the design process. A zoning diagram is most active during programming and schematic design, where it overlaps with the architectural programmes and functions diagram and often precedes the development of a detailed floor plan.
💡 Pro Tip
Experienced architects recommend producing at least three zoning diagram variations before settling on a layout. Comparing alternatives side by side often surfaces adjacency opportunities that a single diagram misses, particularly in projects where public and service zones overlap or compete for the same part of the building footprint.
Why Zoning Diagrams Matter in the Design Process
According to the American Institute of Architects (AIA), programming and schematic design together consume roughly 15 to 20 percent of an architect’s total project effort. A well-resolved zoning diagram during this phase compresses revision cycles later, when changes carry a much higher cost in time and fees.
There are three specific advantages that make the zoning diagram worth the investment. First, it forces the designer to prioritize function over form. The diagram does not care what the building looks like; it only asks whether the spatial logic makes sense. Second, it acts as a communication bridge. Clients who struggle to interpret technical drawings can usually follow a color-coded zone map without difficulty. Third, it exposes circulation conflicts before walls go up. A corridor that forces public visitors to walk through a staff-only service zone is immediately visible as a problem in a zoning diagram and can be resolved in minutes rather than weeks.
📌 Did You Know?
Research from the AIA indicates that design changes made during the schematic phase cost roughly 1 percent of the total project budget to implement, while the same changes after construction documents are complete can cost ten times more. A resolved zoning diagram at the start of a project is one of the most cost-effective investments in the entire design workflow.
Types of Architectural Zoning Diagrams
Not every project uses the same format. The type you choose depends on the project phase, the audience, and the program’s complexity. Below are the five categories that appear most often in professional practice.
Functional Zoning Diagrams
These diagrams sort spaces by their primary use: living, working, sleeping, cooking, storage, and so on. Color blocks or hatched areas represent each function, and adjacency lines indicate which zones need direct connections. A residential functional zoning diagram, for example, might cluster kitchen, dining, and pantry into one zone while keeping bedrooms and bathrooms grouped in a separate private zone away from the entry sequence.
Public-Private Zoning Diagrams
This is one of the most common architecture diagram formats used in early-stage design. The diagram divides the building into zones based on access level: fully public, semi-public, semi-private, and fully private. A museum uses this structure to separate public galleries from conservation storage and curatorial offices. A corporate headquarters applies the same logic to distinguish client reception areas from back-office operations. The visual separation on the diagram directly informs where security checkpoints, reception desks, and access control points belong in the plan.
Circulation Zoning Diagrams
Circulation zoning overlays the movement patterns on top of functional zones. It distinguishes between primary circulation paths (main lobbies, primary corridors), secondary paths (staff routes, secondary stairwells), and service paths (loading docks, goods lifts, maintenance access). This type of architecture diagram is especially valuable in healthcare and hospitality projects, where the separation of patient, staff, and service flows directly affects both operational efficiency and infection control.
Master Plan Zoning Diagrams
At the urban or campus scale, the master plan zoning diagram maps land use across an entire site: residential, commercial, mixed-use, green space, civic, and infrastructure zones. These diagrams align with local planning regulations and serve as the visual foundation for development control documents. A university campus master plan zoning diagram, for instance, might reserve the site’s northern edge for research facilities, position student housing on the southern perimeter with direct access to transit, and locate shared amenities like libraries and sports centers at the geographic center where all zones converge.
🏗️ Real-World Example
Seattle Central Library (Seattle, 2004): OMA and LMN Architects used a distinctive zoning strategy that grouped the library’s program into five stable “platforms” stacked between four flexible mixed-use zones. This zoning logic was visualized in early diagrams before any floor geometry was resolved, and the diagram became the direct generator of the building’s celebrated stacked section and form.
Environmental Zoning Diagrams
Environmental zoning diagrams layer natural factors onto the spatial program: solar orientation, prevailing wind, noise sources, views, and daylighting potential. These diagrams help place spaces with high daylight requirements, such as studios, classrooms, and living rooms, on the favorable solar facade, while locating service cores, stairwells, and storage on the less favorable side. They feed directly into passive design strategies and often inform the building’s orientation on the site.
How to Create an Architectural Zoning Diagram
The process follows a consistent sequence regardless of the project type or the tools you use. Whether you work by hand on trace paper or digitally in software like AutoCAD, Revit, or a dedicated diagramming platform, the underlying logic is the same.
Start by listing every space in the program with a rough area estimate. Group those spaces into functional families, noting which groups must be adjacent, which should be separated, and which need direct access to the building’s entry or exterior. These adjacency requirements are the raw material of the diagram. Next, assign a distinct color or pattern to each zone. Draw the zones as loose shapes scaled roughly to their relative size, then add connector lines between adjacent zones and barrier markers between zones that require separation. Label each zone clearly and include a simple legend.
The architectural programmatic diagram that follows this step will add more specific information about room counts and areas. The zoning diagram intentionally stays abstract. Resist the urge to add walls or precise room shapes at this stage. The diagram’s value comes from its flexibility: you should be able to test a different zone arrangement in minutes, not hours.
📐 Technical Note
In zoning diagrams produced for planning applications, floor area ratio (FAR) and zone area percentages are often required alongside the graphic. FAR is calculated by dividing the total building floor area by the gross site area. A site of 1,000 sqm with an FAR of 2.5 allows a maximum of 2,500 sqm of floor area distributed across any number of floors. These figures appear in building code zoning diagrams and must align with local planning authority requirements.
What Is the Difference Between a Zoning Diagram and a Bubble Diagram?
This is one of the most common points of confusion among architecture students and early-career professionals. Both tools are used during early design, both are schematic rather than precise, and both use abstract shapes rather than real room geometry. The difference lies in scale and specificity.
A bubble diagram in architecture represents individual rooms or spaces as circles, sized roughly to reflect their relative area. The bubbles show room-level adjacency: which rooms sit next to each other, which share a wall, which open directly onto a corridor. A zoning diagram, by contrast, works at a higher level of abstraction. It groups rooms into zones and shows zone-level relationships, not individual room boundaries. In practice, architects often create the zoning diagram first to establish the organizational logic, then produce bubble diagrams within each zone to resolve the room-level layout.
⚠️ Common Mistake to Avoid
A frequent error in student work is treating the zoning diagram as a floor plan draft, adding walls, door swings, and precise dimensions before the zone logic has been tested. This collapses the abstraction too early and makes the diagram rigid. If you find yourself drawing walls inside a zoning diagram, stop and pull back to the zone level. The diagram’s purpose is to test relationships, not to resolve construction details.
Zoning Diagrams and the Master Plan
At the urban scale, the master plan zoning diagram is the primary tool that connects architectural intent with planning policy. Municipalities use zoning maps to regulate land use across entire cities, specifying where residential, commercial, industrial, and recreational development can occur. Architects working on large-scale or mixed-use projects must align their spatial proposals with these regulatory zoning maps before developing any building-level diagrams.
For an in-depth look at how zoning diagrams operate within the broader context of architectural diagram types, Archisoup’s guide to zoning diagrams provides useful supplementary reading. Understanding the relationship between regulatory planning zones and design-phase zoning diagrams is essential for any architect working on mixed-use, civic, or urban infill projects.
The zoning diagram also plays a critical role in the space planning process. For a broader look at how zoning fits into the full sequence of spatial decision-making, the guide to space planning in architecture covers the principles that govern how functional zones are sized, arranged, and connected from early diagrams through to final floor plans.
💡 Pro Tip
When presenting a zoning diagram to a client, keep the color palette to four or five distinct colors maximum. More than five zones competing for visual attention on the same drawing creates confusion rather than clarity. If the program genuinely requires more zones, group secondary zones under a shared color family and use texture or pattern to distinguish them within that family.
Tools Used to Create Architectural Zoning Diagrams
The simplest zoning diagrams are drawn by hand on trace paper overlaid on a site plan or floor plate. This remains one of the fastest ways to test multiple zone arrangements in a short session. For digital production, CAD tools like AutoCAD allow precise area calculations alongside the graphic, while 3D modeling platforms such as Revit or SketchUp support three-dimensional zoning studies that show how zones stack vertically across multiple floors.
For early-phase diagramming where speed matters more than precision, dedicated diagram-making tools offer drag-and-drop zone shapes with color-fill options. A detailed comparison of leading options appears in the diagram tools for architects guide, which covers both free and paid platforms suited to different workflow stages.
Geographic Information Systems (GIS) are used when zoning diagrams need to incorporate spatial data at the city or regional scale, such as transport catchment areas, flood risk zones, or heritage buffer zones. These tools are common in urban planning and masterplanning work where the diagram must integrate regulatory data alongside architectural intent. The Esri ArcGIS platform is the industry-standard tool for GIS-based zoning work at this scale.
✅ Key Takeaways
- An architectural zoning diagram groups spaces into functional zones and shows their relationships before any floor plan dimensions are committed.
- The five main types are functional, public-private, circulation, master plan, and environmental zoning diagrams, each suited to a different design context.
- Zoning diagrams differ from bubble diagrams in scale: zoning operates at the zone level, while bubble diagrams resolve individual room adjacencies.
- Producing at least three zoning diagram alternatives before selecting a layout consistently leads to better spatial outcomes than committing to a single arrangement.
- Keeping the diagram abstract, without walls or precise dimensions, preserves the flexibility that makes zoning diagrams useful in the first place.
Frequently Asked Questions
What is the purpose of an architectural zoning diagram?
An architectural zoning diagram clarifies how a building’s spaces should be organized by function, access level, and adjacency before floor plan design begins. It helps architects, clients, and consultants agree on spatial logic early in the process, reducing costly revisions at later project stages.
How is a zoning diagram different from a floor plan?
A floor plan shows precise room dimensions, wall locations, door positions, and structural elements at a fixed scale. A zoning diagram is deliberately abstract: it shows which zones belong together and how they relate without any of the geometric precision of a floor plan. The diagram informs the floor plan but is not a draft of it.
What types of architecture projects use zoning diagrams?
Zoning diagrams are used across all building types and scales: residential homes, schools, hospitals, mixed-use developments, and urban master plans all rely on them during early design. The format and complexity of the diagram adapts to the project’s scale, but the underlying purpose remains the same across every project type.
What software is used to create architectural zoning diagrams?
Common options include AutoCAD for precise area documentation, SketchUp and Revit for three-dimensional zoning studies, GIS platforms for large-scale urban work, and purpose-built diagramming tools for rapid early-stage sketching. Hand drawing on trace paper remains a fast and effective method for initial zone testing at the start of any design session.
How to Read a Zoning Diagram
Reading a zoning diagram comes down to three signals working together: colour, adjacency and hierarchy. Each zone is given a distinct colour or tone so that public, private and service areas can be told apart instantly. The way those colours sit next to one another shows which functions need to be close (kitchen beside dining, lobby beside circulation) and which should be kept apart (mechanical rooms away from quiet bedrooms). Finally, the size and position of each block hint at hierarchy – the dominant programme usually takes the largest, most central or most prominent zone, while supporting functions wrap around it. Once you learn to scan a zoning diagram for these three cues, you can grasp the logic of an entire scheme in seconds, long before any walls are drawn.
Common Mistakes to Avoid in Zoning Diagrams
- Using too many colours, so the diagram becomes a rainbow that communicates nothing at a glance.
- Treating the zoning diagram as a finished plan – it should stay loose and conceptual, not pretend to be scaled architecture.
- Ignoring circulation, when movement between zones is often the most important relationship to test.
- Forgetting vertical zoning in multi-storey buildings, where the most interesting decisions happen between floors.
- Leaving out service and back-of-house zones, which are exactly the areas a good zoning diagram should resolve early.
Zoning Diagrams for Different Building Types
The same technique flexes across scales and programmes. In a house, a zoning diagram separates living, sleeping and service wings and tests how they open to the garden. In an office it balances open-plan work, meeting rooms and quiet focus areas against shared amenity. In a museum it organises galleries, circulation and support around a clear visitor sequence, while in a mixed-use building zoning becomes vertical – retail at street level, offices above, residential at the top – with each band needing its own access and servicing. Whatever the project, the zoning diagram is the first place those big spatial decisions are made visible and easy to argue about.
Frequently Asked Questions
A zoning diagram divides a building or site into functional zones, like public, private and service areas, shown with colour or pattern. It gives a quick overview of how the project is organized before individual rooms are designed.
A zoning diagram groups spaces into broad functional areas over a plan, while a bubble diagram shows the relationships between individual spaces as connected circles. Zoning works at a larger scale, and bubbles work at the room level.
Most zoning diagrams separate public zones (entrances, lobbies), private zones (offices, bedrooms) and service zones (kitchens, storage, mechanical). Larger projects may add semi-public, circulation and outdoor zones depending on the building type.


Bubble Diagram for Residential Projects: From Brief to Layout
A step-by-step look at how a bubble diagram organizes a residential brief...

Spatial Organization Diagrams in Architecture: Types, Examples, and How to Choose
This guide breaks down the five core types of spatial organization diagrams...

Bubble Diagram School Design: A Step by Step Guide for Educational Buildings
A practical look at bubble diagram school design for educational buildings. It...

Understanding Architectural Functional Relationship Diagrams: A Practical Guide
Functional relationship diagrams are essential planning tools that architects use during the...

Leave a comment