

Stacking Diagram: How to Allocate Uses Floor by Floor
A stacking diagram assigns each use in a brief to a level, and gives total area and building height. How to build one, test options, and check core alignment.
 Sinan Ozen7 September 20267 Mins read87
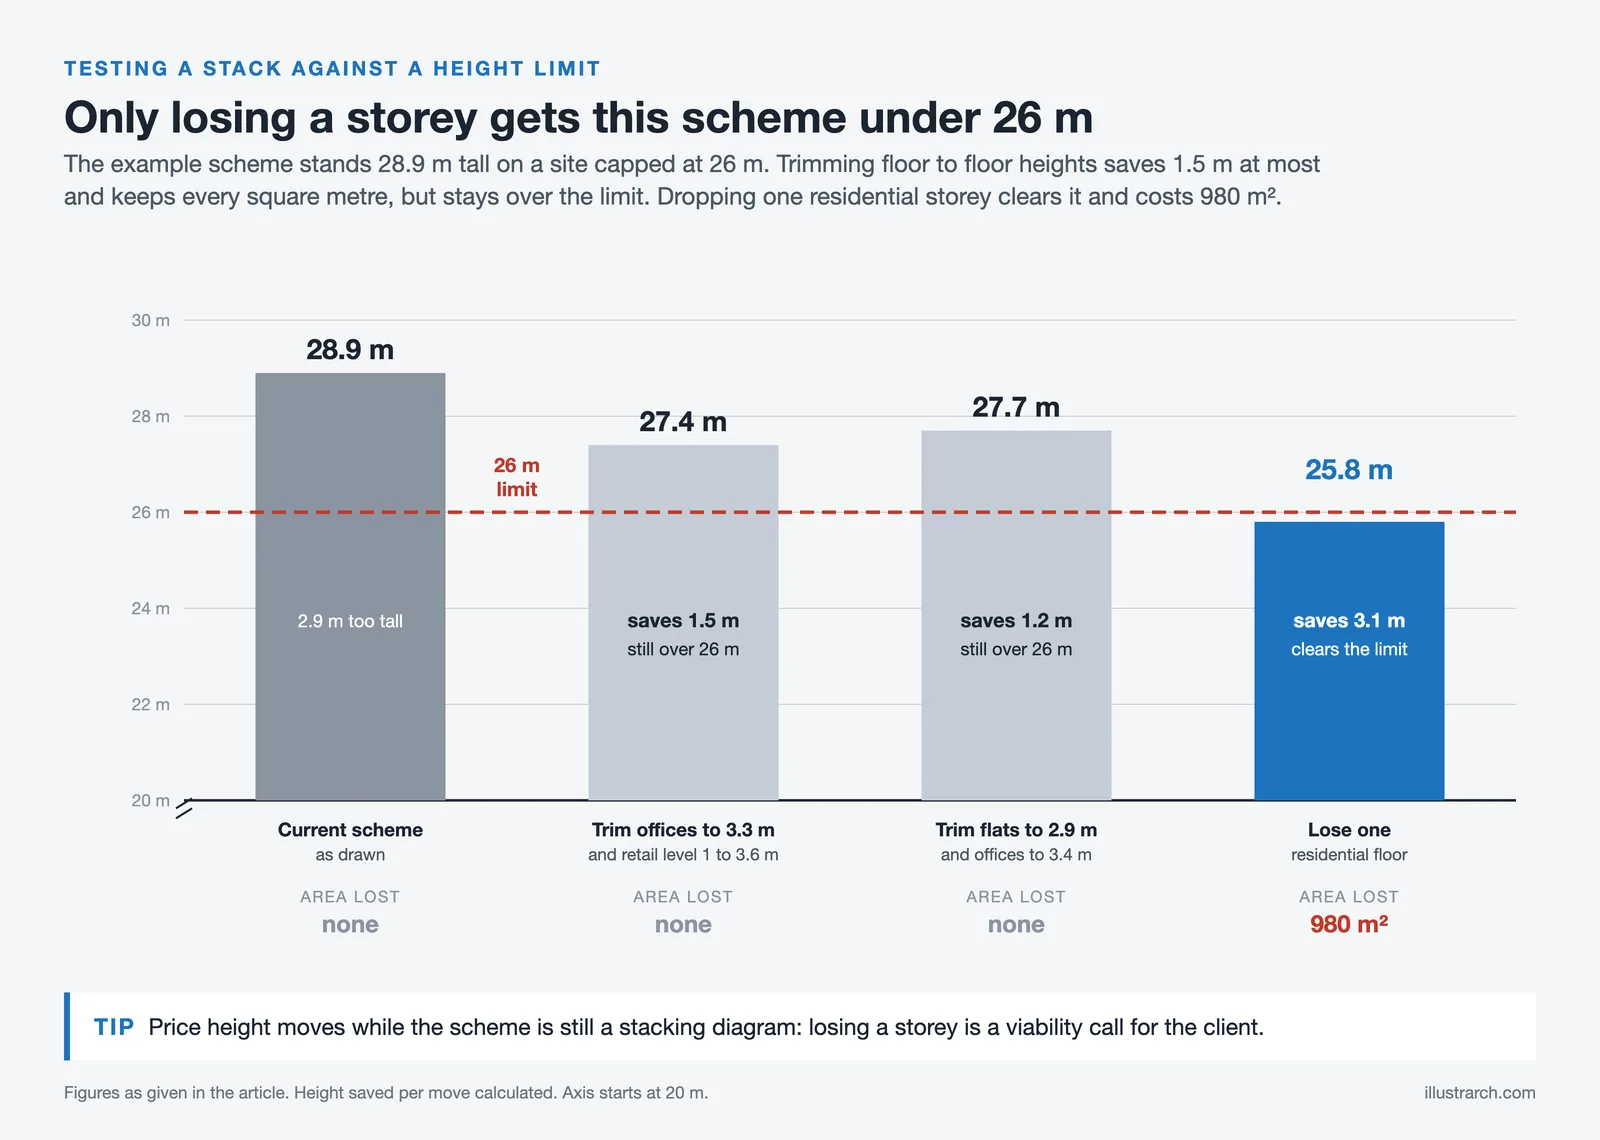
Table of Contents Show
Quick Answer: A stacking diagram is a vertical chart that assigns every use in a brief to a level of the building. Each band is one floor, coloured by use and labelled with its area and floor-to-floor height. It settles what sits above what, and how tall the building becomes, before any plan is drawn.
On a single-storey building the plan does all the work. Add floors and a second question appears that no plan can answer: what belongs on which level, and what has to line up between them. A stacking diagram is the drawing that settles it, and it is usually the first thing produced once the areas in a brief are known.
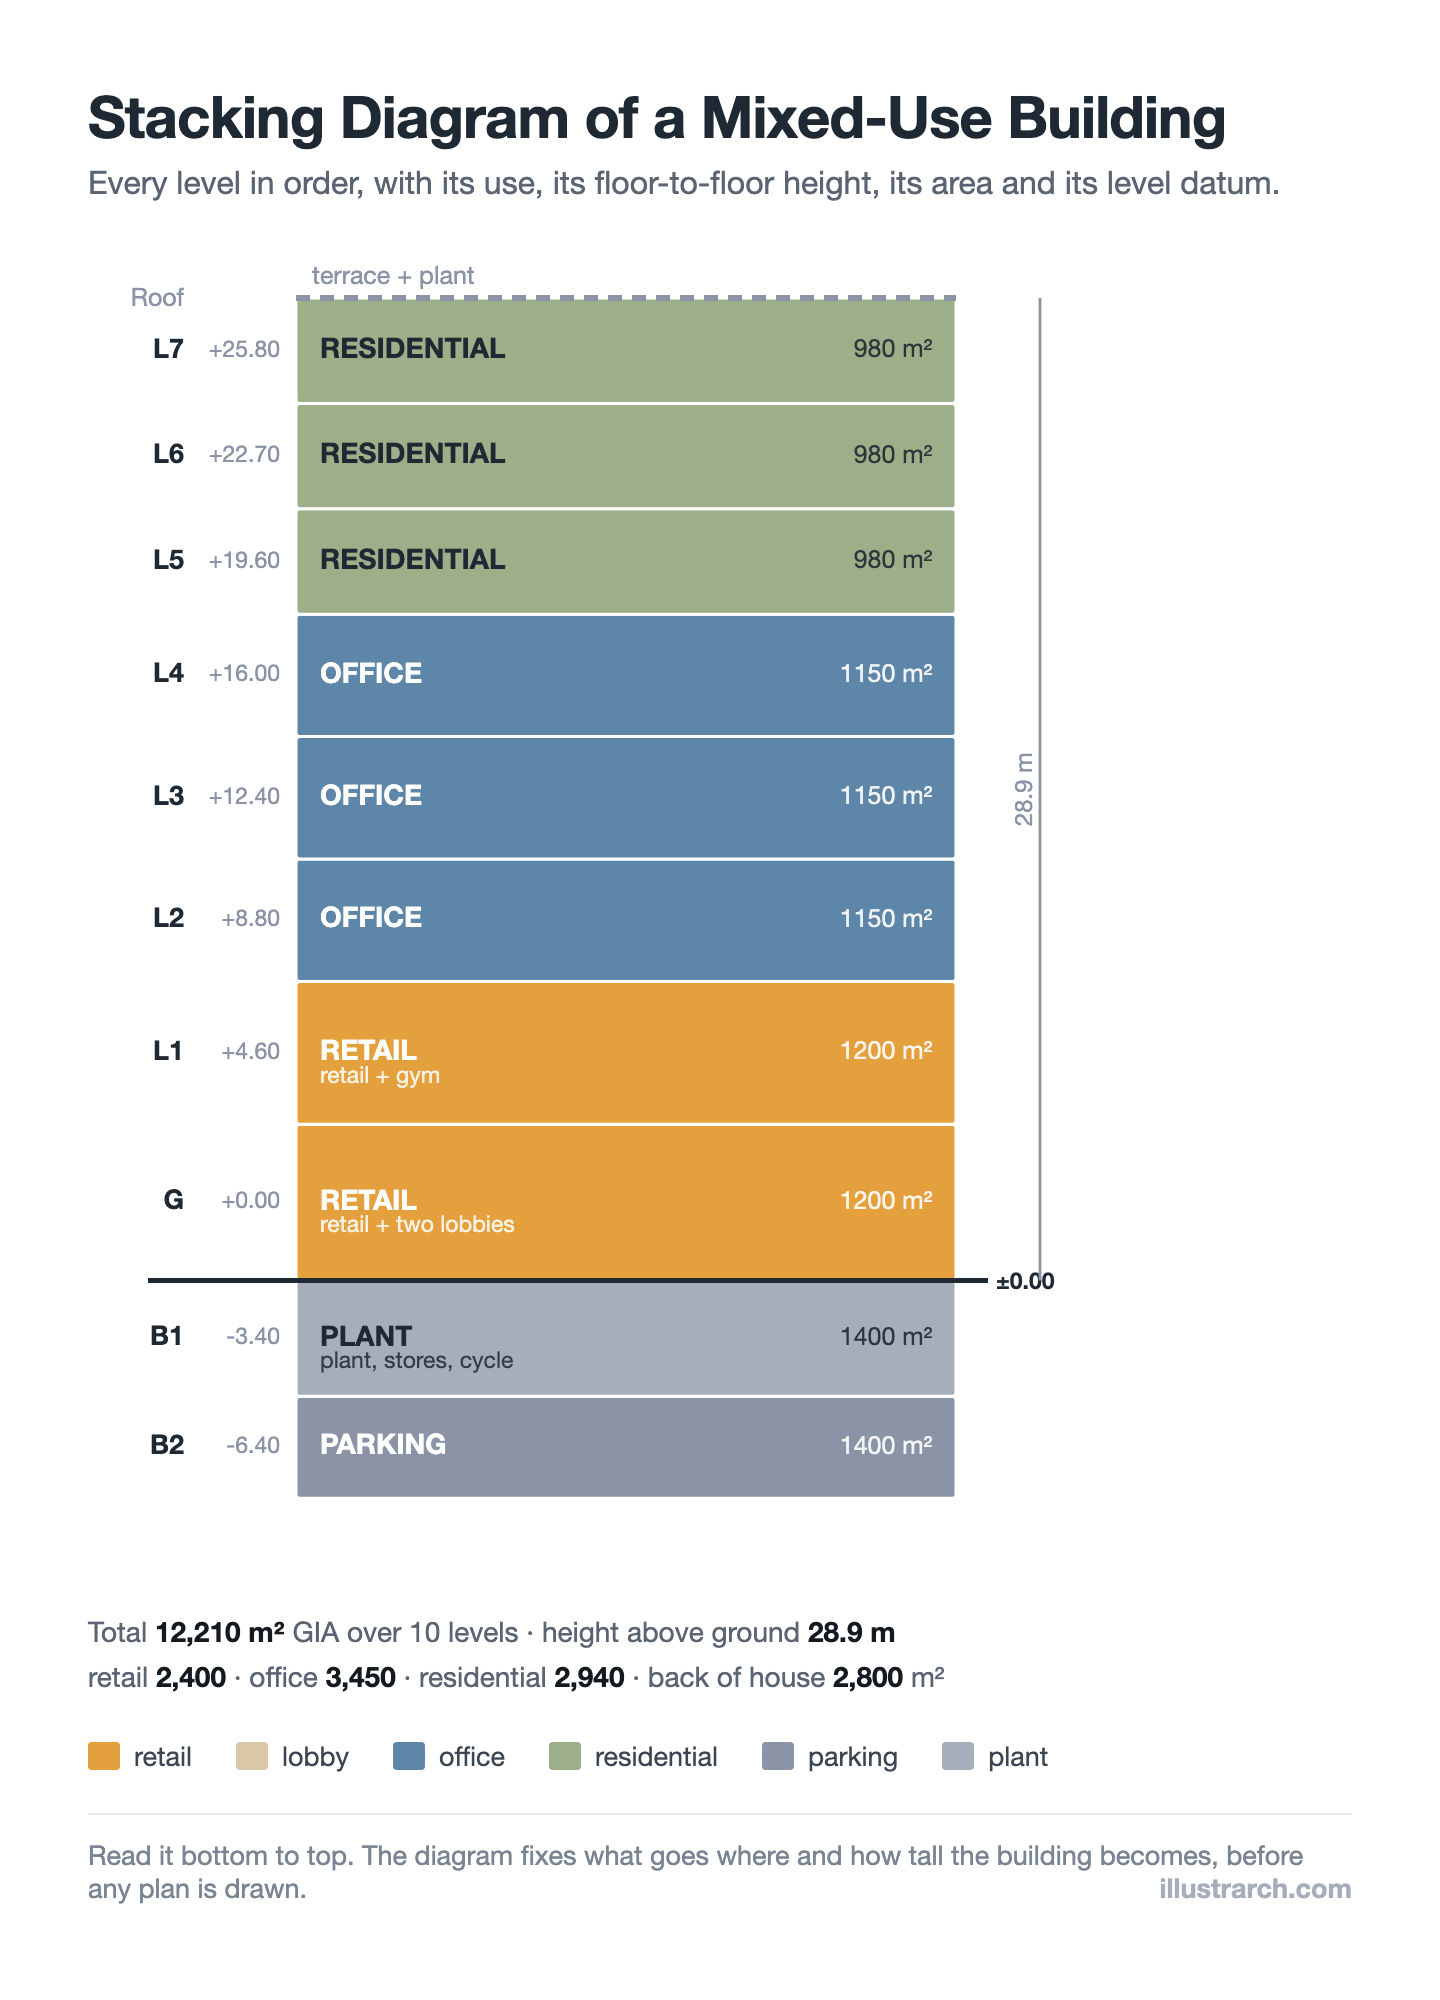
A ten-level mixed-use scheme. Each band is one storey drawn to its real height, so the diagram doubles as a first section.
What Is a Stacking Diagram?
A stacking diagram shows a building as a vertical sequence of floors, from the lowest basement to the roof. Every level carries three pieces of information: what it is for, how much area it has, and how tall it is. Add the heights and you get the building height. Add the areas and you get the gross internal area.
It is the vertical counterpart of a bubble diagram. Where a bubble diagram sorts out what should sit next to what on one floor, a stacking diagram sorts out what should sit above what across many. On a multi-storey project the two get drawn in parallel, and neither is finished until the other agrees with it.
📐 Technical Note
Draw the bands to their real floor-to-floor heights rather than making them all equal. A retail floor at 4.6 m and an apartment at 3.1 m are a metre and a half apart, and across ten levels that difference decides whether the scheme meets a height limit. A stacking diagram with equal bands looks tidier and hides the one number planners will check first.
What Goes Into One?
Four things, and the diagram is worth very little without any of them.
- Use per level. Taken from the brief, grouped into the smallest number of categories that still makes the decision visible.
- Area per level. Floor plates rarely stay constant. In the example above they drop from 1,400 m² in the basement to 980 m² in the residential storeys as the building sets back.
- Floor-to-floor height. Set by use, not by preference: parking and plant need clear depth for ducts and ramps, retail wants generous height at the front, apartments do not.
- A level datum. Every band carries the height of its finished floor above ground, which is what everyone else on the team will quote back at you.
The example totals 12,210 m² over ten levels and reaches 28.9 m above ground. Both numbers come straight out of the diagram, which is why it is the drawing a client and a planning consultant will ask for first.
Which Uses Go Where?
Stacking is not free arrangement. A handful of pressures decide most of it before any judgement is applied.
| Use | Wants to be | Because |
|---|---|---|
| Retail, cafes | Ground, on the busy frontage | Trade depends on people walking past |
| Lobbies | Ground, one per tenure | Separate access for separate uses |
| Parking, plant, storage | Basement or roof | No daylight needed, and rent is lowest |
| Offices | Lower to middle floors | Large floor plates, heavy footfall at peak |
| Housing | Upper floors | Quiet, daylight, views, private access |
| Shared amenity | At a transition level or the roof | Serves the floors it sits between |
Those pressures conflict often enough that the diagram is worth testing rather than assuming. The space type guidance published by the National Institute of Building Sciences is a useful check on what each use actually needs before you commit a level to it.
Testing Options Is the Point
A single stacking diagram records a decision. Two of them make the decision arguable, which is far more useful at the stage this drawing belongs to.
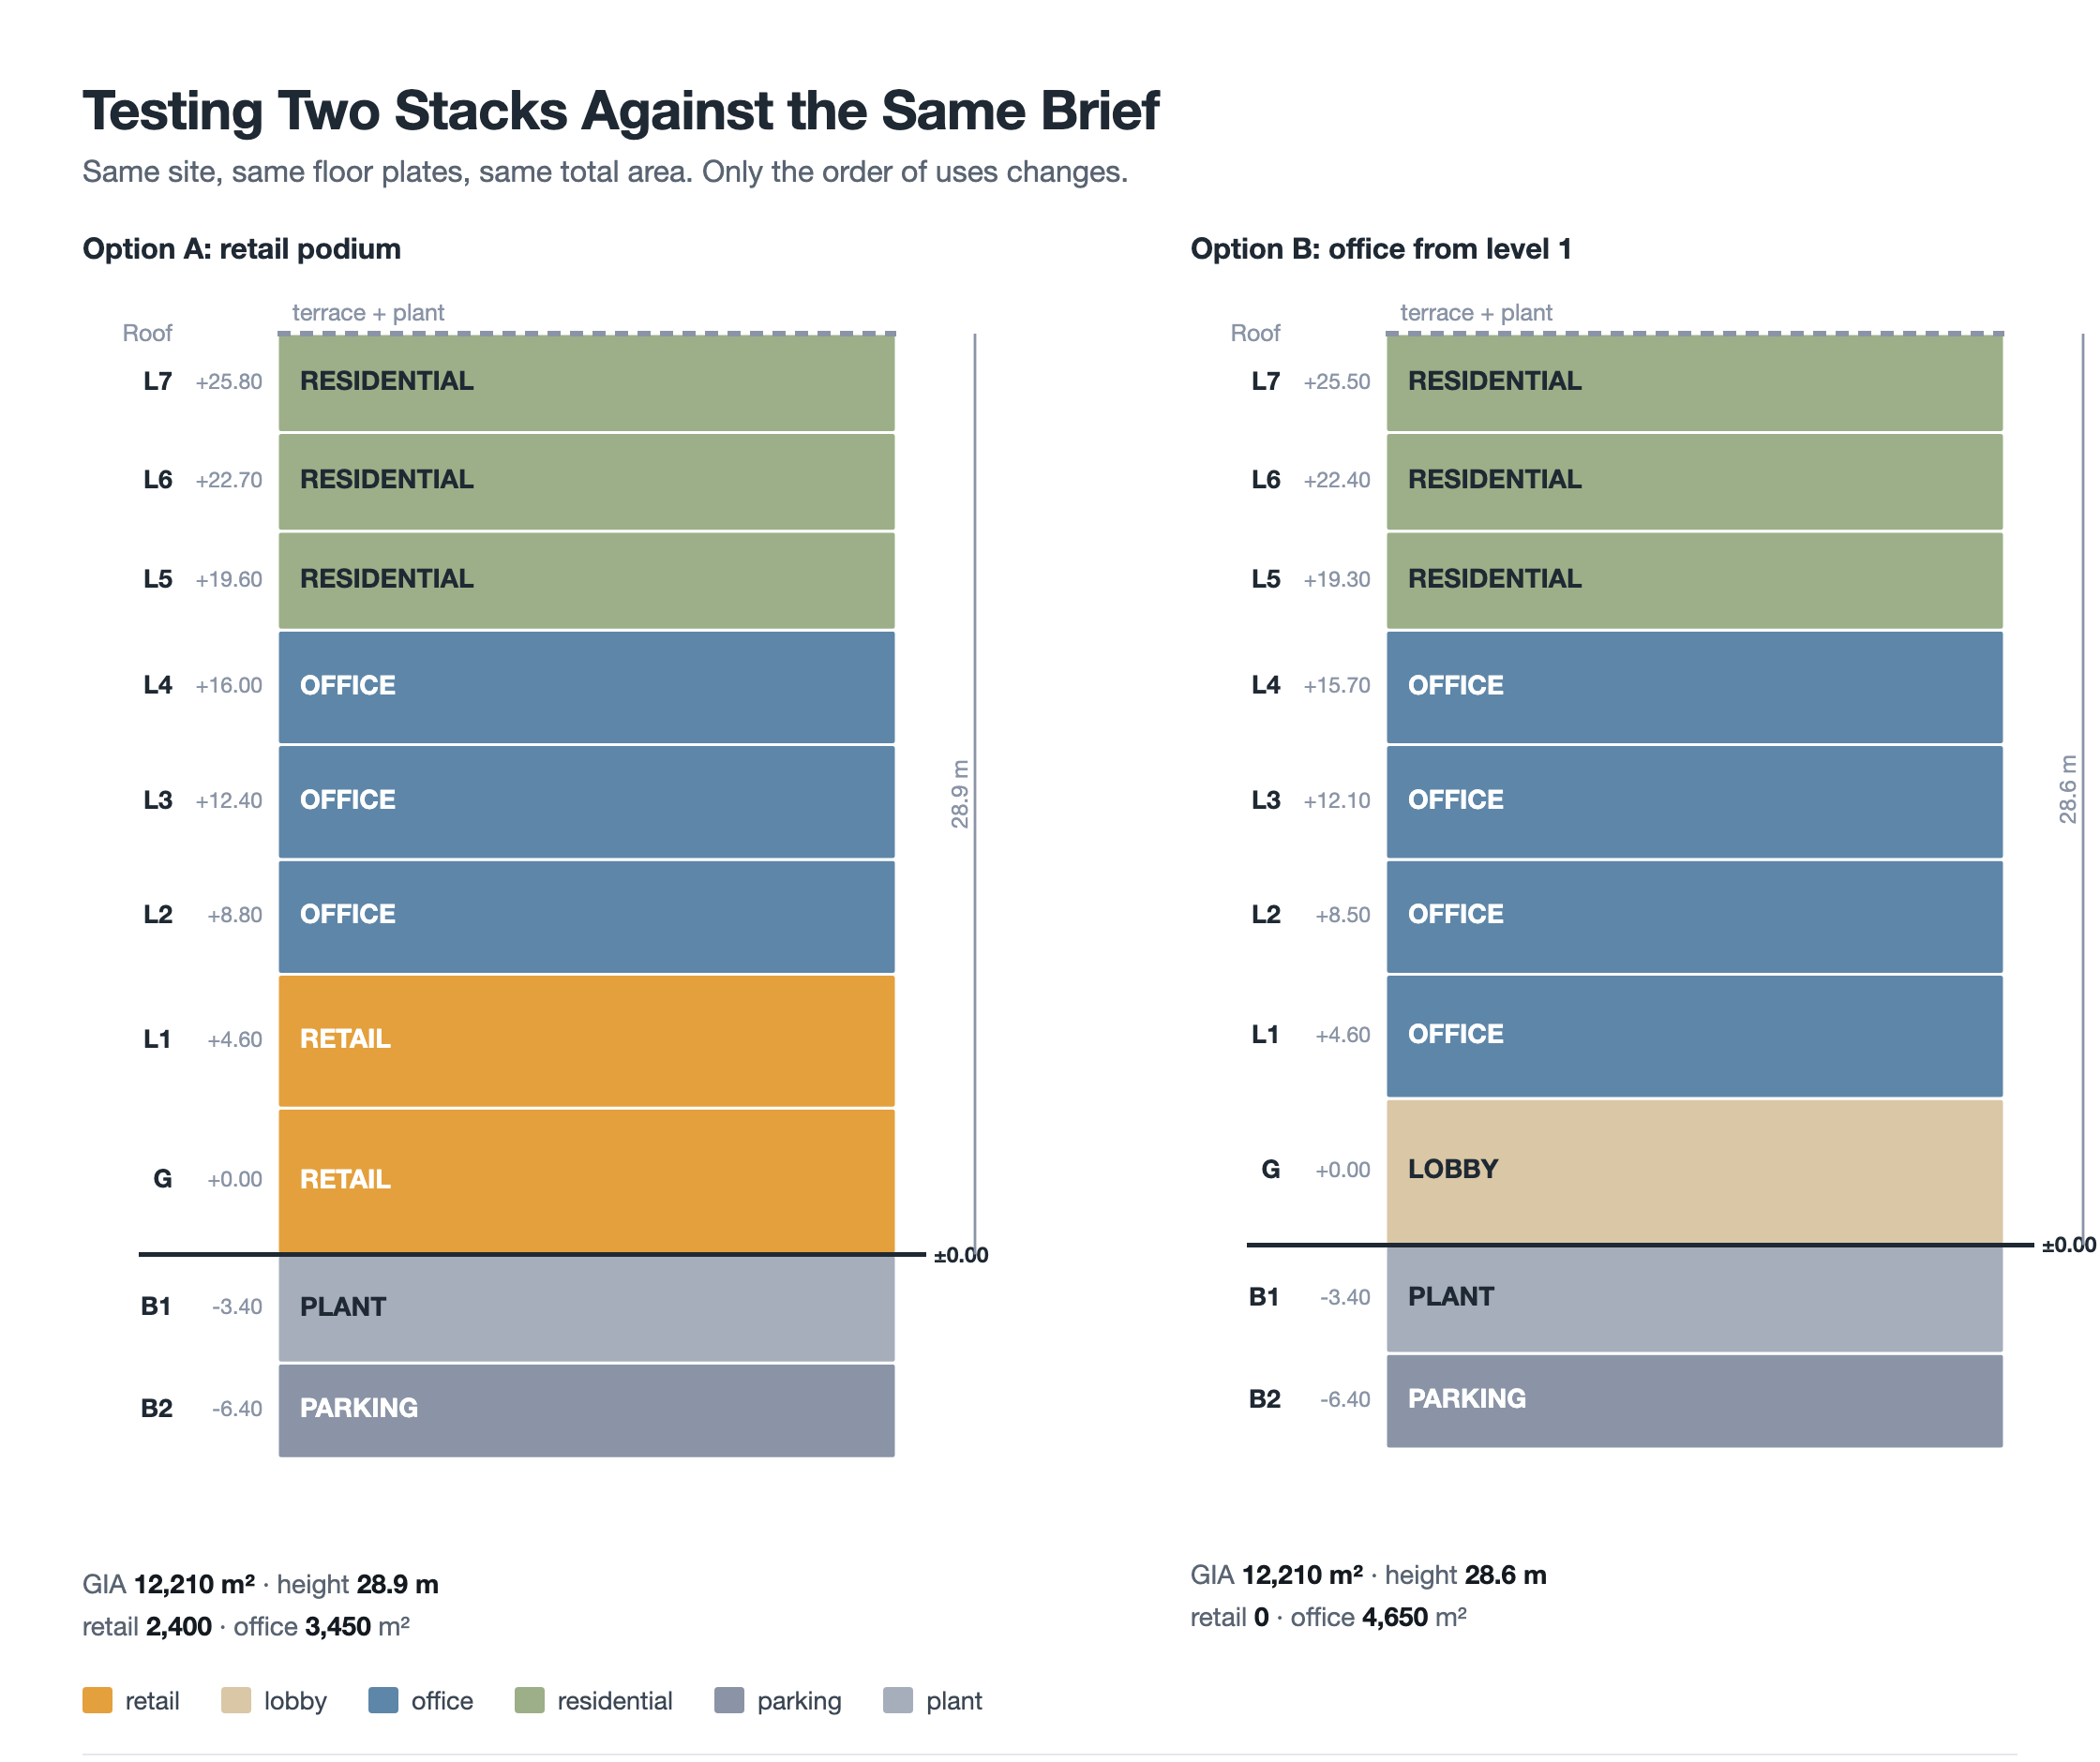
Two arrangements of one brief. The areas are identical and the heights differ by 0.3 m, so the comparison is entirely about what each option buys.
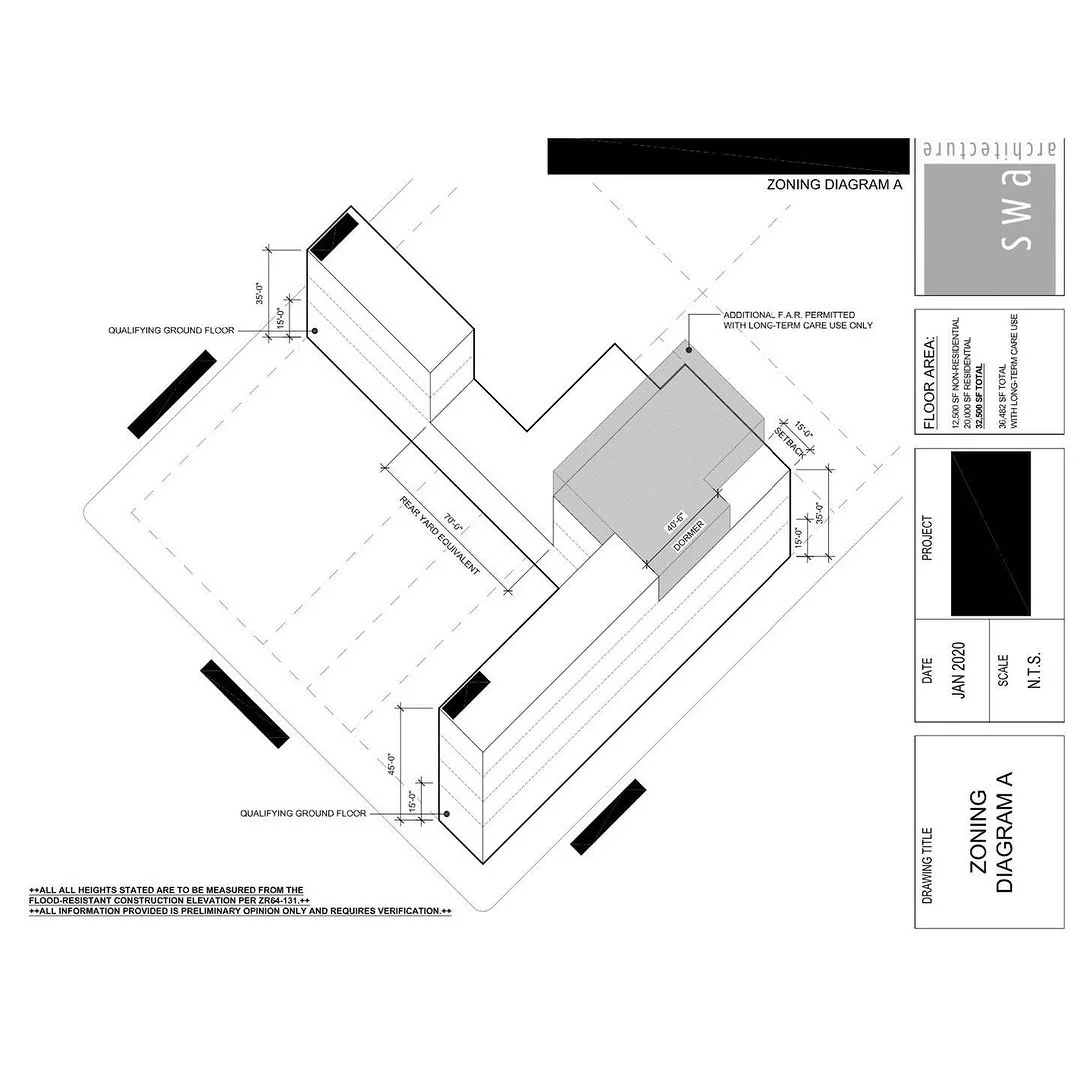
Option A puts retail on the ground and first floors. Option B takes the retail out and pushes office down to level one. Both land on 12,210 m², and the height difference is three hundred millimetres. What actually separates them is that A buys an active street frontage and B buys 1,200 m² more office, and the diagram lets a client see that trade in about five seconds.
Since the two options carry the same area, they can also be tested against the same site constraints without redrawing anything. That is the argument for producing three or four stacks early rather than one, and it is why the drawing sits so naturally in early RIBA Plan of Work stages, alongside the brief rather than after it.
What Happens When a Height Limit Bites
Height limits are where a stacking diagram stops being descriptive and starts being useful. The scheme above stands 28.9 m above ground. Suppose the site carries a 26 m limit, so 2.9 m has to come out. Three moves are available, and the diagram prices all of them in a minute.
| Move | Height | Area lost | Under 26 m? |
|---|---|---|---|
| Trim offices to 3.3 m and retail level 1 to 3.6 m | 27.4 m | none | No |
| Trim flats to 2.9 m and offices to 3.4 m | 27.7 m | none | No |
| Lose one residential floor | 25.8 m | 980 m² | Yes |
The result is worth sitting with. Squeezing floor-to-floor heights across the whole building buys only 1.2 to 1.5 m, and it does so by pushing offices and flats to heights their occupants will notice. The 2.9 m only comes from losing a storey, and that costs 980 m² of the most valuable accommodation in the scheme.
That is a viability conversation, not a design one, and it is far better had at this stage than after a set of plans exists. Note also that the moves are specific to this stack: a scheme with more storeys has more heights to trim, and one with a deep plant floor may find its metres there instead.
The Check the Drawing Exists For
Colours and areas are the easy part. The reason a stacking diagram earns its place is that it is the first drawing where vertical continuity can be tested.
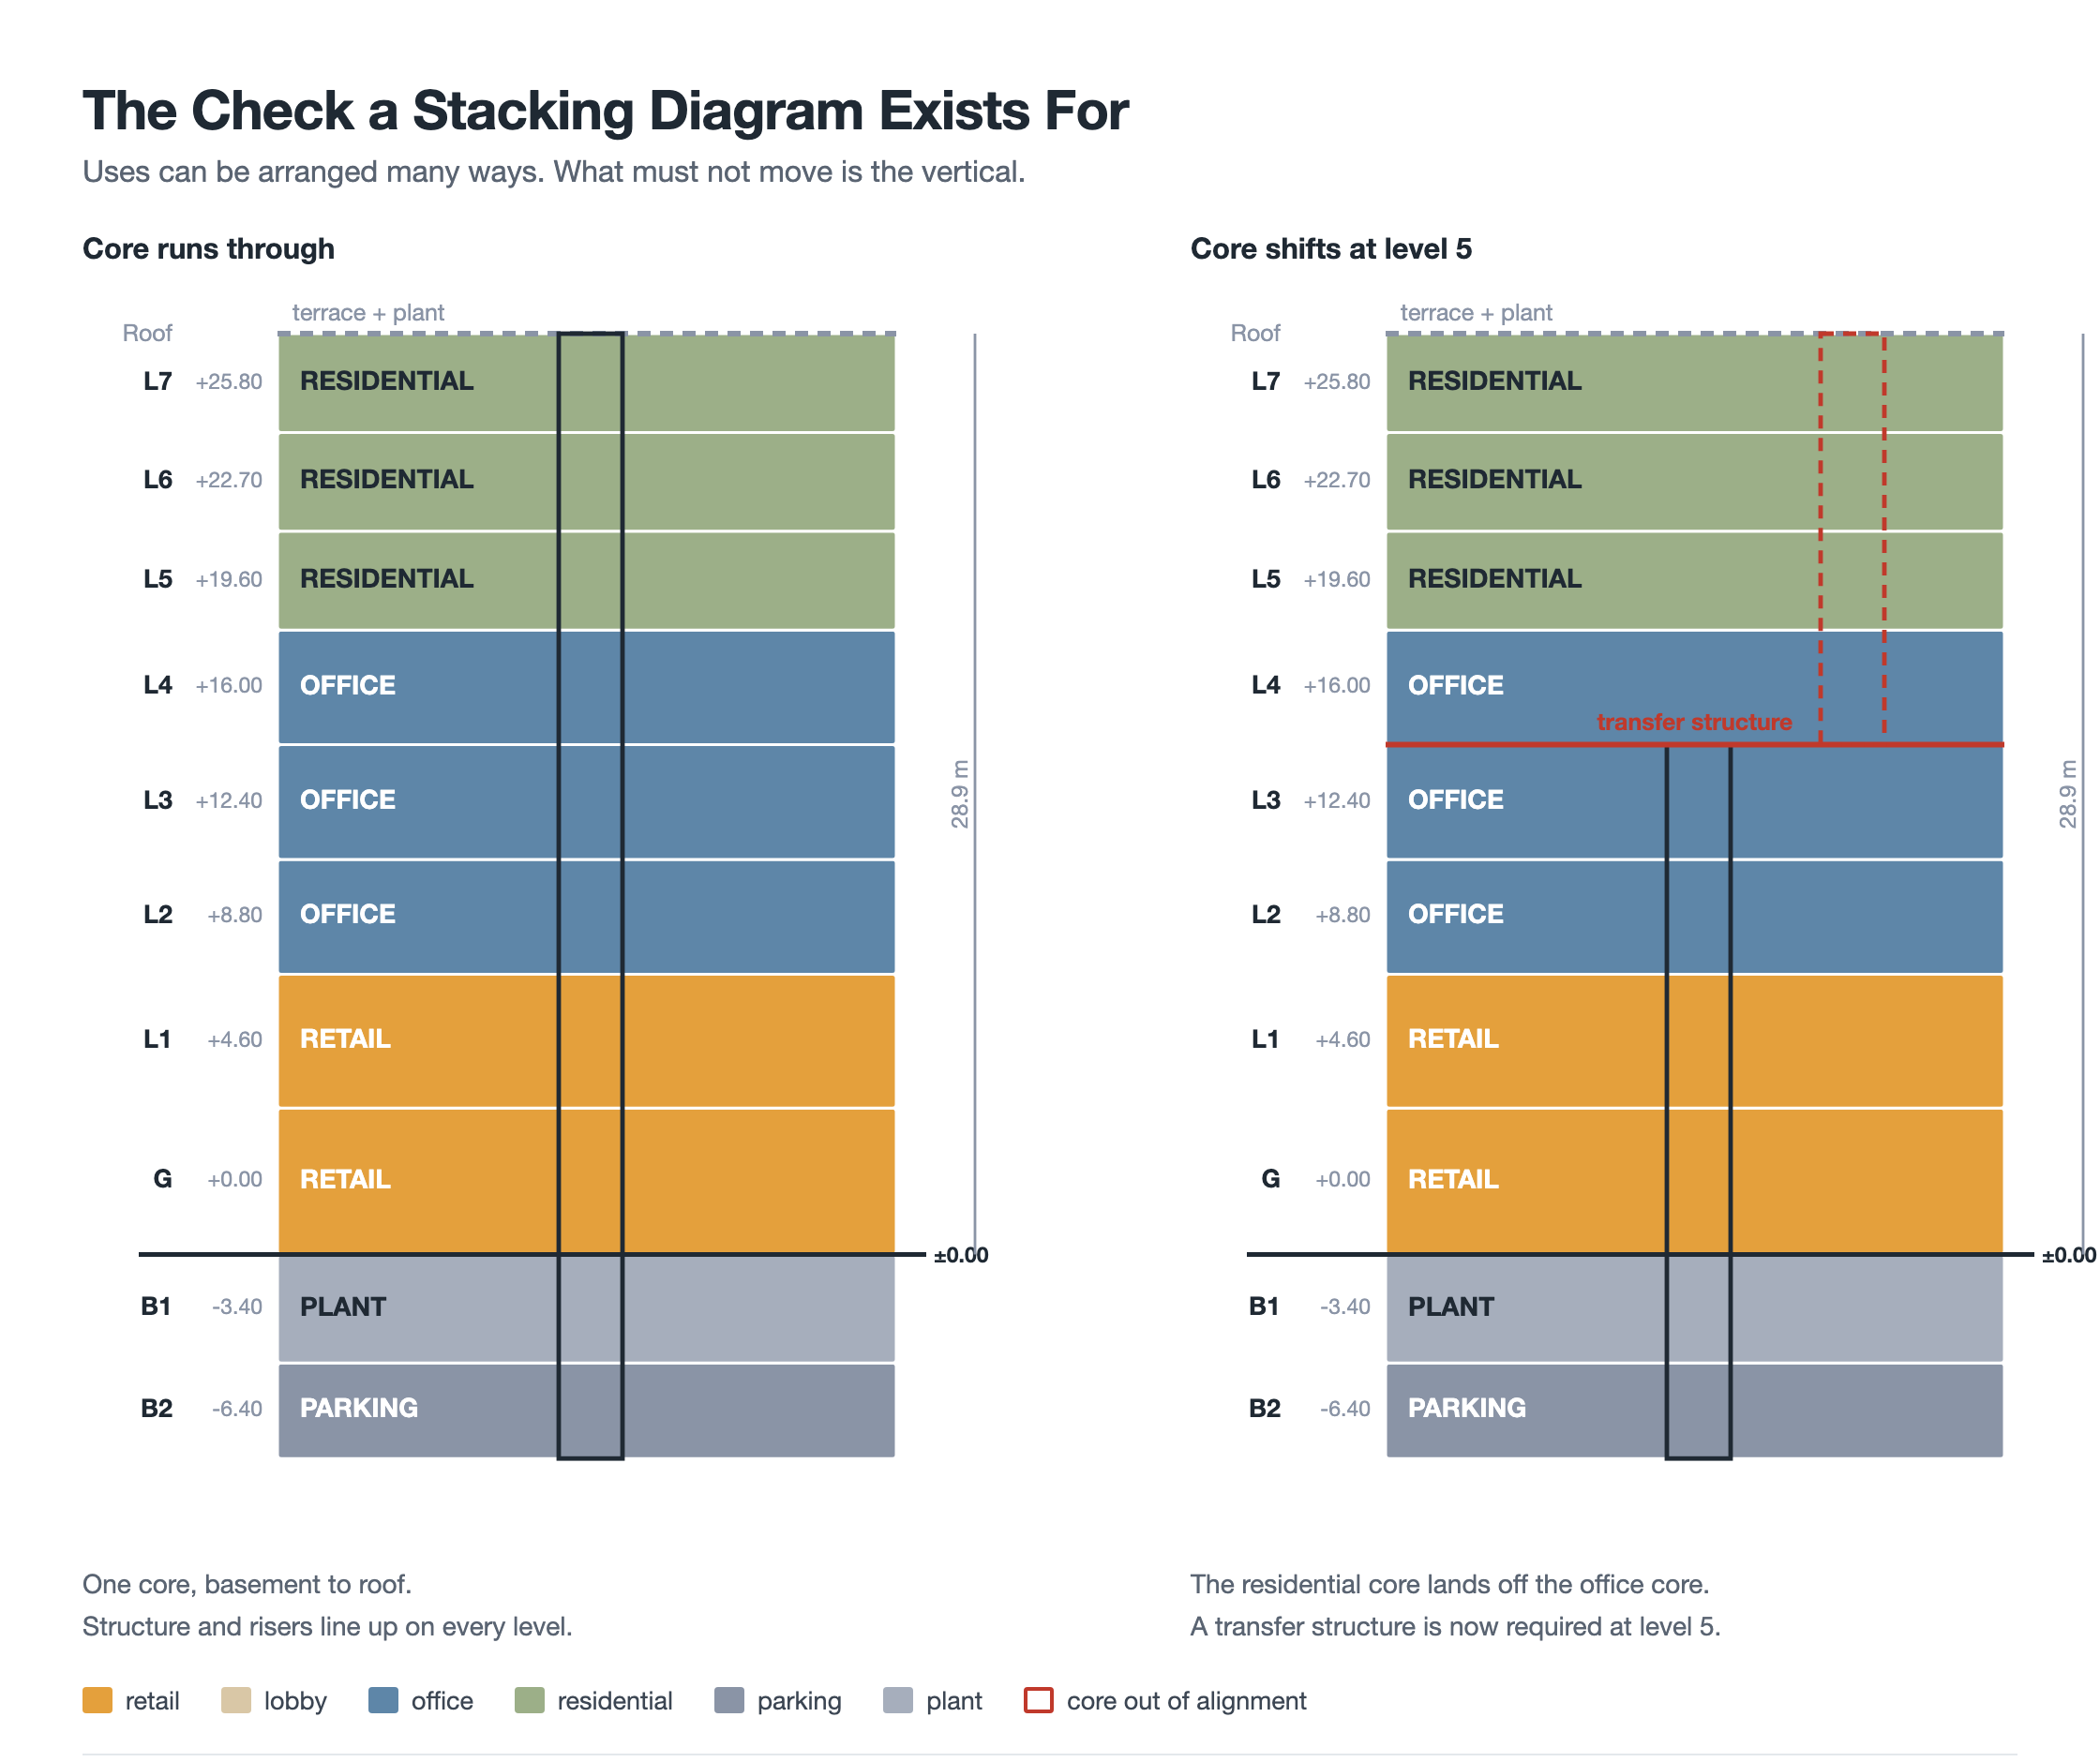
The same use arrangement drawn twice. On the right the residential core lands off the office core, and a transfer structure appears at level 5.
Three things want to run straight from the lowest basement to the roof: the core with its lifts and stairs, the structural grid, and the risers carrying services. Every time one of them moves sideways, something has to carry the load or the duct across, and transfer structures are expensive, deep, and awkward to hide.
The right-hand stack is not wrong so much as costly, and the cost was invented by a decision that took a second to make. Drawing the core on the stack is how that gets caught while it is still free to change. It also flags where two uses need separate cores entirely: residential above office almost always needs its own lift and its own entrance at ground, which is why option A carries two lobbies rather than one.
💡 Pro Tip
Build the stack in a spreadsheet before you draw it. One row per level with use, area and floor-to-floor height gives you total area and total height as formulas, so every option you test recalculates instead of being retyped. The drawing then becomes a picture of a schedule that is already correct, which is also how it stays correct when the brief moves.
How Does It Fit With the Other Diagrams?
A stacking diagram does not stand alone. It sits between the brief and the plan, and it hands work to both sides.


- The programmatic diagram supplies the areas it stacks.
- An adjacency matrix flags which uses must not sit next to each other, vertically included.
- The zoning diagram does the same grouping job in plan that the stack does in section.
- The massing diagram takes the height and floor plates from it and turns them into form.
Areas quoted on a stack should say which measurement basis they use, since gross internal area, net internal area and net lettable area can differ by a fifth of the building. The gross internal area definition and the RICS Code of Measuring Practice are the usual references for getting that consistent across a team.
⚠️ Common Mistake to Avoid
Stacking gross areas and calling the job done. A level that shows 1,150 m² gross does not offer 1,150 m² of usable space once the core, risers, walls and plant are taken out. If the brief is written in net area and the stack is drawn in gross, the scheme will look like it fits and then will not. Pick one basis, state it on the drawing, and apply an efficiency ratio deliberately rather than by accident.
Frequently Asked Questions
It is a vertical diagram that assigns each use in a brief to a level of the building. Every band is one floor, coloured by use and labelled with its area and floor-to-floor height, so the diagram gives both the total floor area and the overall building height.
Early, as soon as the brief has areas attached and the building is known to have more than one storey. It belongs alongside the programmatic and bubble diagrams, before plans are developed, because it is cheap to redraw and expensive to change later.
A stacking diagram allocates uses to levels and gives areas and heights. A massing diagram takes those figures and studies the external form, setbacks and shadows. The stack decides what is inside; the massing decides what it looks like from outside.
Action Step
Take your current brief, put every space into a spreadsheet with an area and a floor-to-floor height, and stack it two different ways. Then draw the core through both. Whichever option keeps the core straight from basement to roof is usually the one worth developing, and you will have found that out on a page rather than on a structural engineer’s fee.
Related Guides







Figure-Ground Diagram: How to Draw and Read Urban Fabric
A figure-ground diagram reduces a city to built mass against open space....
Sinan Ozen7 Mins read
Sun Path Diagram: How to Read One and Use It in Design
A sun path diagram shows where the sun sits all year for...
Sinan Ozen8 Mins read
Matrix Diagram in Architecture: How to Map Space Adjacencies
A matrix diagram, or adjacency matrix, maps how every space in a...
Sinan Ozen8 Mins read

Shopping Mall Bubble Diagram: A Step by Step Retail Planning Guide
A practical guide to the shopping mall bubble diagram: placing anchors so...
 illustrarch Editoral Team8 Mins read


Leave a comment