

How to Read a Graphic Scale in Architecture and Engineering Drawings
Learn what a graphic scale is, how it differs from representative fractions and verbal scales, and how to read one accurately on architectural and engineering drawings. This guide covers bar scale components, common architectural graphic scale ratios like 1/8 inch equals 1 foot, step-by-step reading instructions, and mistakes to avoid when measuring from scaled plans.

Table of Contents Show
A graphic scale is a printed bar on a map, blueprint, or technical drawing that visually represents real-world distances. Unlike a written ratio such as 1:100, a graphic scale remains accurate even when a drawing is enlarged, reduced, or printed at a non-standard size. Architects, engineers, surveyors, and students rely on graphic scales to measure distances directly from plans without performing manual ratio calculations.
What Is a Graphic Scale?
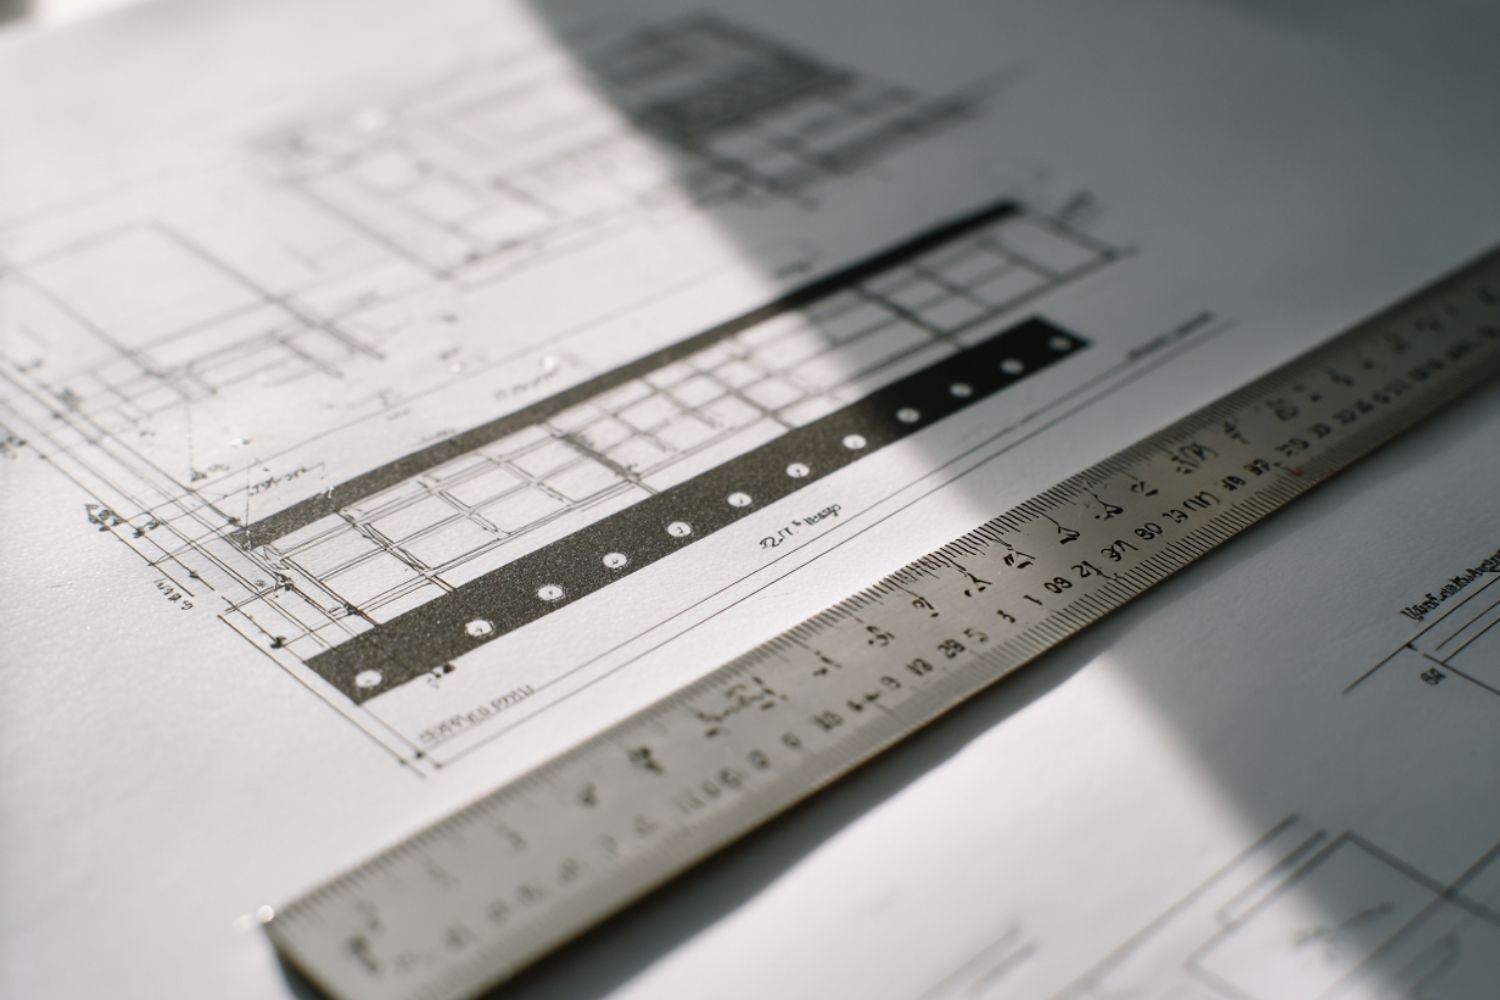
A graphic scale (also called a bar scale, linear scale, or scale bar) is a horizontal line segment divided into equal parts, each labeled with the real-world measurement it represents. You will find it near the bottom or corner of architectural plans, engineering drawings, site plans, and topographic maps. The concept is straightforward: place a ruler or a strip of paper against the bar, compare your measured distance on the drawing to the labeled divisions, and read off the actual dimension.
The term appears across several disciplines. Cartographers use graphic scales on USGS topographic sheets. Civil engineers include them on grading plans and road profiles. Architects add them to floor plans, elevations, and section drawings. Regardless of the field, the function is the same: translate a distance on paper into a distance in the physical world.
Three types of scale notation exist on technical drawings. A representative fraction (RF) such as 1:50 states that one unit on the drawing equals 50 of the same units in reality. A verbal scale writes out the relationship in words, for example “1 inch equals 10 feet.” A graphic scale shows the relationship visually as a marked bar. Of the three, the graphic scale is the only one that survives resizing. If someone photocopies a 1:100 plan at 75% reduction, the RF becomes inaccurate, but the bar shrinks proportionally with the drawing and still gives correct measurements.
💡 Pro Tip
Before you take any measurement from a printed plan, check the graphic scale first. Print a known dimension (like the scale bar itself) and verify it with a ruler. Office printers frequently default to “Fit to Page,” which silently changes the scale and makes the RF unreliable. The graphic scale tells you instantly whether the print is true to size.
Parts of a Graphic Scale Bar
A well-constructed graphic scale has four components. The primary divisions sit to the right of the zero mark, each representing a round number of real-world units (10 feet, 50 meters, 1 kilometer, etc.). The extension division sits to the left of zero and is subdivided into smaller increments for finer measurements. The unit labels identify the measurement system (feet, meters, miles). The alternating fills, usually black and white rectangles, make it easier to count divisions at a glance.
On architectural plans in the United States, graphic scales are commonly calibrated in feet. On metric drawings used across Europe, Asia, and most of the rest of the world, bars are labeled in meters or millimeters. Some site plans include two bars, one in metric and one in imperial, to serve international project teams. The Wikipedia entry on linear scales provides additional historical context on bar scale terminology, noting that the terms “bar scale,” “graphic scale,” and “graphical scale” have been used interchangeably since at least the 1960s.
How Does a Graphic Scale Differ from Other Scale Types?
Understanding the difference between these three scale formats helps you pick the right measurement approach for any drawing you encounter.
Comparison of Scale Types Used on Drawings
The table below outlines the key differences between graphic, representative fraction, and verbal scales:
| Feature | Graphic Scale | Representative Fraction (RF) | Verbal Scale |
|---|---|---|---|
| Format | Visual bar with divisions | Ratio (e.g., 1:100) | Written statement (e.g., 1 inch = 10 feet) |
| Survives resizing | Yes | No | No |
| Requires calculation | Minimal | Yes (multiplication) | Moderate |
| Best used on | Printed plans, maps, PDFs | CAD drawings at exact plot size | Written reports, specifications |
| Common in | Architecture, engineering, cartography | CAD output, technical standards | Educational materials, older maps |
The biggest advantage of a graphic scale is resilience. Construction sites often work with photocopied plan sets. A sheet that was printed at 85% still has a usable bar scale because the bar shrank along with the drawing. The RF on the same sheet, however, will give wrong numbers unless someone recalculates the new ratio.
Common Architectural Graphic Scale Ratios
Architectural drawings in the United States use fractional inch notation. The most frequently seen scales are 1/4″ = 1′-0″ (scale factor 48), 1/8″ = 1′-0″ (scale factor 96), and 3/16″ = 1′-0″ (scale factor 64). An architectural graphic scale 1/8 bar, for instance, shows that every eighth of an inch measured on the paper equals one foot in the real building. These ratios appear on floor plans, reflected ceiling plans, and interior elevations produced in software like Autodesk Revit or AutoCAD.
Metric architectural scales work differently. A 1:50 scale means 1 centimeter on paper equals 50 centimeters (0.5 meters) in reality. A 1:100 bar divides each centimeter into one-meter real-world increments. Site plans often use 1:200 or 1:500, while detail drawings jump to 1:5 or 1:10 for wall sections and connection details. If you need to convert between architectural and engineering scale systems, the free online scale converter on illustrarch.com handles both metric and imperial inputs.
📐 Technical Note
Standard architectural scales in the U.S. follow the conventions defined in the National CAD Standard (NCS), which references ANSI/ASME Y14.1. Common plan scales include 1/8″ = 1′-0″ for floor plans of large buildings, 1/4″ = 1′-0″ for residential floor plans and building sections, and 3/4″ = 1′-0″ or larger for detail drawings. Metric equivalents align with ISO 5455, which specifies preferred scales of 1:1, 1:2, 1:5, 1:10, 1:20, 1:50, 1:100, 1:200, 1:500, and 1:1000.
How to Read a Graphic Scale: Step-by-Step
Reading a graphic scale accurately takes practice, but the process itself is simple. Follow these steps on any architectural or engineering drawing.
First, locate the scale bar on the sheet. It is usually placed in the title block area at the bottom right or along the bottom edge. Some firms place a small bar scale directly beneath each individual plan view when multiple scales appear on a single sheet.
Second, confirm the units. Check whether the bar is marked in feet, meters, or another unit. Mixing up feet and meters is a surprisingly common source of error, especially on international projects.
Third, use a straight edge (a strip of paper, a ruler, or a pair of dividers) to mark the two points on the drawing between which you want to measure. Transfer that distance to the scale bar. If the distance is shorter than the full bar, read the measurement directly from the labeled divisions. If your marked distance extends beyond the bar, walk the strip along the bar in segments and add the totals.
Fourth, for distances that fall between two labeled divisions, use the extension division to the left of zero. This finer subdivision lets you estimate fractions of the main unit. On a bar labeled in 10-foot increments, the extension division might be split into 2-foot segments, giving you a reading like 32 feet instead of “somewhere between 30 and 40.”
For a deeper look at how architects use scale rulers alongside graphic bars, see the complete guide to architectural scales and drawings on illustrarch.com.
⚠️ Common Mistake to Avoid
Do not measure directly with a standard ruler and then multiply by the RF if the drawing has been resized. This is one of the most frequent errors on construction sites. Always measure against the printed graphic scale bar on the same sheet. If no bar scale is present and you suspect the sheet has been resized, measure a known dimension (a labeled wall length, for example) with your scale ruler to verify the actual print ratio before taking any other measurements.
Graphic Scale Example: Reading a 1/4″ = 1′-0″ Bar

Suppose you have a residential floor plan printed with an architectural graphic scale set at 1/4″ = 1′-0″. The bar on the drawing shows a series of alternating black-and-white blocks. The first full block to the right of the zero mark represents 4 feet. The next block adds another 4 feet, totaling 8 feet, and so on up to 20 feet. To the left of zero, a smaller block is subdivided into 1-foot increments.
To measure the width of a room, place a strip of paper against the two wall lines and mark both ends. Lay that strip along the bar. If the right mark lands on the “12” label and the left mark extends 2 small subdivisions into the extension division, the room width is 14 feet. No calculator needed.
This same logic applies to engineering drawings at any ratio. A civil site plan at 1″ = 40′ will have a bar where each inch represents 40 feet. A topographic map at 1:24,000 will have a bar scaled in miles or kilometers. The reading technique stays the same regardless of the units or the discipline.
🎓 Expert Insight
“Many such drawings do not have a linear scale and are marked ‘Do Not Scale Drawing’ in recognition of the fact that paper size changes with environmental changes.” — American Practical Navigator (Bowditch), NIMA Publication
This warning, found on many professional construction documents, highlights exactly why graphic scales exist. When a drawing carries the note “Do Not Scale,” it means the printed dimensions may not match any stated ratio. A graphic scale, when present alongside that note, gives you a secondary verification tool for approximate field measurements.
Why Graphic Scales Matter for Architects and Engineers
Drawings move through many hands during a project. An architect creates a plan in Revit at 1:100. The structural engineer prints it on A1 paper. The contractor photocopies it onto A3 for the site office. The building inspector views a PDF on a tablet. At each stage, the printed or displayed size may change. A graphic scale that travels with the drawing gives every person in that chain a way to verify measurements independently.
Digital workflows have not eliminated this problem. PDF viewers often display documents at “Fit Width” or a custom zoom level that does not correspond to any standard print scale. A graphic scale visible within the PDF lets the viewer calibrate their on-screen measuring tool (available in Adobe Acrobat and Bluebeam Revu) against the bar before taking dimensions.
Graphic scales also appear on architectural drawing symbol sheets, where they sit alongside north arrows, section markers, and level indicators as required elements of a professionally complete drawing set. Missing a scale bar on a construction document is considered a drafting error in most firms and can lead to requests for information (RFIs) during construction.
How to Draw a Graphic Scale for Your Own Plans
If you produce drawings by hand or in software that does not auto-generate a bar scale, you can construct one yourself. Start by deciding the real-world length the bar should represent. For a 1:100 floor plan, a bar showing 0 to 10 meters works well. Draw a horizontal line 10 centimeters long (since at 1:100, 10 cm on paper = 10 m in reality). Divide it into five equal 2-centimeter segments, each representing 2 meters. Add an extension division at the left end by splitting the first segment into four 0.5-centimeter parts, each representing 0.5 meters.
Fill alternate segments with black to create the checkerboard pattern that makes the bar easy to read. Label the zero point, the primary divisions (2, 4, 6, 8, 10 m), and the extension subdivisions. Finally, add the unit label “meters” and the scale notation “Scale 1:100” adjacent to the bar.
CAD programs like AutoCAD, Revit, and ArchiCAD include dynamic scale bar blocks that resize automatically when you change the viewport scale. In AutoCAD, the standard scale bar block is found in the DesignCenter under “Architectural” sample blocks. Revit generates scale bars in sheet views through the Annotations tab. Learning to produce and place these correctly is part of any architect’s plan creation workflow.
💡 Pro Tip
When you plot drawings from CAD, always print a test page and physically measure the graphic scale bar with a ruler. If one inch on the bar does not measure one inch on the paper, your printer driver is applying a scaling factor. Adjust the print settings to “Actual Size” or “100%” before printing the full set. This single check can prevent weeks of measurement disputes on site.
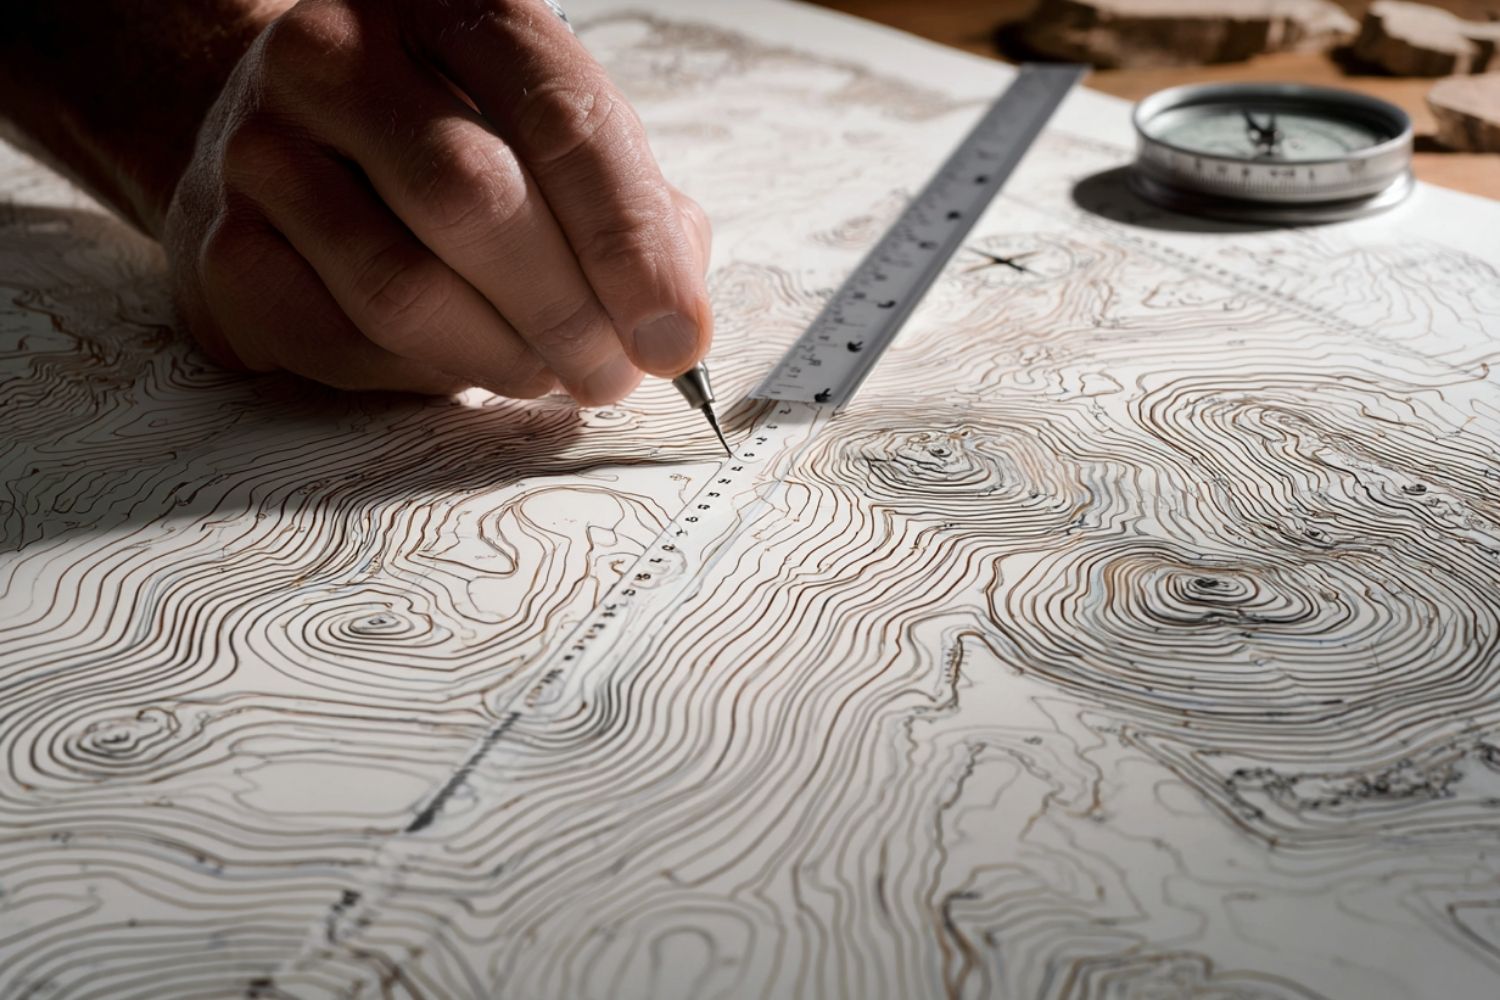
Using Graphic Scales on Maps and Site Plans
Graphic scales are standard on maps produced by national mapping agencies such as the U.S. Geological Survey (USGS). A typical USGS 7.5-minute quadrangle at 1:24,000 includes three bar scales: one in miles, one in feet, and one in kilometers. This triple bar lets users work in whichever unit is most convenient for their task.
On architectural site plans, the graphic scale helps verify setback distances, property line lengths, and building footprint dimensions. Because site plans cover larger areas than floor plans, they often use smaller scales (1:200, 1:500, or 1″ = 20′). The bar is proportionally longer on these sheets to accommodate the larger real-world distances.
GIS software such as ArcGIS Pro can insert dynamic scale bars into map layouts that update automatically when the map scale changes. This feature prevents the mismatch that occurs when a cartographer adjusts the zoom level but forgets to update a static bar.
For context on how architectural plans and site drawings are structured, the architecture floor plan guide on illustrarch.com covers scale notation, cut heights, and reading techniques in detail.
📌 Did You Know?
The earliest known use of a graphic scale on a map dates back to Chinese cartography in the Song Dynasty (960 to 1279 CE). The “Yu Ji Tu” (Map of the Tracks of Yu), carved on stone in 1137 CE, used a grid system that functioned as a graphic scale, with each grid square representing 100 li (approximately 50 kilometers). This was centuries before European cartographers adopted similar techniques.
Video: How to Draw a Graphic Scale
This short video from the ISPIRARE channel walks through the analog process of constructing a graphic scale by hand, a useful skill for anyone producing hand-drafted architectural presentations.
Graphic Scales in Digital and PDF Workflows
Modern architectural practice increasingly relies on digital plan distribution. Contractors open PDF files on tablets, laptops, and large-format screens. In this context, the graphic scale serves a calibration function. Tools like Bluebeam Revu and Adobe Acrobat Pro allow users to “calibrate” the PDF scale by clicking two points on the graphic scale bar and entering the known distance. After calibration, the software’s measurement tool returns accurate dimensions anywhere on the sheet.
Without a graphic scale on the PDF, calibration relies on finding a labeled dimension somewhere on the drawing. That works, but it adds a step and introduces potential error if the user picks a foreshortened or angled dimension line. A clearly placed bar scale eliminates this guesswork.
Building Information Modeling (BIM) platforms like Revit automatically include graphic scales in sheet views. When exporting to PDF, these scales transfer correctly as vector elements that remain sharp at any zoom level. If your firm exports DWG files to PDF through a third-party converter, double-check that the scale bar’s proportions survived the conversion by measuring it against a ruler after printing a sample sheet.
Understanding how scale notation integrates with other drawing conventions is a core part of reading construction documents. The guide to common architectural symbols on illustrarch.com covers dimension lines, section markers, and other annotations that work alongside the graphic scale to communicate building dimensions.
✅ Key Takeaways
- A graphic scale is a visual bar that represents real-world distances on a drawing, and it remains accurate even when the drawing is resized or printed at a non-standard size.
- Unlike representative fractions (1:100) or verbal scales, a graphic scale shrinks and grows proportionally with the drawing, making it the most reliable scale type for printed and digital plans.
- To read a graphic scale, mark the distance between two points on the drawing with a strip of paper, then compare that length against the labeled divisions on the bar.
- Common architectural graphic scales in the U.S. include 1/8″ = 1′-0″ and 1/4″ = 1′-0″, while metric drawings typically use 1:50, 1:100, or 1:200 bar scales.
- Always verify the graphic scale bar with a physical ruler after printing. Printer scaling errors are one of the most common causes of measurement mistakes on construction sites.
FAQ
What is a graphic scale in simple terms?
A graphic scale is a small ruler printed on a map or drawing that shows how distances on the paper correspond to actual distances in the real world. It looks like a horizontal bar divided into labeled segments. You measure a distance on the drawing, compare it to the bar, and read the real-world measurement directly.
What is the difference between a graphic scale and a fractional scale?
A fractional scale (also called a representative fraction) expresses scale as a ratio, such as 1:100. It is only accurate if the drawing is printed or displayed at the exact intended size. A graphic scale, on the other hand, is a visual bar that changes size along with the drawing, so it stays accurate even after photocopying or resizing.
How do you read an architectural graphic scale of 1/8 inch equals 1 foot?
On a drawing with an architectural graphic scale 1/8″ = 1′-0″, every eighth of an inch on paper represents one foot in reality. The bar on the drawing will show divisions where each small segment equals one foot. Place a strip of paper between two points on the plan, transfer it to the bar, and count the foot divisions to get the actual distance.
Why do some drawings say “Do Not Scale”?
The note “Do Not Scale Drawing” warns that the printed document may not match the stated ratio due to paper expansion, contraction, or reproduction at a different size. Professionals should rely only on written dimensions shown on the drawing. When a graphic scale is present alongside this note, it provides an approximate measurement tool, but labeled dimensions always take priority.
Can I use a graphic scale on a digital PDF?
Yes. PDF viewers like Bluebeam Revu and Adobe Acrobat Pro include calibration tools that let you click two points on the graphic scale bar and enter the known distance. Once calibrated, the software’s measurement tool returns accurate dimensions anywhere on the sheet. This is one of the most practical uses of a graphic scale in current practice.
Measurements taken from graphic scales on printed documents are approximations. For construction-critical dimensions, always refer to the written dimensions on the drawing and consult the project architect or engineer.


Why Submittals Get Rejected More Often Than PMs Expect
Architects spend years learning how to specify correctly. The specifications they produce...

Turning Vacation Snapshots Into Cinematic Travel Blog Headers With Nano Banana
I have been running a small travel blog for about six years...

Where Do Famous Architects Live? Houses Behind the Masters
From Le Corbusier's Paris penthouse to Bjarke Ingels' floating home in Copenhagen,...

Is Your Business Actually Ready for AI? Here Is How to Find Out
Table of Contents Show Clear Processes Matter More Than New ToolsData Quality...

Leave a comment