

Bubble Diagram School Design: A Step by Step Guide for Educational Buildings
A practical look at bubble diagram school design for educational buildings. It covers functional zones, adjacency priorities, acoustic separation, a step by step method, and the free tools architects and students use to plan classrooms and campuses.

Table of Contents Show
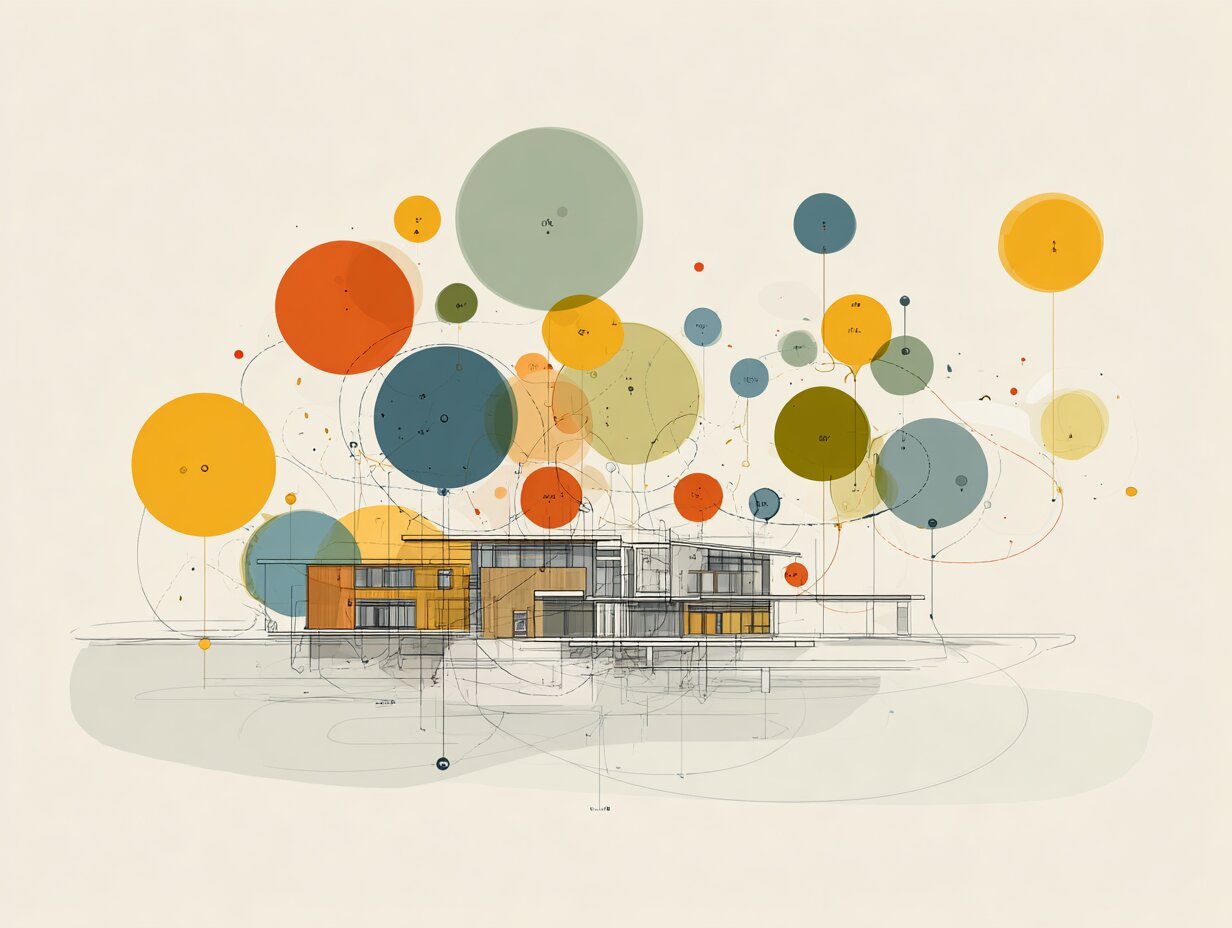
Bubble diagram school design is the early planning method architects use to map classrooms, laboratories, libraries, and circulation as simple connected circles before any floor plan exists. It clarifies which spaces should sit together, which need separation for noise or safety, and how students and staff move through the building.
Designing a school or university is mostly a question of organization. You are handling dozens of rooms with different sizes, noise levels, and access needs, and the wrong arrangement can make a building feel confusing for years. A bubble diagram lets you test that organization in minutes, using nothing but circles and lines. This guide walks through how to build one specifically for educational buildings, from listing your spaces to handing off a clear concept for the floor plan.
What Is a Bubble Diagram in School Design?

A bubble diagram in school design is a freehand schematic where each circle, or bubble, stands for a space such as a classroom, lab, gym, or office, and lines between bubbles show how those spaces relate. Bigger bubbles mean larger or more important rooms, and the distance between bubbles signals how closely they should be connected. There are no exact dimensions yet, which is the point. You are testing relationships, not committing to walls.
This sits at the very start of the design process, after you have a program (the list of required spaces and their areas) but before schematic plans. If you want the broader background first, our overview of the bubble diagram in architecture explains where the method came from and how it differs from other diagram types. For a focused look at the technique itself, archisoup covers architecture bubble diagram fundamentals in detail.
📌 Did You Know?
The habit of sketching spaces before form predates bubble diagrams by more than a century. Nineteenth-century Beaux-Arts students in Paris were trained to produce a rapid esquisse, a quick compositional sketch, before any detailed drawing. That same logic of testing spatial organization first still shapes how architecture schools teach planning today.
Why Bubble Diagrams Matter for Schools and Universities

Educational buildings are harder to organize than most building types. A primary school packs noisy play areas next to focused learning rooms. A university stacks lecture halls, research labs, studios, and social space into a single campus block. A bubble diagram gives you a fast way to spot conflicts before they become expensive.
Three benefits stand out for school work. First, it exposes noise and access problems early, so a music room never ends up sharing a wall with an exam hall. Second, it makes the design legible to non-architects, which matters when school boards, principals, and parents review the scheme. Third, it lets you run several layouts quickly, comparing a courtyard plan against a linear spine in the time it takes to redraw a few circles. Our guide on creating effective bubble diagrams shows how this iteration speed plays out across project types.
Many education authorities now expect this kind of spatial reasoning to be documented. The Whole Building Design Guide on educational facilities stresses that the physical building directly affects teaching outcomes, which is exactly the relationship a bubble diagram is built to study.
Core Spaces to Map in an Educational Bubble Diagram

Before you draw anything, break the program into zones. Schools and universities share a common structure, even when the scale differs. Grouping spaces by function keeps the diagram readable and stops you from drowning in individual room circles.
Primary teaching spaces
These are the rooms where instruction happens: general classrooms, lecture halls, science labs, art studios, and workshops. They usually take the largest share of floor area and often cluster by department or year group. Labs and studios sit slightly apart because they carry extra service needs like ventilation, water, and dust extraction.
Shared and support spaces
Libraries or learning commons, cafeterias, assembly halls, gymnasiums, and administration belong here. These get used by the whole building, so they want central or well-connected positions. A library works best as a quiet hub reachable from teaching wings, while a sports hall needs its own entrance for evening and community use.
Circulation and service zones
Corridors, stairs, lobbies, restrooms, storage, and mechanical rooms tie everything together. In educational buildings, circulation is rarely just leftover space. It often doubles as social area, so the bubbles for halls and atria deserve real attention rather than being squeezed in last.
💡 Pro Tip
Assign each zone a color before you start drawing, and add a small legend in the corner of the sheet. Teaching spaces in one color, shared spaces in another, service in a third. When you present the diagram to a school client, the color grouping reads instantly, and reviewers stop asking what each circle means and start commenting on the actual layout.
How to Make a Bubble Diagram for School Design Step by Step

With your zones defined, the drawing itself moves quickly. The steps below apply whether you sketch on tracing paper or use a digital tool. If you want a general version of this workflow for any building, our walkthrough on how to create bubble diagrams covers the basics, and the detailed bubble diagram design guide goes deeper into sizing and adjacency.
Step 1: List the program and group by zone
Write out every required space with its rough area, then sort that list into the teaching, shared, and service zones above. This is your raw material. A high school program might list 30 classrooms, 6 science labs, a library, a gym, a cafeteria, and an admin suite.
Step 2: Build an adjacency matrix
An adjacency matrix is a simple grid that records which spaces must be near each other, which can be apart, and which must be separated. Mark each pairing as essential, desirable, or to avoid. This step does the analytical work, so the bubble drawing becomes almost mechanical afterward.
Step 3: Draw and size the bubbles
Sketch a circle for each space or grouped zone. Make the size roughly proportional to floor area, so the gym is visibly larger than a single office. Do not aim for precision, just relative scale that communicates hierarchy at a glance.
Step 4: Connect bubbles to show relationships
Draw lines between bubbles that should connect, using your matrix as the rulebook. A heavier line can mean a strong, high-traffic link, a thinner line a weaker one. Place bubbles that must be adjacent close together and push conflicting ones apart on the page.
Step 5: Test and iterate
Step back and read the diagram as a building. Does the noisy gym sit far from quiet study? Is the library central? Can a visitor reach reception without crossing teaching wings? Redraw freely until the organization holds up. The cost of a redraw here is a few minutes, against weeks once you reach floor plans.
💡 Pro Tip
Build the adjacency matrix before you draw a single bubble. On larger school projects, designers who skip straight to circles tend to arrange spaces by instinct and miss conflicts. The matrix forces a yes or no decision on every pairing, so the diagram ends up reflecting analysis rather than first impressions.
Common Adjacency Patterns in Educational Buildings

Most schools and universities organize around a circulation spine that links teaching clusters to shared facilities. Certain pairings come up again and again, and knowing them speeds up your first draft. The table below summarizes the patterns that hold for the majority of education projects.
School Zone Adjacency Reference
| Zone | Place near | Keep separate from | Reason |
|---|---|---|---|
| Administration and reception | Main entrance, visitor parking | Quiet study areas | Controls visitor access and security |
| General classrooms | Same year or department, restrooms | Gym, music rooms, kitchen | Reduces noise transfer during lessons |
| Science and tech labs | Prep rooms, storage, services | Lecture-only classrooms | Needs ventilation, water, and gas lines |
| Library or learning commons | Central circulation, teaching wings | Sports halls, workshops | Protects a quiet, central study hub |
| Gymnasium or sports hall | Changing rooms, fields, own entrance | Classrooms, library | Isolates impact noise and after-hours use |
| Cafeteria and dining | Kitchen, assembly hall, outdoor space | Labs, quiet study | Manages deliveries, smells, and crowds |
Public agencies publish their own versions of these rules. The Massachusetts School Building Authority documents space adjacencies for assembly and break-out areas, and the NSW Department of Education’s Educational Facilities Standards and Guidelines set area allocations and learning-zone configurations that a bubble diagram should respect from the start.
⚠️ Common Mistake to Avoid
A frequent error is drawing every bubble the same size. Bubble area should signal relative floor area and importance, so a sports hall cannot look identical to a single office. When all the circles match, the diagram loses its ability to show hierarchy, and the floor plan that follows inherits unrealistic proportions that are painful to correct later.
Acoustic and Technical Constraints to Respect
School design carries technical requirements that quietly drive adjacency decisions. Noise is the big one. Where you place a gym or music suite relative to teaching rooms is not an aesthetic choice, it is a measurable performance issue your bubble diagram should anticipate.
📐 Technical Note
The American National Standard ANSI/ASA S12.60, published by the Acoustical Society of America, sets a maximum background noise level of 35 dBA for core learning spaces and recommends short reverberation times of around 0.6 to 0.7 seconds in typical classrooms. Mapping loud and quiet zones at the bubble stage makes these limits far easier to meet once the building takes form.
Daylight, ventilation, and accessibility add further pulls. Classrooms generally want exterior walls for natural light, which often pushes teaching bubbles to the building perimeter and leaves shared facilities in the core. Recognizing these forces early keeps your diagram honest rather than purely diagrammatic.
From Bubble Diagram to School Floor Plan
The diagram is a bridge, not a destination. Once the organization holds up, you start converting bubbles into real rooms. Replace each circle with a roughly scaled rectangle, keep the adjacencies you tested, and introduce a structural grid and corridor system. The relationships survive even as the shapes harden into walls.
This transition is where the early work pays off. A school designed from a tested bubble diagram tends to have logical wayfinding and sensible zoning, because those decisions were resolved before anyone drew a wall. For a built example of thoughtful educational zoning, the Louis-Saint-Laurent School by STGM Architectes shows how a central learning hub and clear circulation come together, and our piece on transforming education through architectural design looks at how spatial choices shape learning.
If you would rather build the diagram digitally, you can sketch one in minutes with our free bubble diagram maker, then export it as a reference for the schematic phase.
Frequently Asked Questions

What is a bubble diagram in school design?
It is a freehand schematic that represents each school space, such as a classroom, lab, or gym, as a circle, with lines showing how those spaces should connect. It is made at the start of design to test spatial organization before a floor plan is drawn, focusing on relationships rather than exact dimensions.
How many bubbles should a school bubble diagram have?
Group spaces by zone rather than drawing every individual room. A clear school diagram usually has somewhere between 10 and 25 bubbles, combining similar rooms like a classroom cluster into one circle. Too many bubbles make the diagram unreadable and defeat its purpose as a quick planning tool.
What is the difference between a bubble diagram and a floor plan?
A bubble diagram shows relationships without scale, structure, or exact shape, while a floor plan defines precise dimensions, walls, and room geometry. The bubble diagram comes first and informs the floor plan. Think of the diagram as the logic and the plan as the resolved building.
Can I make a bubble diagram for a university campus the same way?
Yes, though at campus scale each bubble often represents a whole building or department rather than a single room. The same steps apply: list the program, group by function, set adjacencies, and connect the bubbles. You simply work at a coarser grain and may produce a separate diagram for each major building.
What tools can I use to make a bubble diagram for school design?
Pen and tracing paper still work well for early sketches and remain popular in studios. For digital versions, dedicated online diagram makers let you drag, resize, and connect bubbles quickly, which is useful when you need to share or revise the layout with a school client.
Where to Go From Here
Your Next Step: Take the program for your current school or university project, sort every space into teaching, shared, and service zones, and build a simple adjacency matrix before you draw anything. That single grid will make your first bubble diagram far sharper, and the rest of the design will follow a clearer logic.


Understanding Architectural Functional Relationship Diagrams: A Practical Guide
Functional relationship diagrams are essential planning tools that architects use during the...

Massing Diagram Architecture: A Practical Guide to Building Form Studies
Massing diagrams are the first visual step in turning an architectural program...

Understanding Architectural Programmatic Diagrams: A Visual Guide
Discover how programmatic diagrams help architects visualize spatial relationships, circulation, and building...

Bubble Diagram for Hospital Design: Programming and Space Planning
Learn how to create a bubble diagram for hospital design that organizes...

Leave a comment