

Understanding Architectural Functional Relationship Diagrams: A Practical Guide
Functional relationship diagrams are essential planning tools that architects use during the programming and schematic design phases to map how spaces connect, interact, and serve building occupants. This guide covers diagram components, creation steps, real project applications, and tools architects use to build effective relationship diagrams that inform floor plan development.

Table of Contents Show
A functional relationship diagram in architecture is a visual planning tool that maps how different spaces within a building connect, overlap, or need separation based on their intended use. These diagrams translate a building’s program into a graphic format that architects, clients, and stakeholders can read at a glance, making them a critical step between written project requirements and the first schematic floor plan.

What Is a Functional Relationship Diagram?
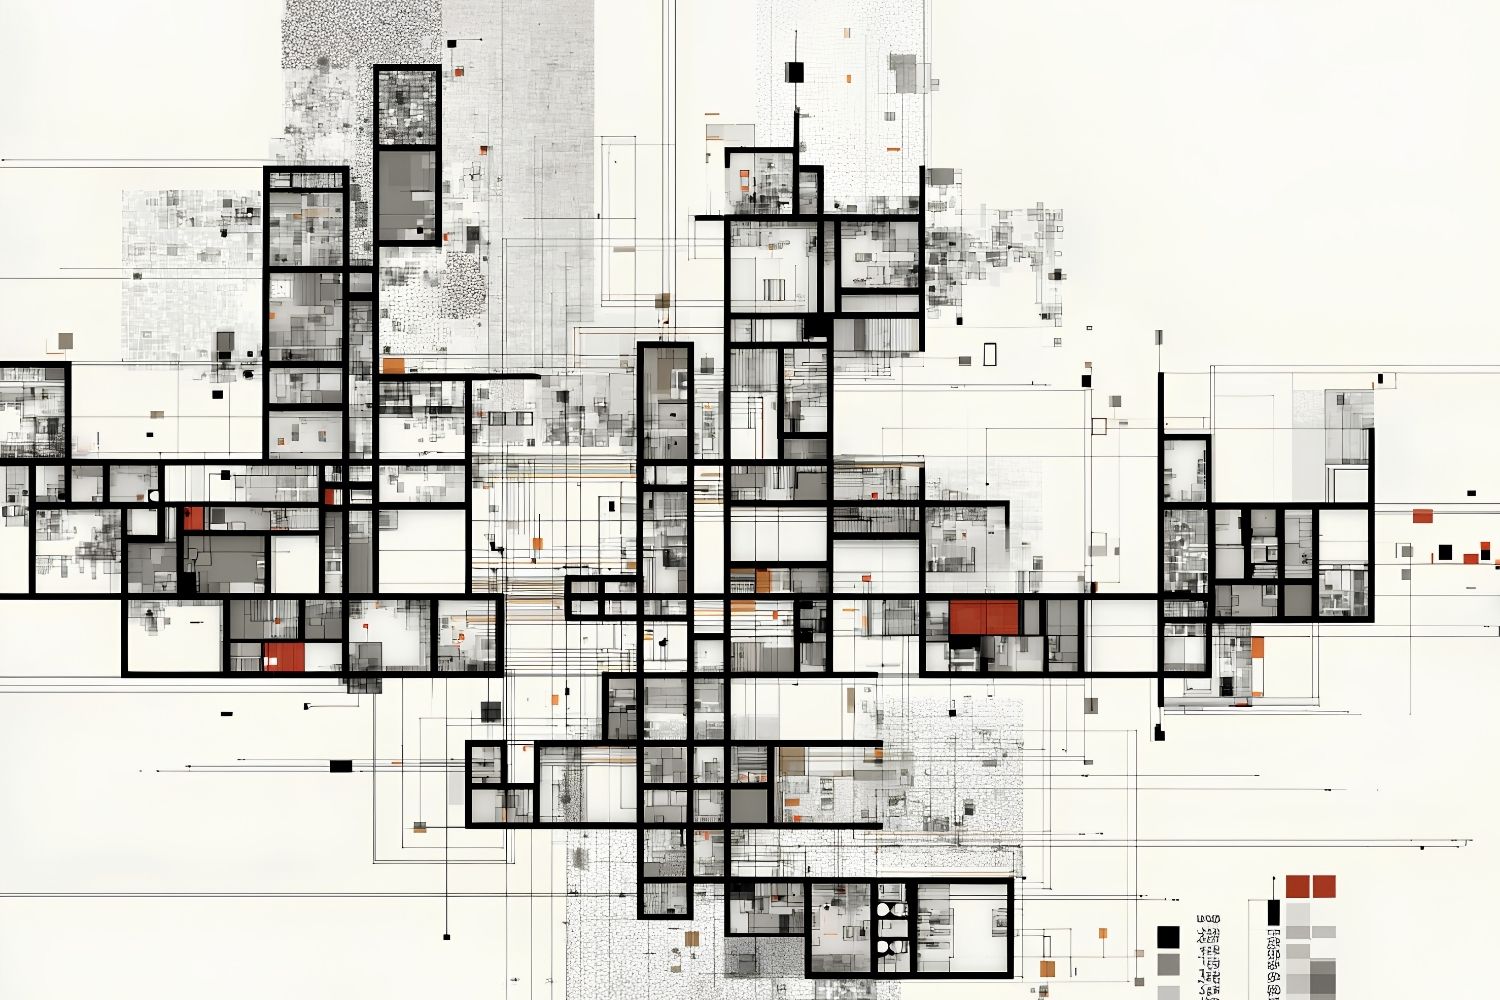
A functional relationship diagram is a schematic drawing that represents the connections between rooms, zones, and activity areas inside a building project. Rather than showing exact dimensions or wall locations, it uses abstract shapes and connecting lines to communicate which spaces should sit next to each other, which require direct access, and which need buffers or separation. The result is a map of spatial logic that guides every layout decision that follows.
Architects typically produce functional relationship diagrams during the programming and early schematic design phases. According to the American Institute of Architects (AIA), schematic design involves developing study drawings that illustrate spatial relationships, scale, and form for the owner to review. The functional relationship diagram is one of the first deliverables in that sequence.
These diagrams are closely related to bubble diagrams, but they carry more specific information. Where a bubble diagram might simply group spaces by size, a functional relationship diagram adds layers of detail: strength of connection, circulation requirements, privacy levels, and service access needs.
💡 Pro Tip
Explore more in our complete guide: read the full guide.
Before drawing any diagram, create an adjacency matrix first. List every room along both axes of a grid and rate each pair’s relationship as “essential,” “desirable,” or “undesirable.” This five-minute exercise prevents the most common diagramming mistake: placing spaces based on assumed relationships rather than verified programmatic needs.

Core Components of Architectural Functional Relationship Diagrams
Every functional relationship diagram in architecture shares a set of standard graphic elements. Understanding these components helps you read existing diagrams accurately and produce your own with clarity.
Nodes and Zones
Each space or function appears as a node, usually drawn as a circle, rectangle, or irregular shape. The node’s size often reflects the relative square footage or programmatic importance of that space. A hospital emergency department, for instance, would appear as a much larger node than a janitor’s closet. Nodes are labeled with the space name and sometimes include area requirements in square meters or square feet.
Related nodes are grouped into zones. A residential project might have three main zones: private (bedrooms, bathrooms), social (living room, dining room, kitchen), and service (laundry, storage, garage). Color-coding zones makes the diagram easier to scan. This zoning logic is explored in greater depth in architectural zoning diagrams.
Connection Lines and Relationship Strength
Lines drawn between nodes indicate that two spaces need a relationship. The visual weight of the line communicates how strong that relationship is. A thick solid line typically means a direct, essential connection (a kitchen must open directly to a dining room). A dashed line suggests a desirable but flexible connection. No line between two nodes means the spaces can function independently of each other.
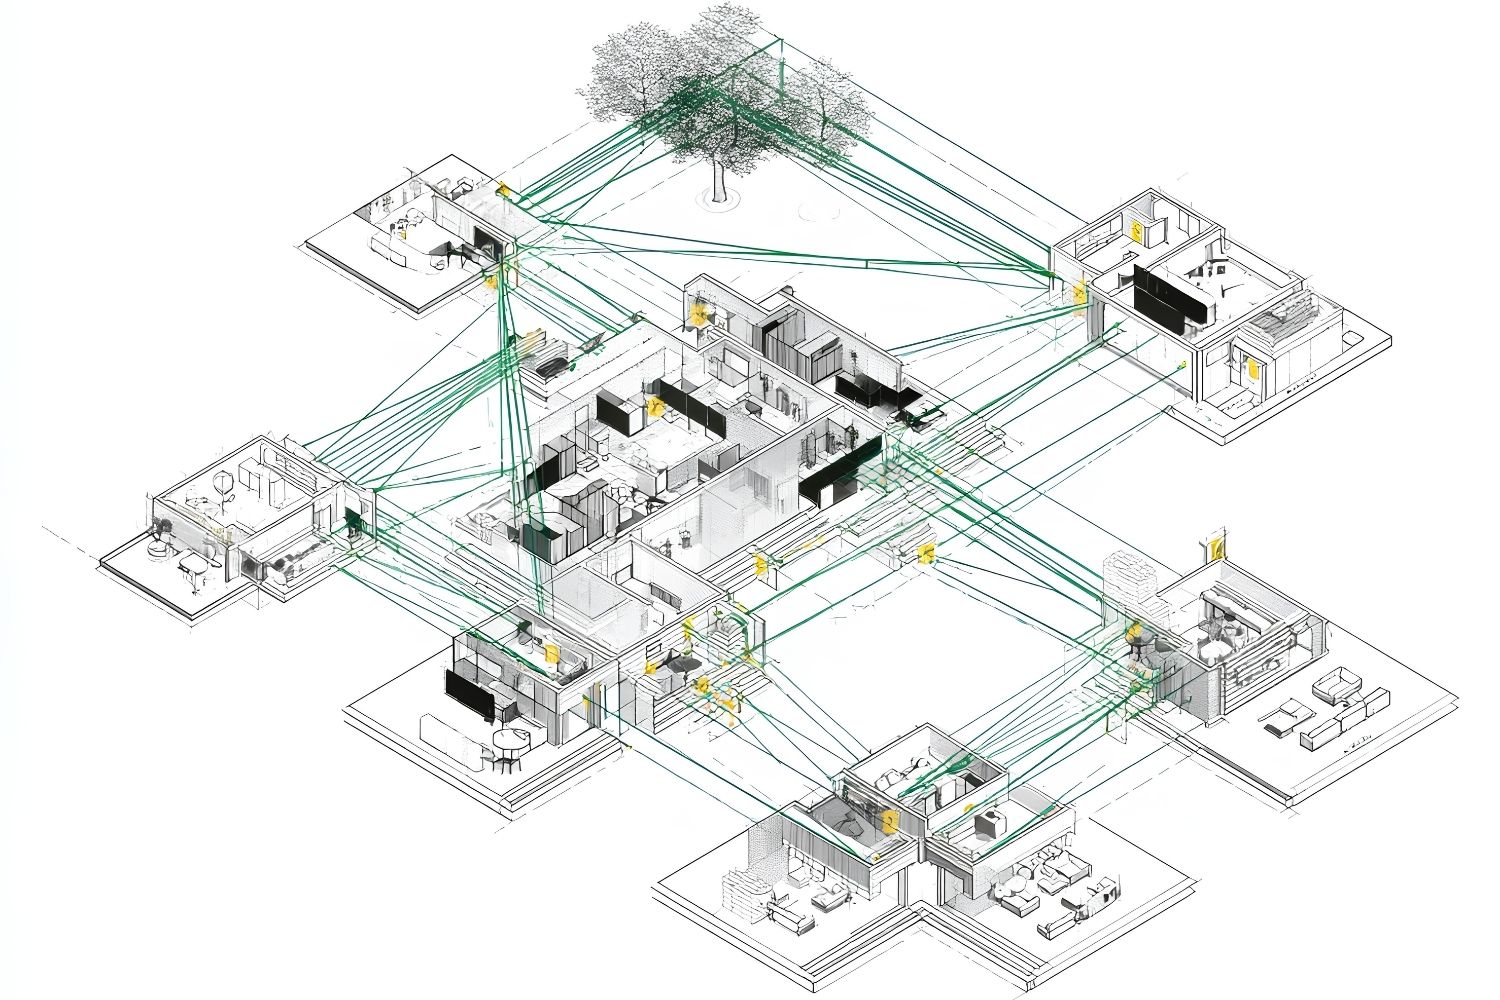
Some architects add arrows to show directional flow, especially for circulation-heavy projects like airports or hospitals. Others use color-coded lines to distinguish between different types of relationships: pedestrian circulation, service access, visual connection, or acoustic separation.

How to Create a Functional Relationship Diagram Step by Step
Building an effective architectural diagram requires a structured process. Jumping straight to drawing circles on paper without proper preparation usually produces a diagram that looks organized but fails to reflect real programmatic needs.
Step 1: Define the Building Program
Start by listing every space the project requires, along with its approximate area, occupancy, and primary function. The Whole Building Design Guide (WBDG) defines architectural programming as the research and decision-making process that identifies the scope of work to be designed. Your program list is the raw material for the diagram.
Step 2: Build an Adjacency Matrix
An adjacency matrix is a grid where you rate the relationship between every pair of spaces. Use a simple scale: 4 for essential adjacency, 3 for desirable, 2 for neutral, 1 for separation preferred. This matrix forces you to think about connections systematically rather than relying on assumptions. For a deeper look at how adjacency matrices feed into programme and functions diagrams, the process follows the same logic.
Step 3: Draft the Diagram
Place your highest-traffic or most-connected space at the center and arrange other nodes around it based on the matrix scores. Draw connection lines with appropriate weights. Group nodes by zone and apply color coding. At this stage, do not worry about the building footprint or site constraints. The goal is pure spatial logic.
Step 4: Test and Refine
Review the diagram against user scenarios. Walk through a typical day for each building occupant: Does the receptionist have a clear sightline to the entrance? Can kitchen staff deliver food to the dining area without crossing a public corridor? Each scenario will expose gaps or conflicts in your relationship mapping. Produce at least two or three variations before settling on a final version.
⚠️ Common Mistake to Avoid
Many architecture students confuse a functional relationship diagram with a floor plan sketch. The diagram should remain abstract. The moment you start shaping nodes to match room geometries or aligning them to a building grid, you limit your ability to explore alternative spatial arrangements. Keep the diagram loose and conceptual until you move into schematic design.

Why Functional Relationship Diagrams Matter in the Design Process
Functional relationship diagrams sit at a critical point in the design workflow. They bridge the gap between a written program document and the first drawn floor plan. Without this step, architects risk jumping into layout decisions based on habit or assumption rather than verified spatial logic.
In healthcare projects, for example, the relationship between an emergency triage area and imaging suites directly affects patient outcomes. A well-constructed relationship diagram in architecture will flag that connection early, long before structural grids or mechanical layouts make it expensive to change. The same principle applies to school designs, where the relationship between classrooms, shared learning spaces, and outdoor play areas shapes how students and teachers move through their day.
These diagrams also serve as communication tools. When presenting to clients who cannot read technical drawings, a clear architectural diagram showing zones and connections is far more effective than a floor plan full of dimension strings and notation. Clients can point to a node and ask questions about why two spaces are linked, leading to more productive design conversations.
🏗️ Real-World Example
Seattle Central Library by OMA/LMN (Seattle, 2004): The design team used a sequence of programmatic and functional relationship diagrams to reorganize the library’s program into five distinct spatial “platforms” (parking, staff, meeting, books, headquarters) separated by flexible in-between zones. This diagrammatic approach allowed the architects to break away from traditional floor-by-floor layouts and create a building where functional logic directly generated the architectural form.
Types of Relationships Shown in Architecture Diagrams
Not all spatial relationships are equal. A strong functional relationship diagram distinguishes between several types of connections, each with different design implications.
Direct adjacency means two spaces share a wall or opening. A kitchen and pantry need direct adjacency. Proximity means spaces should be nearby but do not require a shared boundary. A conference room near an office cluster is a proximity relationship. Visual connection means occupants in one space should be able to see into another, even without physical access. A reception desk with a sightline to the entrance lobby is a visual connection. Acoustic separation means two spaces must be buffered from each other’s noise. A music practice room next to a library reading area would need acoustic separation indicated on the diagram.
Understanding these distinctions helps you produce architecture diagrams that carry enough information to drive real design decisions, not just illustrate general intent.
Tools for Creating Functional Relationship Diagrams
The tools you choose depend on the project stage and your audience. Early concept work benefits from speed and flexibility, while presentation-quality diagrams require cleaner graphics.
Hand Sketching
Pen and trace paper remain the fastest way to test spatial arrangements during the first hours of a project. You can draw, erase, overlay, and redraw without any software friction. Many experienced architects start every project this way, switching to digital tools only after the core relationships are settled.
Digital Diagramming Software
Tools like draw.io (diagrams.net), Figma, and Adobe Illustrator offer drag-and-drop node placement with customizable line styles. For architects who work within BIM environments, some firms build early relationship diagrams directly in Revit or ArchiCAD using colored rooms and link annotations, although this adds unnecessary complexity for most projects at this stage.
If you are looking for a quick starting point for spatial diagrams, the illustrarch bubble diagram maker offers a lightweight tool for mapping spatial relationships without installing any software.
🎓 Expert Insight
“Architecture should speak of its time and place, but yearn for timelessness.” — Frank Gehry
This idea applies directly to diagramming practice. The functional relationships you define during programming reflect how people actually use buildings today, while the spatial logic they produce can outlast trends and stylistic preferences if grounded in genuine user needs.

From Diagram to Floor Plan: Making the Transition
A functional relationship diagram is not a floor plan, but it is the foundation on which every good floor plan is built. The transition happens in stages. First, the abstract diagram gets overlaid onto the site plan, where orientation, access points, and topography begin to shape the layout. Next, the nodes transform into rooms with approximate dimensions, and the connection lines become corridors, doorways, or open thresholds.
During this transition, the diagram serves as a checklist. Every time a design decision conflicts with a relationship established in the diagram, the architect must either adjust the layout or revisit the program. This feedback loop between diagram and plan is what separates a well-organized building from one where rooms feel randomly placed.
For more on how circulation diagrams refine movement paths after the functional relationships are set, and how architectural diagramming techniques evolve throughout the design process, these related resources cover the next steps in detail.
Video: How to Create a Spatial Relationship Diagram for Architecture
This tutorial walks through the process of translating an architectural program into a spatial relationship diagram, covering node placement, connection mapping, and iterative refinement.
Final Thoughts
Functional relationship diagrams are one of the most underused tools in the architectural design process. They take relatively little time to produce, yet they prevent costly layout mistakes that surface during construction documents or, worse, after the building is occupied. Whether you are designing a single-family home or a 50,000-square-meter hospital, mapping spatial relationships early gives your project a logical backbone that supports every decision that follows. Start with an adjacency matrix, draw at least three diagram variations, test each against real user scenarios, and let the strongest spatial logic guide your floor plan.


What Is an As-Built Drawing and When Is It Required?
As-built drawings are the corrected record of a project, showing how a...

What Is an Isometric Drawing in Architecture?
A clear look at isometric drawing in architecture, covering how the 120-degree...

Exploded Diagram Architecture: What It Is and How to Draw One
An exploded diagram in architecture lifts a building into its real assembly...

Construction Documents Architecture: From Schematic to Working Drawings
A plain-language look at construction documents architecture, tracing the path from schematic...

Leave a comment