

Concept Diagram Architecture: Types, Examples & How to Create
A concept diagram in architecture is a graphic representation that distills abstract design ideas into simple, visual forms. This guide covers what conceptual diagrams are, how they differ from bubble and structure diagrams, and a step-by-step process for creating effective architecture concept diagrams for both students and professionals.
 Elif Ayse Sen14 January 202613 Mins read1.1k

Table of Contents Show
Quick answer: A concept diagram in architecture is a simple drawing that communicates the core idea behind a design before details are added. Using arrows, shapes, and zones, it shows relationships such as circulation, views, and program, helping architects and clients agree on the big idea early.
Quick Answer: A concept diagram is a simple visual that captures the core idea behind an architectural design. Using basic shapes, arrows and labels, it shows the project’s main organizing principle, such as a central axis or a flow of spaces, before any detailed drawing begins.
A concept diagram architecture professionals create is a graphic representation that distills abstract design ideas into simple, visual forms. It captures the single governing idea behind a project, acting as a bridge between initial thinking and concrete spatial solutions. This guide covers what conceptual diagrams are, how they differ from bubble, parti, and structure diagrams, and a practical step-by-step process for creating effective concept diagrams.
Creating a diagram is one of the most important steps of architectural presentation techniques. A concept diagram in architecture serves as the visual bridge between abstract design thinking and concrete spatial solutions. We are trying to better introduce architectural diagrams to all architects and architecture students. For that reason, in this article, we will talk about the conceptual diagram, which is the second part of the architectural diagram types series. In the continuation of the article, you can get information about what conceptual diagrams are, how they are created, and how they differ from other diagram types such as structure diagrams and bubble diagrams.
Why Do We Need Concept Diagrams in Architecture?
Architectural diagrams are made in order to best presentations of architectural projects. As a result, the sorts of diagrams are determined by the subject to be conveyed. Diagrams are required by architects since technical drawings and renderings are insufficient to describe architectural projects. Only architects and professionals understand technical intricacies, two-dimensional plan and section drawings, and other techniques of representation. Professional renderings are easily understood by everyone, but they are frequently insufficient to describe the project. Architects use architectural diagrams to provide the finest explanations.
Understanding why concept diagrams matter in architecture is essential for both students and professionals. A well-crafted conceptual architecture diagram communicates the designer’s intent far more effectively than pages of written description. According to Archisoup, architectural diagrams operate precisely between form and word, making them indispensable for conveying design ideas to clients and collaborators. Whether you are preparing for a professional presentation or a student jury, concept diagrams architecture professionals rely on will strengthen your communication.
💡 Pro Tip
Keep your first concept diagram to a single A4 sheet and limit it to three visual elements. If you cannot express the core idea with three marks on paper, the concept itself likely needs more clarity before you move into spatial planning. Experienced architects often apply this constraint even on complex competition entries, using it as a self-check before committing hours to schematic design.

What Is a Conceptual Diagram in Architecture?
A conceptual diagram is a graphic representation of the relationships between abstract concepts in projects. It is used to help visualize processes or systems at a high level by using a succession of distinct lines and shapes. Conceptual diagrams are commonly used in all design fields and architecture. They can be built in a variety of ways to meet the needs of the project. Abstract thoughts are represented as text, encased in forms on a blank background, and connected by a series of arrows or lines in certain popular conceptual diagrams. A fundamental notion is frequently placed in the heart of the diagram, and additional aspects are depicted in relation to this central concept. Some conceptual diagrams, especially in architecture, explain which concepts and ideas come together with buildings with a more massive approach.
In essence, a conceptual architecture diagram distills the core idea of a project into its simplest visual form. Unlike technical drawings that focus on dimensions and materials, concept diagrams architecture professionals create focus on relationships, hierarchies, and the guiding principles behind a design. The American Institute of Architects (AIA) emphasizes the importance of clear visual communication throughout the design process, and conceptual diagrams play a central role in achieving that clarity.
📌 Did You Know?
The architectural theorist Robert Somol observed that diagrams “operate precisely between the form and the word,” which explains why a single well-made concept diagram can replace paragraphs of written explanation during a client meeting. This dual nature, part image and part idea, is what makes the concept diagram architecture’s most versatile communication tool.

Concept diagrams contain the initial ideas, main concepts and all supporting elements of the project. All elements present in concept diagrams are for architects to convey their projects in the best way possible. It is not possible to read a project through renders or two-dimensional drawings. Concept diagrams explain all concepts below, above, inside and outside the project. Concepts in themselves are a very important element in architecture. Because a concept affects your project from the first lines to the last touches. Architects remain true to the concepts of their projects from start to finish. At the end of the day, they need conceptual diagrams to explain these concepts in a professional way and explain their place in the project. Let’s learn how to create conceptual diagrams, one of the most important types of architectural diagrams!
Concept Diagram vs. Other Architectural Diagram Types
Understanding where conceptual diagrams fit within the broader landscape of architectural diagram types helps architects choose the right tool for each stage of their design process. While all architectural diagrams serve communication purposes, each type has a distinct focus.
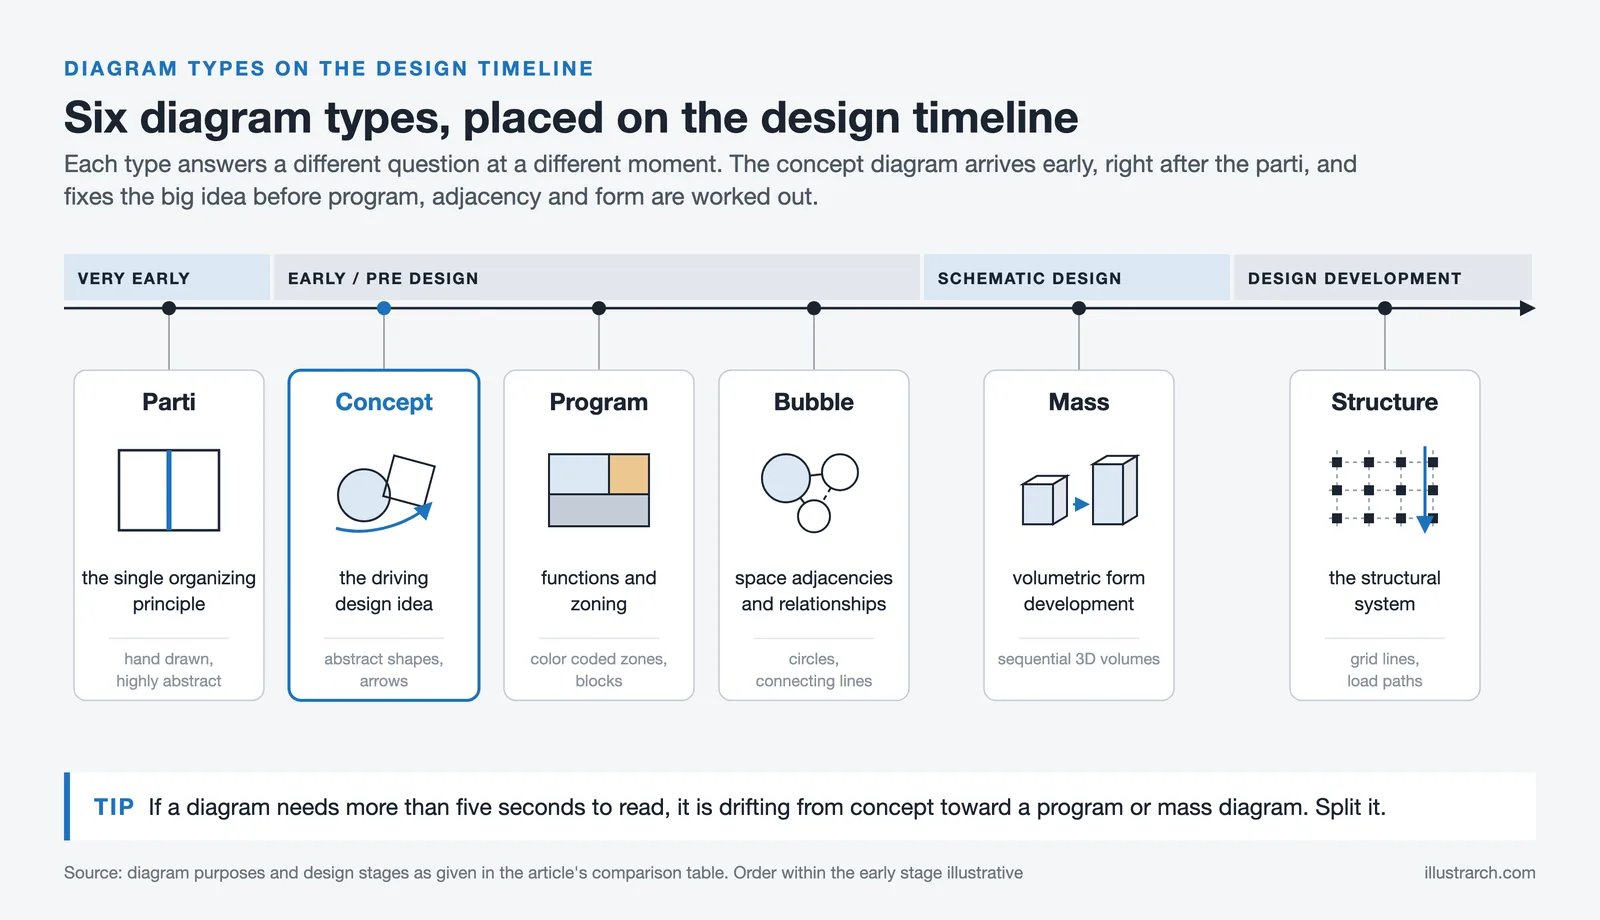
A concept diagram captures the fundamental design idea, the “parti” or driving concept behind a project. It answers the question “what is the big idea?” In contrast, a bubble diagram focuses on spatial relationships and adjacencies between programmatic elements, typically created during early space planning. Structure diagrams explain the structural system and load-bearing elements, while program diagrams illustrate functional zoning and spatial distribution.
The table below summarizes when each diagram type is most useful during the design process.
| Diagram Type | Primary Purpose | Design Stage | Typical Format |
|---|---|---|---|
| Concept Diagram | Communicate the driving design idea | Early concept / pre-design | Abstract shapes, arrows, annotations |
| Parti Diagram | Capture the single organizing principle | Very early / initial response | Hand-drawn, highly abstracted |
| Bubble Diagram | Map space adjacencies and relationships | Early space planning | Circles, connecting lines |
| Program Diagram | Organize functions and zoning | Programming phase | Color-coded zones, blocks |
| Mass Diagram | Show volumetric form development | Schematic design | Sequential 3D volumes |
| Structure Diagram | Explain structural system | Design development | Grid lines, load paths |
A mass diagram in architecture is closely related to conceptual diagrams but specifically focuses on volumetric studies. Mass diagrams show how building volumes are shaped, subtracted, or added to create the final form. They are often used as a subset of conceptual diagrams to demonstrate how the design concept translates into three-dimensional massing. Architects frequently combine mass diagrams with conceptual diagrams to present a comprehensive story of form development, from abstract idea to physical volume. Firms like Bjarke Ingels Group (BIG) have turned mass diagram sequences into a signature element of their project narratives, demonstrating that diagrammatic clarity can itself become a design asset. You can also explore our detailed breakdown in the guide on what is a parti diagram, which unpacks how parti relates to the broader concept diagram family.
🎓 Expert Insight
“Diagrams operate precisely between the form and the word.” Robert Somol, architectural theorist
Somol’s observation explains why concept diagrams remain irreplaceable even as rendering and BIM tools advance. A render shows what a building will look like; a concept diagram explains why it takes that form. Both are needed in a complete presentation, but only one can be read in under five seconds.
How to Create Concept Diagrams
Conceptual diagrams are made in order to explain the numerous ideas of architects in a simple and understandable way. As an architect, your aim is to explain in the best way how your concept works in all phases of the project. For this, it is necessary to create detailed but easy-to-understand diagrams. Before creating conceptual diagrams, consider how your abstract ideas become concrete. What is your strongest idea? Aim to highlight this idea first with conceptual diagrams. How did the physical and environmental conditions of your project evolve with this idea?
What is the relationship between the public and private spaces of your project and your concept? Conceptual diagrams are there to explain such relationships, to convey ideas to those who want to understand the project.
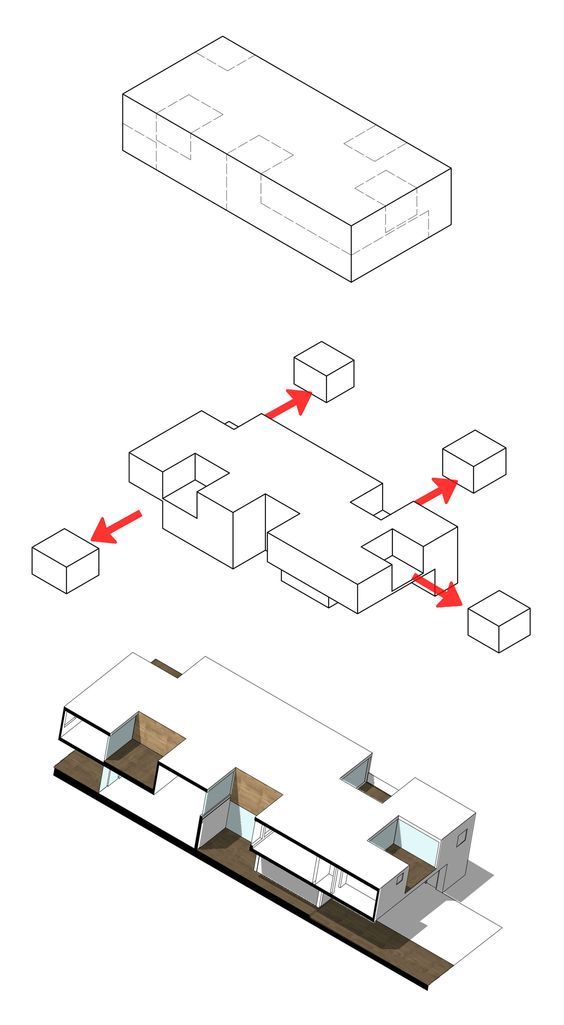
To create concept diagrams, you can start by creating simple masses through 3D drawing software that you model your project on. A step-by-step explanation would be better than layering on a single image. Concepts and ideas are abstract, it is necessary to find simple ways to describe the abstract. You must write the necessary explanations in the conceptual diagrams as text. If you use legible texts when explaining the concepts of your architectural project, you will express your ideas in the best way. Besides, you can create abstract conceptual diagrams besides mass and spatial diagrams. Especially with concept maps, you can explain how your ideas are related from the most primitive to the present.
Step-by-Step Process for Creating Architecture Concept Diagrams
To help you get started with creating effective conceptual diagrams, here is a structured approach that works for both students and professionals:
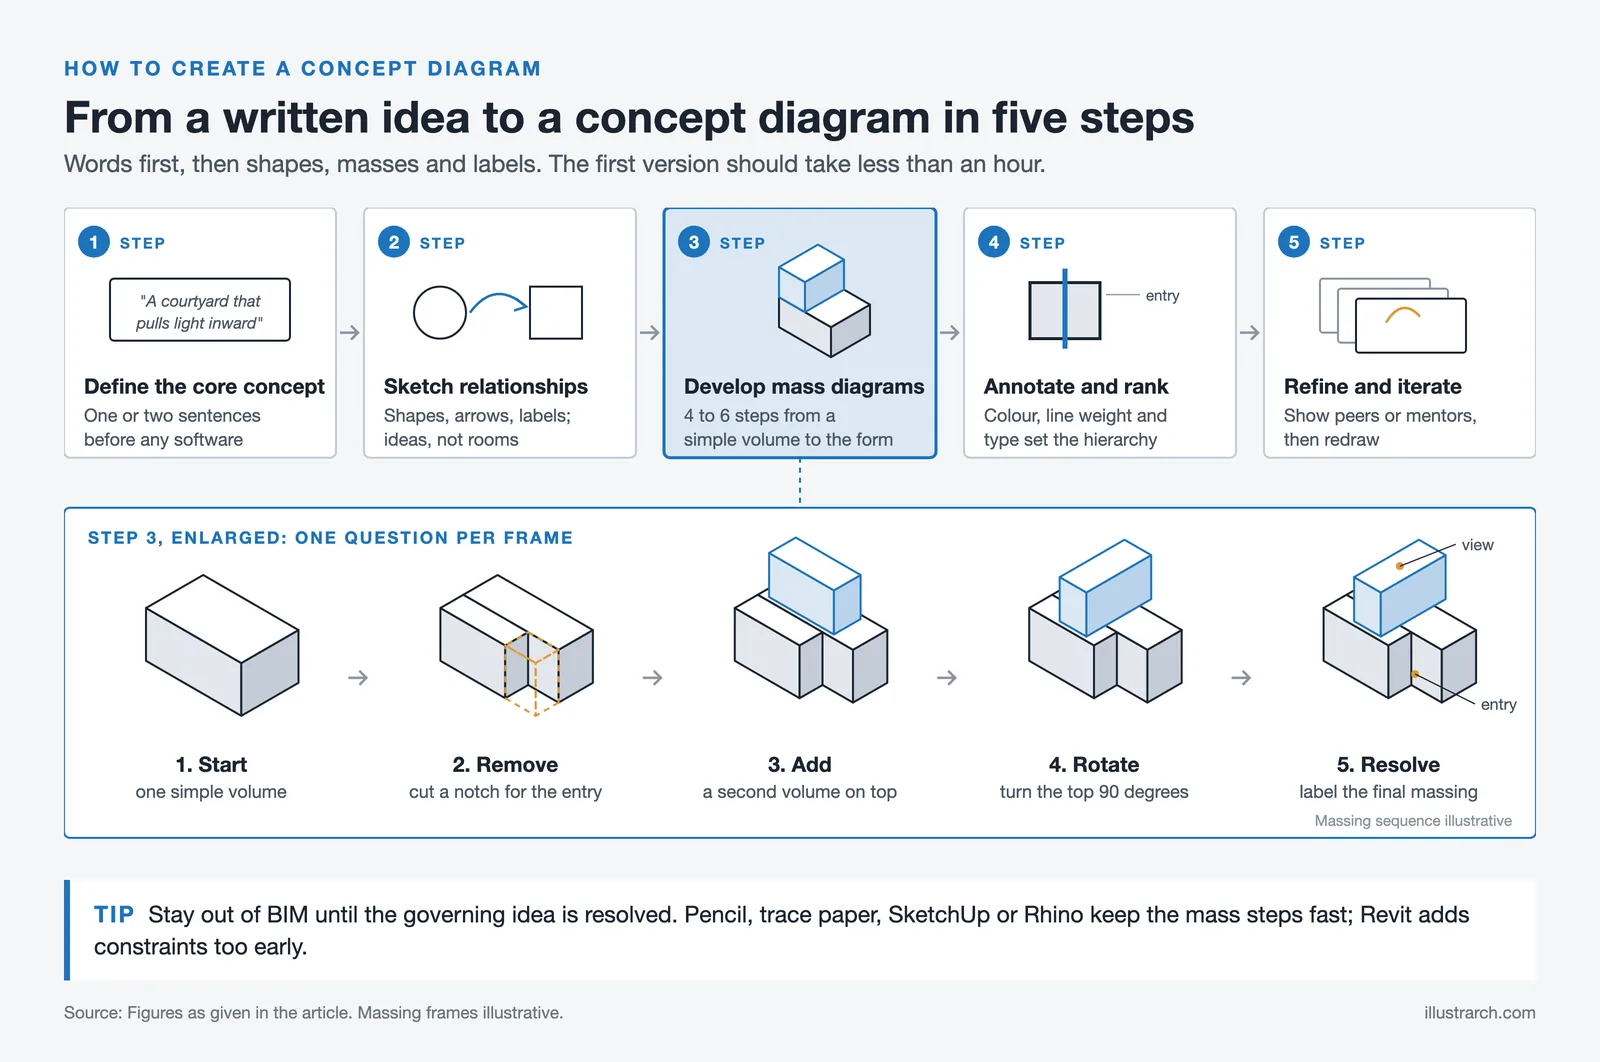
1. Define Your Core Concept: Before opening any software, clearly articulate your design concept in one or two sentences. This driving idea will be the foundation of your conceptual architecture diagram. Whether it is about porosity, connection to nature, or layering of public and private spaces, your concept must be crystal clear.
2. Sketch Abstract Relationships: Begin with rough hand sketches. Use simple geometric shapes, arrows, and labels to map out how your concept influences spatial organization. At this stage, your diagram should feel closer to a bubble diagram but focused on ideas rather than rooms.
3. Develop Mass Diagrams: Translate your abstract sketches into three-dimensional mass studies using software like SketchUp, Rhino, or Revit. A mass diagram in architecture typically shows sequential steps, from a simple volume to the final massing, illustrating how the concept shapes the building form. Build the sequence as 4 to 6 steps rather than showing the final form in a single image. Each step should answer one question: what was added, removed, or rotated, and why. For a deeper walkthrough of sequential massing, see our collection of successful architectural diagrams by architects.
4. Add Annotations and Hierarchy: Label each element of your conceptual diagram clearly. Use color coding, line weights, and typography to create visual hierarchy. As highlighted in our guide to creating architecture diagrams, clarity and readability matter most.
5. Refine and Iterate: Share your concept diagrams with peers or mentors for feedback. The best conceptual diagrams go through multiple iterations before reaching their final form.
⚠️ Common Mistake to Avoid
A common mistake is starting mass diagrams in BIM software like Revit too early in the process. BIM tools add parametric constraints that slow down concept exploration. Use pencil, trace paper, or lightweight modelers such as SketchUp or Rhino for concept and mass diagrams, then transition to BIM only once the governing idea is resolved. Trying to develop a concept inside Revit typically doubles the time spent on early design.
Types of Conceptual Diagrams in Architecture
Conceptual diagrams in architecture can take various forms depending on the project’s needs and the stage of design development. Understanding these variations helps architects select the most effective approach for communicating their ideas.
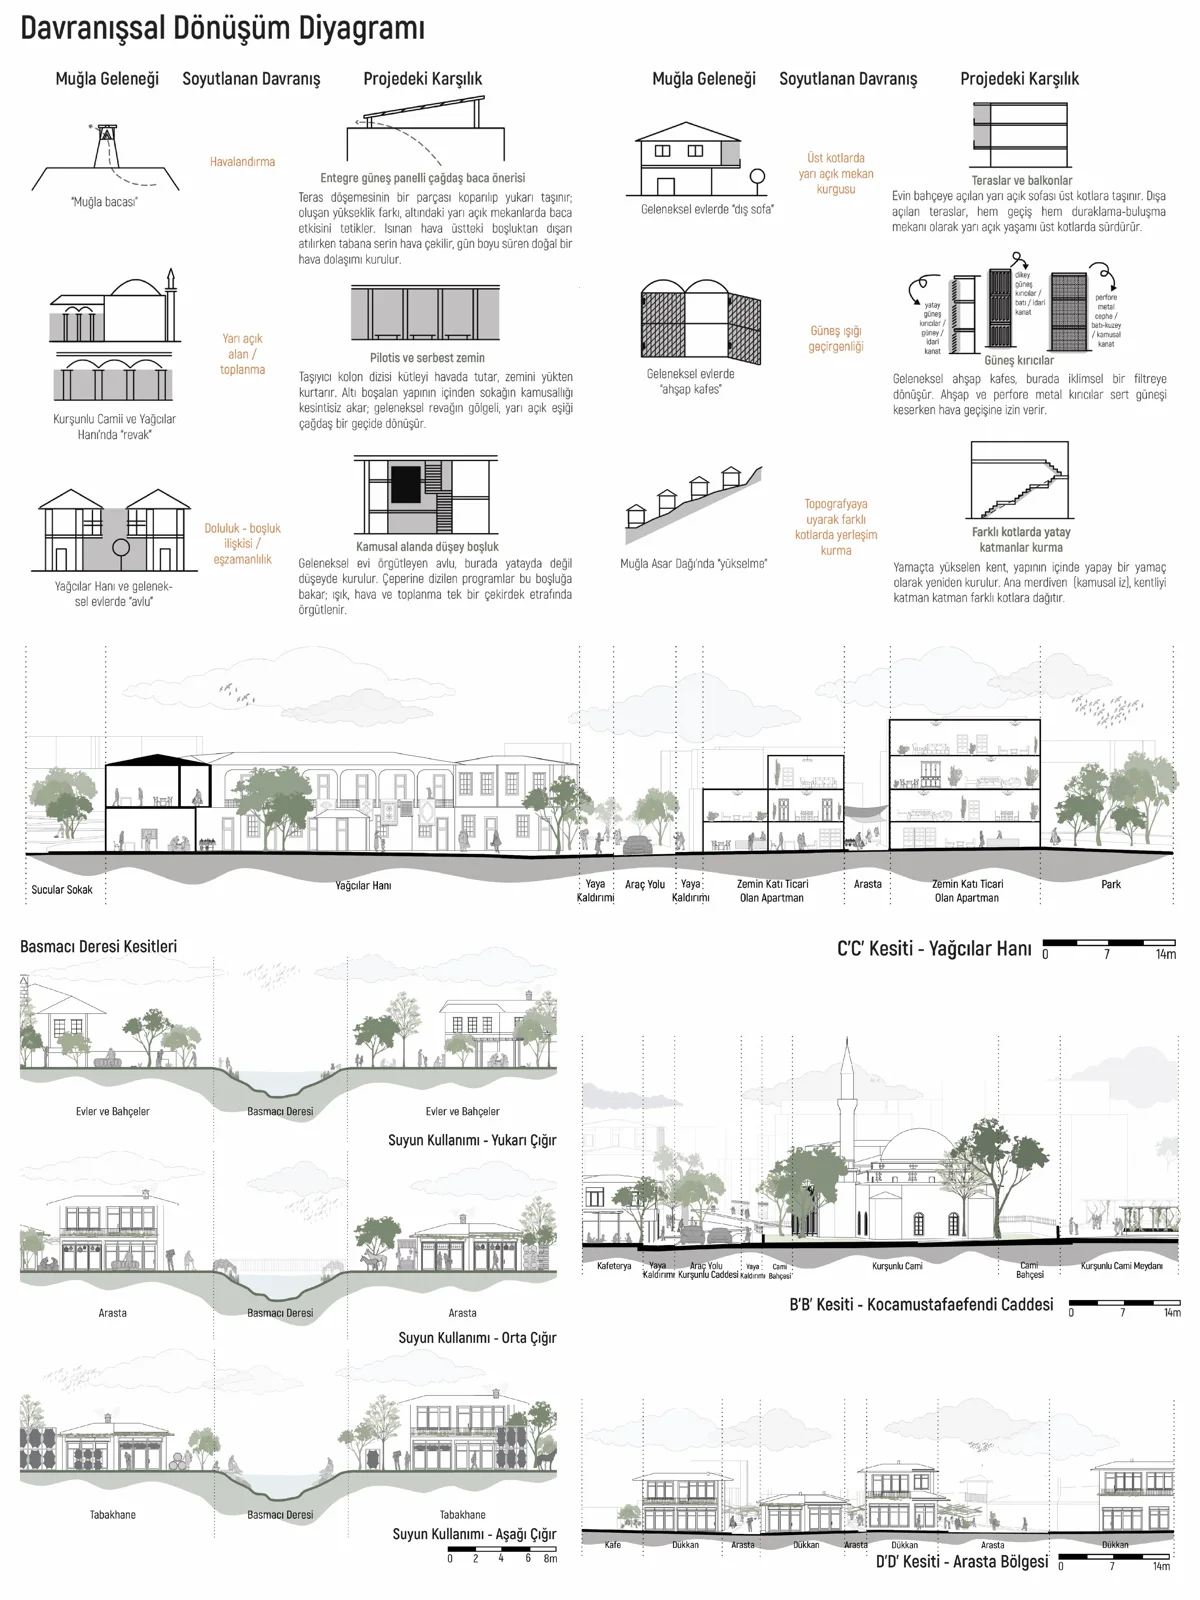
Abstract conceptual diagrams use minimal graphics, simple lines, shapes, and text on a blank background, to represent relationships between ideas. These are ideal for early brainstorming sessions and presenting initial design concepts to stakeholders.
Mass-based conceptual diagrams translate ideas into volumetric representations. These diagrams show the step-by-step evolution of building form, demonstrating how the architect’s concept drives massing decisions. This is where the mass diagram architecture approach becomes particularly useful, as it bridges the gap between abstract thinking and physical form.
Concept maps use node-and-link structures to show how different ideas connect to one another. They are especially valuable for projects with complex programmatic requirements, where multiple concepts must work together harmoniously.
Parti diagrams capture the essential organizing idea of a design in its simplest possible form. As noted by First In Architecture, parti diagrams are among the most abstracted of all architectural diagrams and are typically hand-drawn. For students who want to see how all these types fit together, the complete guide to architectural diagrams for students puts them in context.
📐 Technical Note
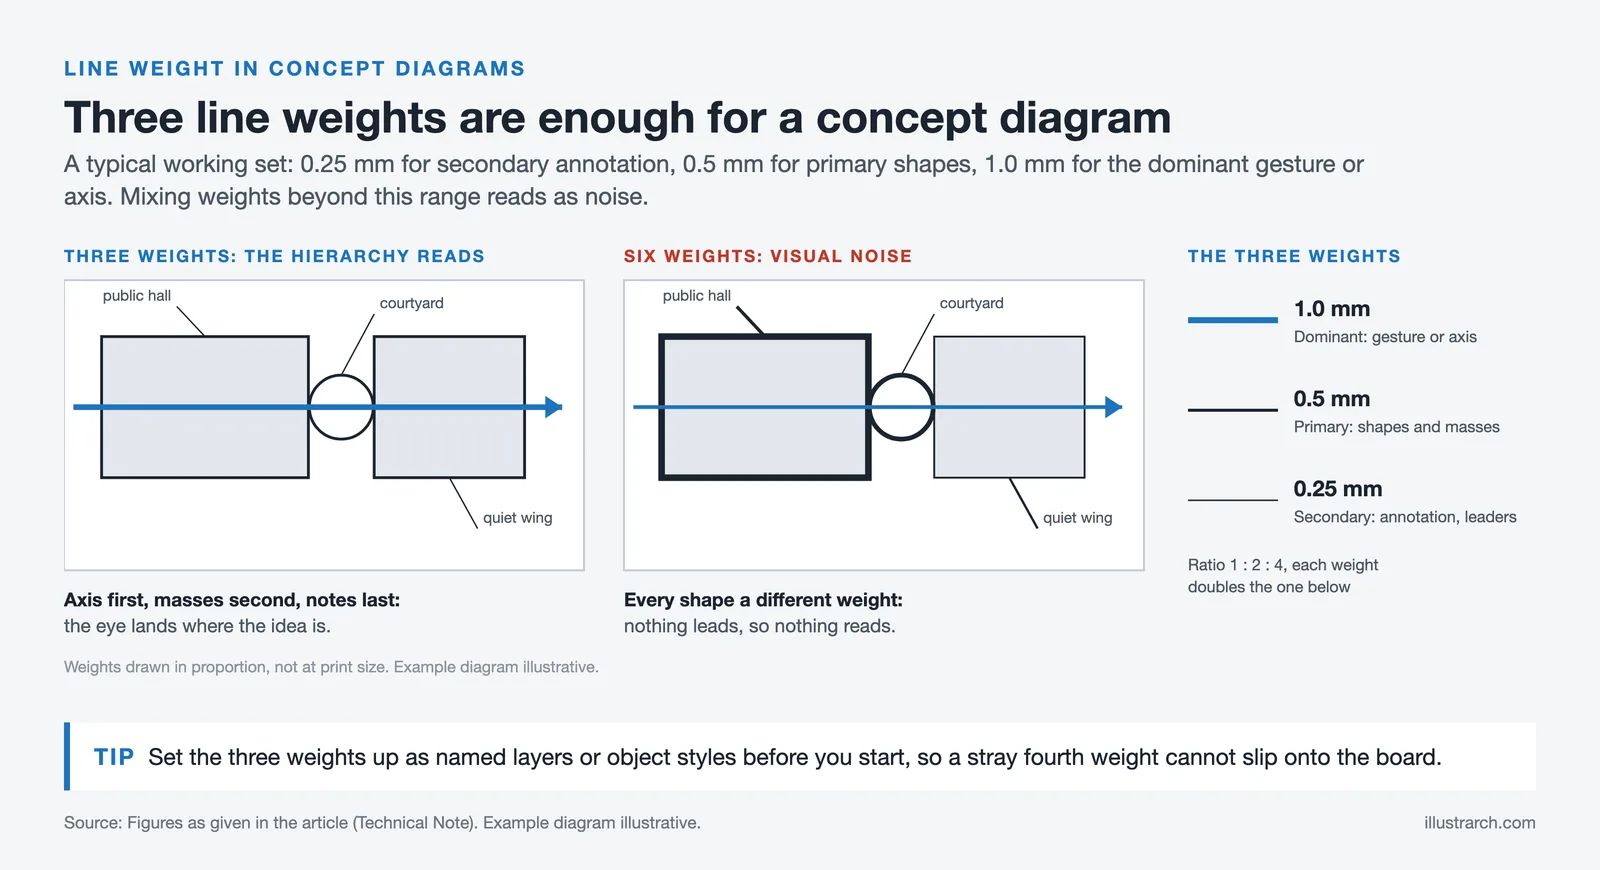
When preparing concept diagrams for a presentation board, stay consistent with line weights and type hierarchy. A typical working set uses three line weights: 0.25mm for secondary annotation, 0.5mm for primary shapes, and 1.0mm for the dominant gesture or axis. Mixing weights beyond this range usually reads as visual noise rather than intentional emphasis.
Tools and Software for Creating Concept Diagrams
Modern architects and architecture students have access to a wide range of tools for creating conceptual diagrams. The choice of tool often depends on the level of abstraction needed and personal workflow preferences.
For quick, abstract concept diagrams, tools like Adobe Illustrator, Figma, and even Procreate on iPad offer flexibility for creating clean vector graphics with text annotations. For mass-based conceptual diagrams, 3D modeling software such as SketchUp, Rhino, and Autodesk Revit allows architects to create sequential massing studies that can be exported as diagram sequences. For a dedicated walkthrough of how to set up concept diagram views specifically inside SketchUp, see our article on concept diagrams in SketchUp.
💡 Pro Tip
When exporting mass diagrams from SketchUp for presentation, switch the view from Perspective to Parallel Projection before capturing frames. Parallel projection keeps edges aligned across a sequence of images, which makes step-by-step massing evolution read much more clearly on a board than perspective views, where relative sizes shift between frames.
Many architects combine hand sketching with digital refinement, starting with rough pencil sketches to capture the spontaneity of the concept, then digitizing and refining in software for professional presentation. The Illustrarch Bubble Diagram Maker is a free browser-based tool that can help with early spatial planning before diving into more detailed conceptual diagrams.
For those working on collaborative projects, cloud-based tools like Miro and FigJam enable real-time co-creation of concept maps and diagrammatic explorations. AI-assisted diagramming is also becoming part of the contemporary toolkit. For a look at how generative tools fit into the concept phase, read about AI-generated diagrams in architectural design.
Common Mistakes to Avoid in Conceptual Architecture Diagrams
Even experienced architects can fall into common pitfalls when creating conceptual diagrams. Being aware of these mistakes will help you produce more effective and communicative diagrams.
Overcomplicating the diagram is the most frequent mistake. A conceptual diagram should simplify, not add complexity. If your diagram requires extensive explanation to understand, it has defeated its purpose. Aim for a concept diagram architecture professionals can grasp within seconds.
Ignoring visual hierarchy weakens communication. Every conceptual diagram should have a clear focal point and a logical reading order. Use scale, color, and positioning to guide the viewer’s eye through the diagram.
Confusing concept diagrams with technical drawings is another common error. Conceptual diagrams should remain abstract and idea-driven. Adding too much technical detail, like dimensions, material callouts, or structural annotations, turns a concept diagram into something else entirely.
Neglecting context can make a conceptual diagram feel disconnected. Even at the conceptual stage, showing how your design idea responds to site conditions, climate, or urban context adds depth and credibility to your architecture concept diagram. Published project pages on ArchDaily show that firms like BIG, MVRDV, and Sasaki consistently ground their concept diagrams in specific site forces rather than abstract gestures alone.
Frequently Asked Questions About Concept Diagrams
What is the difference between a concept diagram and a parti diagram?
A parti diagram captures a single, overarching organizing principle of a design in the simplest possible image, usually hand-drawn. A concept diagram is slightly broader and may show multiple related ideas, influences, or themes. In practice, the parti is the most distilled version of the concept: if the concept is “a building that grows from the earth,” the parti might be one sketch of stacked masses rising from a solid base.
How long should it take to create a concept diagram?
An initial concept diagram should take less than an hour in its first form. The discipline of working fast prevents overthinking and keeps the diagram at the right level of abstraction. Refinement for presentation takes longer, typically a few hours, but the core idea behind a strong concept diagram architecture relies on is usually captured quickly. If you are spending a full day on the first version, the underlying concept likely needs more clarity first.
Can concept diagrams be hand-drawn?
Yes, many experienced architects prefer hand-drawn concept diagrams in the early stages because sketching forces decisions and captures the intent of the gesture. Digital refinement usually follows for final presentation. Famous architects like Le Corbusier, Frank Lloyd Wright, and Renzo Piano relied heavily on hand sketches at the concept stage throughout their careers.
What software is best for creating concept diagrams in architecture?
The best software depends on the diagram type. For abstract concept diagrams, Adobe Illustrator and Figma work well. For mass-based diagrams, SketchUp and Rhino are preferred for speed, while Revit handles concepts that need to flow into BIM. Procreate on iPad is popular for quick hand-style digital sketches. Most architects combine two or three of these tools across a single project.
✅ Key Takeaways
- A concept diagram in architecture distills the driving design idea into a simple visual form that anyone can read at a glance.
- Concept, parti, bubble, program, mass, and structure diagrams each serve a different stage of the design process and should not be used interchangeably.
- The strongest workflow is: hand sketch → abstract concept diagram → sequential mass diagram → annotated final version.
- Keep concept diagrams abstract. Adding technical detail, dimensions, or material callouts turns them into something else.
- Firms like BIG treat concept and mass diagrams as a core part of their storytelling, proof that diagrammatic clarity itself can be a design asset.
Download Architectural Diagrams eBook
Free Online Bubble Diagram Maker
Frequently Asked Questions
A concept diagram is a simple drawing that shows the main idea driving a design, using shapes, arrows and labels. It captures the organizing principle of a project, such as how spaces flow or relate, before detailed plans are drawn.
Start with the single idea you want the design to express, then reduce it to basic shapes and arrows. Add only the elements that explain that idea, keep labels short, and refine the diagram until anyone can grasp the concept at a glance.
A parti diagram is the most reduced form of a concept diagram, showing the core organizing idea in its simplest mark. A concept diagram can carry a little more detail, while a parti distils the scheme to its single essential gesture.



1 Comment





Stacking Diagram: How to Allocate Uses Floor by Floor
A stacking diagram assigns each use in a brief to a level,...
 Sinan Ozen7 Mins read
Figure-Ground Diagram: How to Draw and Read Urban Fabric
A figure-ground diagram reduces a city to built mass against open space....
Sinan Ozen7 Mins read
Sun Path Diagram: How to Read One and Use It in Design
A sun path diagram shows where the sun sits all year for...
Sinan Ozen8 Mins read
Matrix Diagram in Architecture: How to Map Space Adjacencies
A matrix diagram, or adjacency matrix, maps how every space in a...
Sinan Ozen8 Mins read


This article has some useful information about diagrams in architecture. It explains the importance of conceptual diagrams, but I feel like it could go into more detail on how to create them. Overall, it’s okay.