

8 Essential Web-Based Mapping Tools for Modeling Sea Level Rise and Flood Impacts
As climate change accelerates, flood risk and sea level rise have become critical factors in architectural and urban planning decisions. In 2026, advanced online mapping platforms allow designers to visualize future scenarios, assess vulnerability, and communicate risk with clarity.

Table of Contents Show
As climate change accelerates, rising sea levels and increasingly severe flood events have become some of the most urgent challenges facing architects, urban planners, and landscape designers. In 2026, online mapping tools play a critical role in understanding risk, evaluating long-term vulnerabilities, and shaping more resilient coastal and riverfront developments. These digital platforms translate complex environmental data into clear, actionable insights, enabling practitioners to visualize future scenarios, identify exposure zones, propose mitigation strategies, and communicate risks to clients, communities, and decision-makers. From large-scale regional modeling to parcel-level flood projections, these tools support better planning outcomes and help ensure that our built environments can adapt to a rapidly changing climate. Below are eight of the most essential online platforms for analyzing sea level rise and flooding today.

1. NOAA Sea Level Rise Viewer
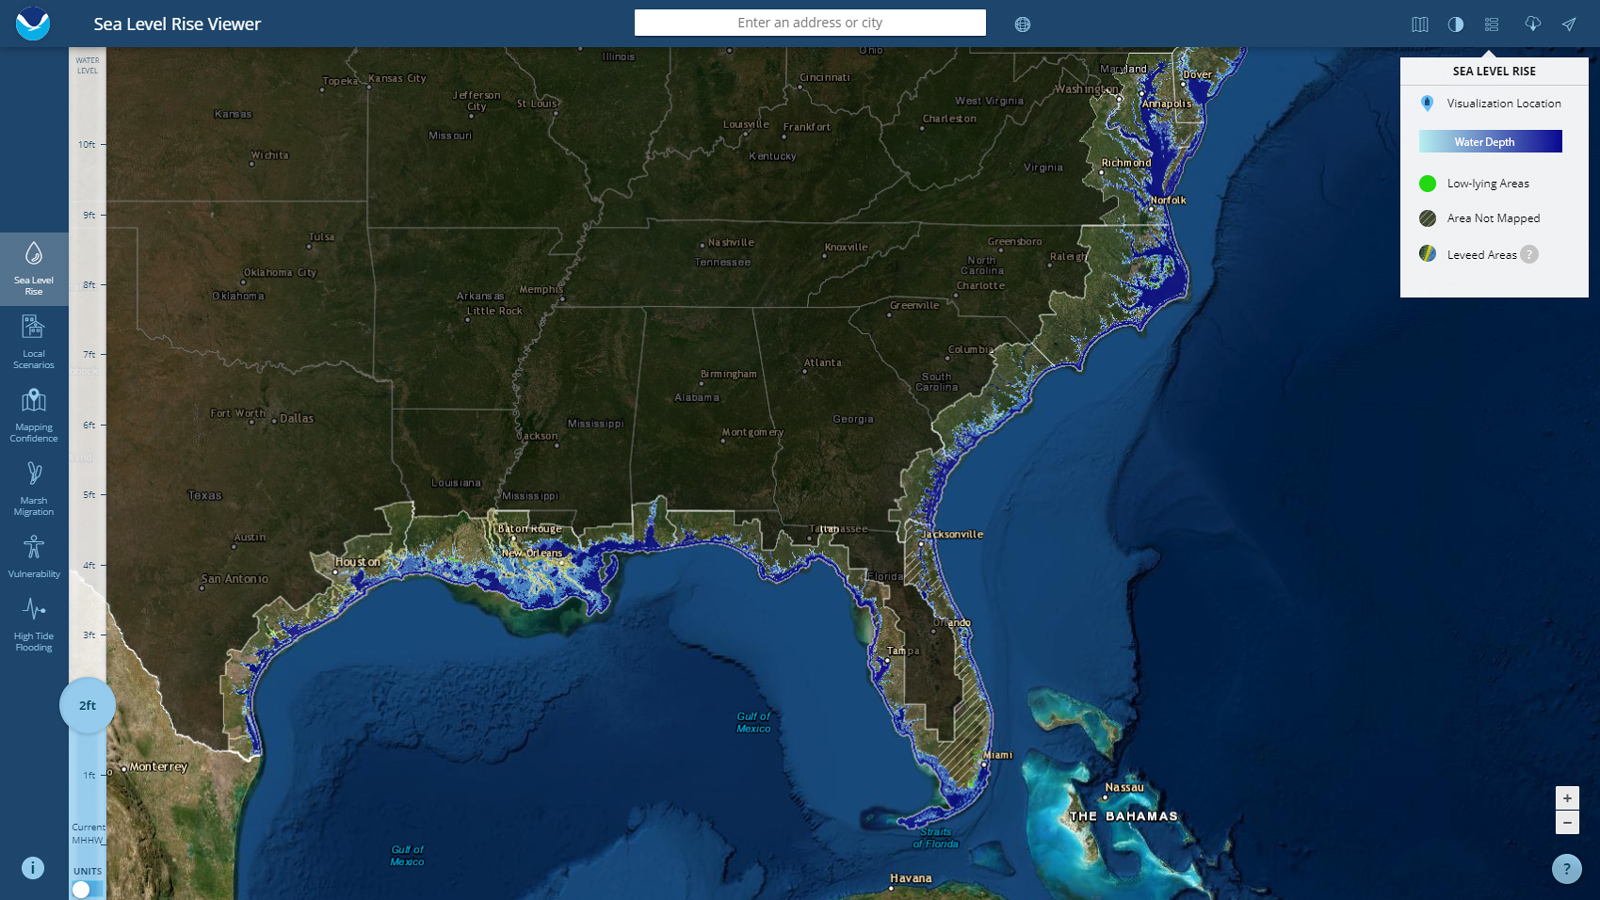
NOAA’s Sea Level Rise Viewer remains one of the most authoritative publicly accessible flood-mapping tools available. Built on reliable scientific datasets, it allows users to visualize projected sea level rise scenarios from 1 to 10 feet across U.S. coastlines. The platform integrates tidal data, wetland vulnerability layers, and socioeconomic exposure metrics, helping planners understand not only where flooding will occur, but who and what will be impacted. Its intuitive interface makes it ideal for public outreach, resilience master plans, and early feasibility studies. Architects frequently rely on it to assess whether a potential project site faces long-term inundation risk and to evaluate the effectiveness of floodproofing strategies.
2. Climate Central Flood Risk Tools
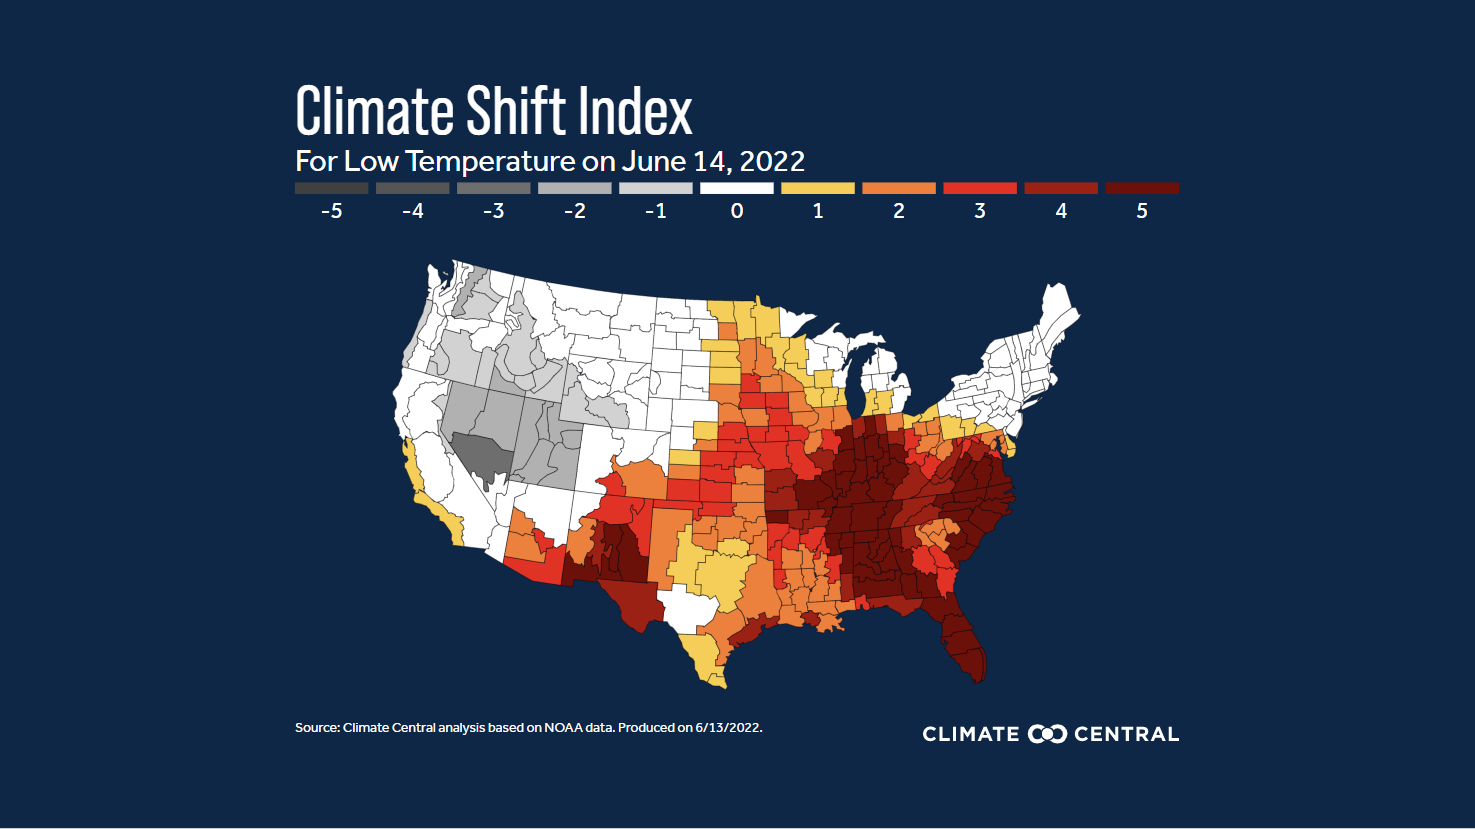
Climate Central’s suite of interactive maps provides globally accessible flood projections driven by extensive climate modeling and elevation data. The tool highlights “risk zones” across countries, taking into account factors like storm surge, population density, and emissions pathways. Unlike basic flood maps, Climate Central emphasizes long-term exposure timelines, showing how risks evolve over decades. This allows designers and policymakers to evaluate whether critical infrastructure, low-lying neighborhoods, or future development areas will remain viable. For architects, it acts as an early screening tool that informs decisions regarding building placement, foundation systems, and long-term site resilience.
3. NASA Sea Level Change Portal

NASA’s Sea Level Change Portal aggregates some of the most advanced scientific insights on ocean dynamics, ice sheet melt, and coastal vulnerability. Its interactive map viewer pulls from satellite altimetry, GRACE gravity missions, and global climate models to show how sea level rise varies regionally. This is essential because sea level rise is not uniform — some areas experience uplift while others subside. For architects and engineers working on high-stakes developments near major coastlines, NASA’s tools offer unparalleled accuracy and scientific credibility. The platform also provides trend analysis, research summaries, and visualization of ocean height anomalies that support data-driven resilience design strategies.
4. Google Earth Engine Flood Mapping
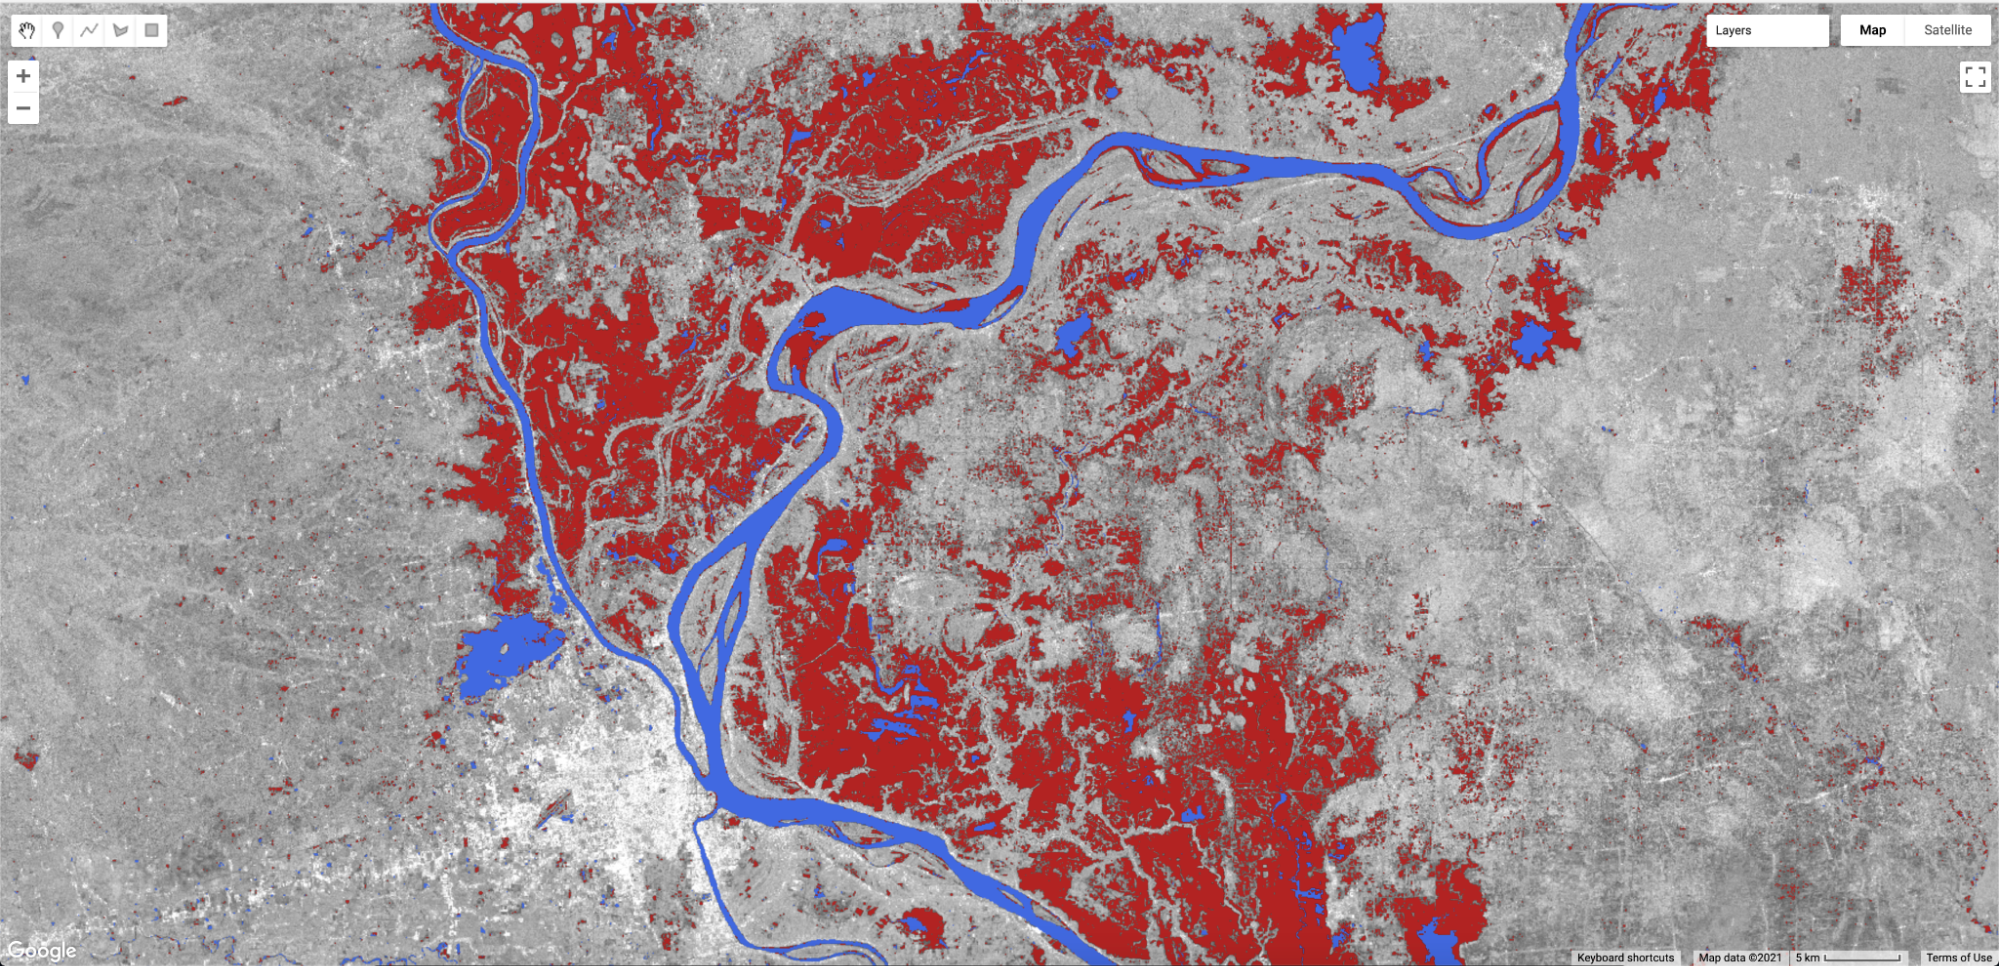
Google Earth Engine enables large-scale geospatial analysis by combining satellite imagery with machine learning and powerful cloud computing. Designers can view historical flood extents, analyze water-level variations, and overlay elevation or land-use data to determine where future flooding is most likely. Earth Engine is particularly useful for urban planners working with multi-decade datasets because it allows temporal comparisons, such as how a floodplain has expanded over time. For resilience planning in developing countries, where official flood data may be limited, Earth Engine serves as an invaluable open-source resource.
5. FloodFactor

FloodFactor provides property-level flood risk assessments based on climate projections, rainfall intensity shifts, and sea level rise scenarios. Instead of showing only FEMA-defined zones, FloodFactor highlights risks that may emerge even outside traditional floodplains, which is becoming increasingly common as climate patterns shift. Architects and real estate developers use FloodFactor to understand long-term viability, insurance implications, and resilience requirements of individual parcels. The platform’s straightforward scoring system helps translate scientific complexity into language easily understood by clients and stakeholders.
6. UN Environment “Climate Risk and Adaptation” Portal
The UNEP Climate Risk Portal offers global climate hazard maps, including flood susceptibility, coastal vulnerability, and projected hydrological extremes. With a focus on developing nations and regions where environmental risk assessments may otherwise be inaccessible, this tool supports equitable, data-driven planning. By integrating exposure, sensitivity, and adaptive capacity metrics, the platform helps designers assess not just physical risk, but also social vulnerability. This makes it extremely valuable for humanitarian design, resilient urban planning, and large-scale adaptation policies.
7. EU Copernicus Emergency Management Service

The Copernicus EMS platform provides near-real-time flood monitoring, satellite-based rapid mapping, and detailed historical flood datasets for European regions. It is widely used by governments, environmental agencies, and infrastructure designers. The platform’s ability to deliver high-resolution imagery shortly after a flood event allows planners to assess damage patterns, evaluate disaster responses, and create better preparedness strategies. For architects working in Europe or with multinational clients, Copernicus offers some of the most reliable flood intelligence available.
8. USGS Flood Inundation Mapping

The U.S. Geological Survey provides detailed inundation maps that model water depth, river overflow boundaries, and flood dynamics at a micro-regional scale. These maps are tied to real stream gauge data, giving highly localized and accurate predictions. The tool is especially useful for riverfront projects, bridge planning, and developments in towns with complex hydrological conditions. Because the maps show how water spreads under different flow conditions, architects and civil engineers can make much more precise decisions regarding elevation benchmarks, drainage systems, landscape grading, and emergency access.

Designing for a Changing Planet
Sea level rise and flooding are no longer occasional disruptions—they are central forces shaping the future of urban development, infrastructure planning, and coastal habitation. As climate pressures intensify, the built environment must evolve to be more adaptive, predictive, and resilient. The tools listed above empower architects, planners, and policymakers to visualize uncertainty, quantify risk, and propose informed strategies that protect both people and ecosystems. By embracing these digital platforms, design teams can better anticipate long-term challenges, create structures that stand resilient against extreme conditions, and advocate for responsible planning decisions that ensure communities can thrive in the face of environmental change. In an era where every coastline and river system is undergoing transformation, understanding flood and sea level dynamics is not just a technical requirement — it is a fundamental component of building a safe and sustainable future.


Architecture in Geometry: From Basic Shapes to Complex Forms
Geometry gives architecture its order. This breakdown shows how basic shapes like...

Best Portable Monitors for Architects: 2026 Buying Guide
Portable monitors let architects keep a dual-screen workflow on site visits, in...

Why Custom Kitchens Are Becoming a Must-Have in Modern Homes
Table of Contents Show Designed for the Reality of NYC LivingMaximizing Every...

Designing Physical Brand Touchpoints for Architecture Studios
Table of Contents Show Think Beyond the LogoMatch the Object to the...

Leave a comment