

Bubble Diagram for Residential Projects: From Brief to Layout
A step-by-step look at how a bubble diagram organizes a residential brief into zones, sized room circles, and adjacency links, then how that loose sketch becomes a working floor plan without losing the relationships that matter.

Table of Contents Show
A bubble diagram residential workflow turns a written brief into a loose map of rooms, drawn as circles sized by importance and joined by lines that show how spaces should connect. It sits between programming and the first floor plan, letting you test adjacencies, daylight, and circulation before any wall is fixed.
Every house starts as a list of requirements: bedrooms, a kitchen, somewhere quiet to work, room for the car. That list says nothing about how the rooms relate to one another. The diagram is where you answer that question with the lowest possible commitment, using nothing more than circles and lines you can redraw in seconds. Get this stage right and the floor plan almost lays itself out. Rush it and you carry the wrong relationships forward.
What Is a Bubble Diagram in Residential Design?

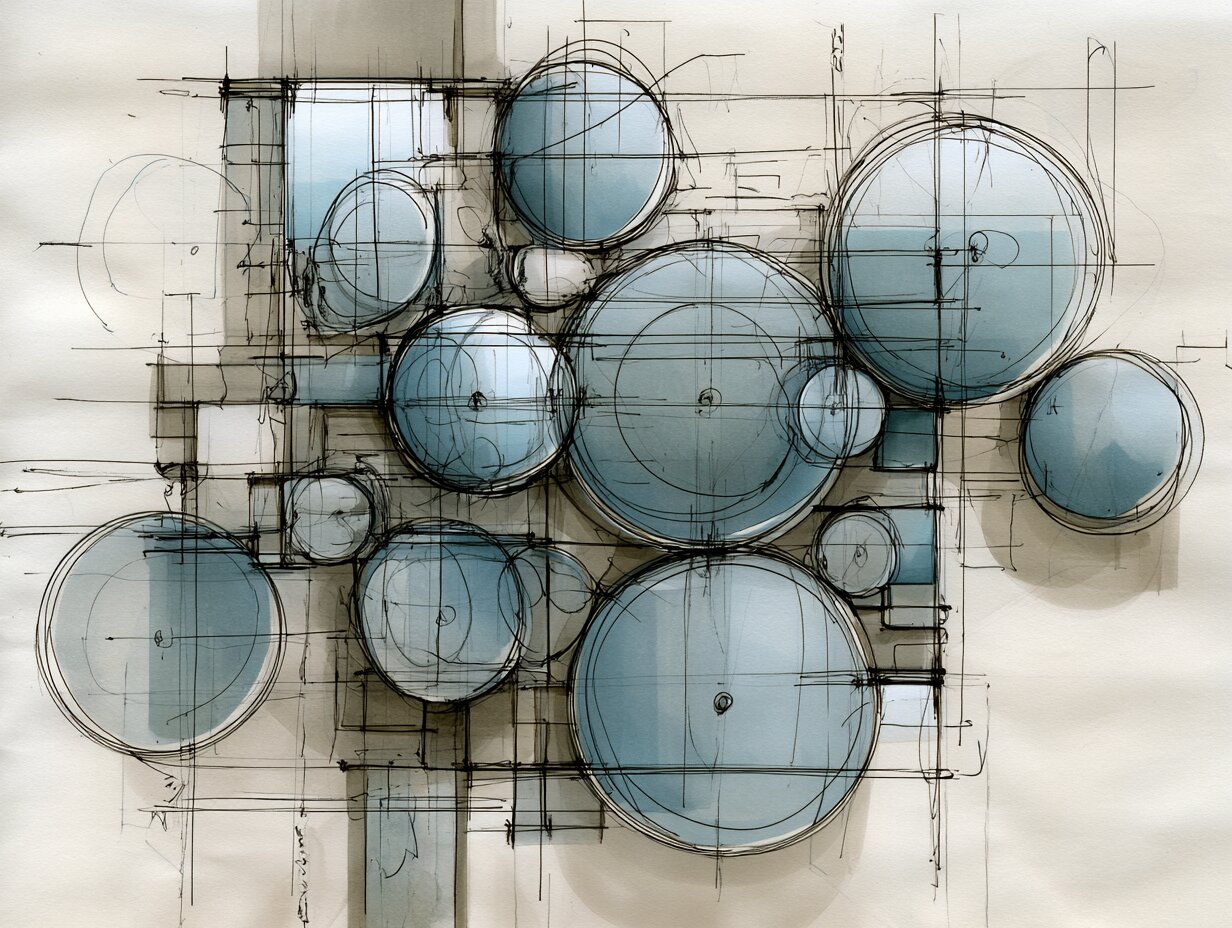
A bubble diagram is a freehand schematic that represents each space as a circle and each relationship as a connecting line. The size of a circle hints at relative floor area or priority, and the distance between circles signals how closely two rooms should sit. It carries no exact dimensions, no scale, and no fixed geometry, which is the point. You are mapping logic, not measurements.
In a house, the diagram captures decisions that are hard to reverse later: whether the kitchen opens to the dining area, how far the primary bedroom sits from the children’s rooms, where the entry filters guests away from private zones. These early choices shape comfort far more than any finish does. For a fuller definition with annotated examples, this guide to architectural bubble diagrams walks through the visual language in detail, and the broader overview of the bubble diagram in architecture sets it against other diagram types.
📌 Did You Know?
According to the Whole Building Design Guide maintained by the National Institute of Building Sciences, programming and these early relationship studies cost a fraction of the total fee, yet they set the criteria that the entire design must satisfy. Decisions made with a pen at this stage are the cheapest you will ever make on the project.
Why Start a Residential Project With a Bubble Diagram?
The reason is speed of iteration. A circle takes a second to move, a drawn wall takes an hour to redraw. By working in abstraction first, you can test ten arrangements of the same brief in the time it would take to draft one plan. You also separate two problems that beginners tend to merge: deciding which rooms belong near each other, and deciding what those rooms look like.
The diagram also gives you a clean way to talk to a client. Homeowners rarely read a scaled plan well, but almost anyone understands that two touching circles mean two connected rooms. That shared picture surfaces disagreements early, while they are still free to fix. The same thinking carries into formal space planning, where adjacency and flow drive the final arrangement.
There is a second payoff. The diagram doubles as a checklist. If a room from the brief has no circle, you spot the omission immediately. If two zones that should never touch end up linked, the stray line warns you. Closely related to this are functional relationship diagrams, which formalize the same adjacency logic into a structured matrix.
How Do You Read a Residential Brief Before Drawing?

Start by turning the brief into a clean list of spaces with a rough area beside each one. Write the kitchen, living room, dining area, each bedroom, bathrooms, entry, utility, garage, and any home office or guest suite. Add the things people forget: storage, circulation, and outdoor rooms like a porch or terrace. This list is your program, and every circle in a bubble diagram residential study traces back to one line on it.
Next, sort each space into a zone. Most houses break into three: public areas where guests are welcome, private areas reserved for the family, and service areas that support the house. Tag every room with its zone before you draw, because the zones become the large groupings the diagram has to keep apart.
💡 Pro Tip
Before any circle goes down, ask the client to name the three spaces they care about most and the two pairs of rooms they never want adjacent. Those five answers fix the anchors of the whole diagram and stop you from drawing a layout the client will quietly reject at the first review.
Finally, note any hard constraints the site imposes: the direction of the best daylight, the street side, the view, the slope. These pull certain rooms toward certain edges and give your circles a sense of orientation before you ever place them on a real plan.
How to Create a Bubble Diagram Step by Step
The process moves from the largest groupings down to single rooms. Work loosely and resist the urge to make it neat, because a tidy diagram usually means you stopped exploring too early.
Step 1: Place the Zones
Draw three or four large, light circles for your public, private, and service zones. Position them roughly the way they should fall on the site, with the public zone near the entry and the private zone tucked toward the quiet edge. Everything else nests inside these.
Step 2: Drop in the Rooms
Inside each zone, draw a smaller circle for every room from your program. Size each circle to reflect its relative area, so the living room reads larger than a bathroom. Keep them rough. The goal is relationship, not geometry.
Step 3: Connect the Relationships
Draw lines between rooms that need a direct link. A solid line marks a strong, daily connection such as kitchen to dining. A dashed line marks a weaker or occasional link. Where two rooms must stay apart, leave them unconnected and physically distant on the page.
Step 4: Add Circulation and Entry
Mark the front door, the main circulation spine, and any secondary access like a garage or rear door. Circulation is a space too, and houses that ignore it end up with rooms you can only reach by walking through another room.
💡 Pro Tip
Redraw the whole diagram three times rather than editing one version to death. Each fresh pass forces you to question placements you would otherwise leave untouched, and the third version is almost always cleaner than the first. Experienced architects treat the early sketch as disposable on purpose.
The Process at a Glance
This table sums up the four steps, the action behind each, and what you should have on the page once it is done.
| Step | Action | Output |
|---|---|---|
| 1. Zones | Draw large circles for public, private, and service areas | Three or four grouping bubbles placed by orientation |
| 2. Rooms | Add a sized circle for each space in the program | Every room represented inside its zone |
| 3. Links | Connect rooms with solid or dashed lines | Adjacency map showing strong and weak ties |
| 4. Circulation | Mark entry, spine, and secondary access | A readable flow from door to private rooms |
If you prefer to work on screen, the free bubble diagram maker lets you label circles, adjust sizes, and export the result, and this step-led tutorial on how to design a bubble diagram covers the same sequence with worked examples.
Reading the Symbols and Line Types

A diagram only works if everyone on the team reads it the same way. The conventions below are widely used, though no single global standard governs them, so it pays to add a small key in the corner of every sheet.
📐 Technical Note
Line weight carries meaning as well as line style. A heavier solid line can flag a connection that must be direct and step-free, such as the path from a primary bedroom to its bathroom, while a light line marks a softer adjacency. Set these conventions once at the start of a project and apply them on every diagram so the team reads them without a legend.
| Symbol | Meaning | Typical Use in a House |
|---|---|---|
| Large circle | Major space or zone | Living area, primary suite, public zone |
| Small circle | Minor or support space | Powder room, pantry, closet |
| Solid line | Strong, daily connection | Kitchen to dining, bedroom to bathroom |
| Dashed line | Weak or occasional link | Garage to mudroom, office to entry |
| Arrow | Direction of movement or view | Entry flow, sight line to a garden |
From Bubble Diagram to Floor Plan Layout
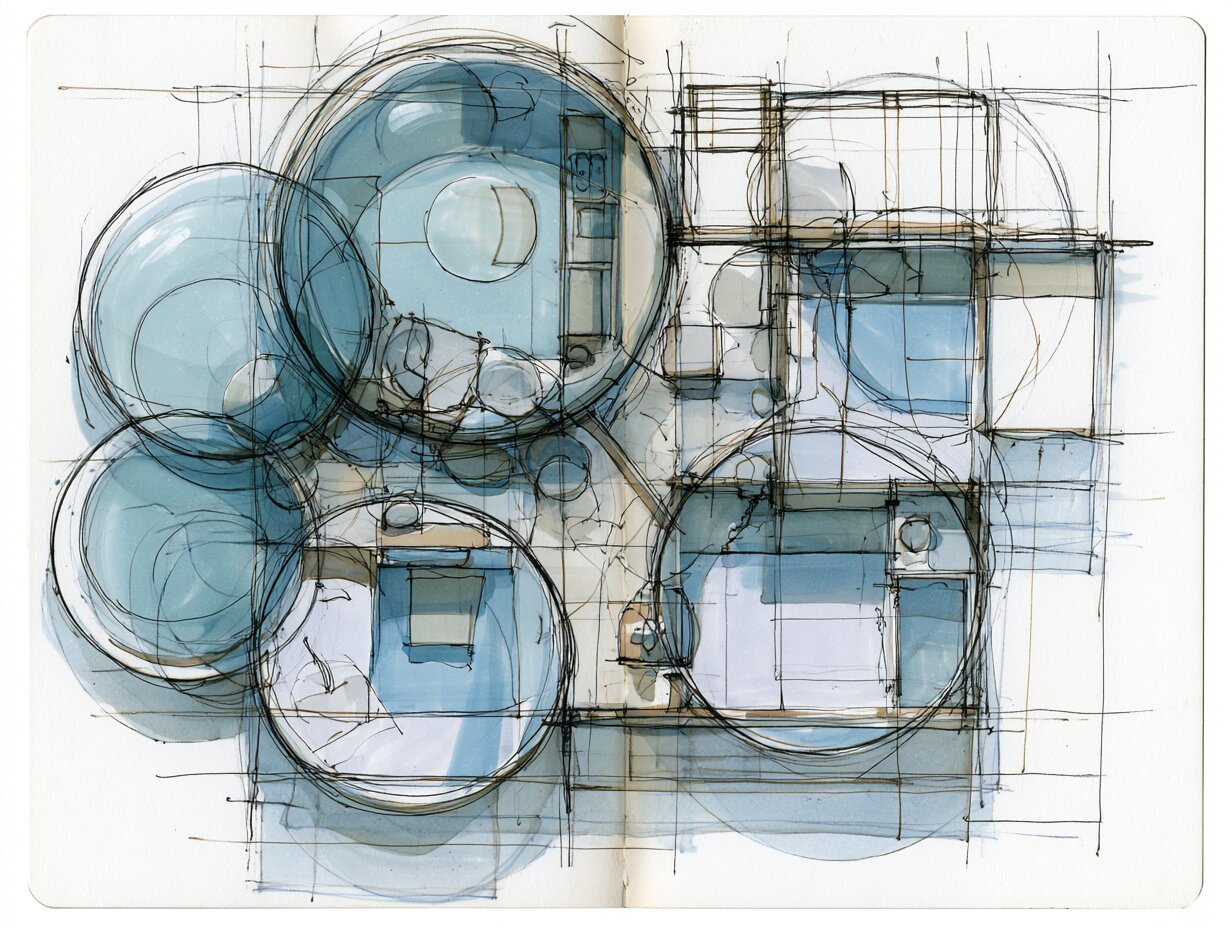
The handoff is where the abstraction becomes architecture. Lay your diagram beside the site plan and start converting circles into rough rectangles that respect real proportions and structural sense. A bubble does not have to become a single room, and one large public circle often resolves into an open kitchen, dining, and living sequence under one roof.
A bubble diagram residential layout keeps the relationships fixed even as the shapes change. If the diagram links the kitchen to the dining area with a solid line, that connection survives into the plan no matter how the walls fall. Test daylight next: rooms used in the morning lean east, living spaces often chase afternoon and evening light. As the rectangles firm up, you are building a true floor plan, and the same adjacency logic feeds the zoning diagrams that group those spaces at building scale.
⚠️ Common Mistake to Avoid
A frequent error is treating the diagram as a scale drawing in disguise and forcing circles onto a grid before relationships are settled. The bubble stage exists precisely to stay loose. Lock the geometry too early and you trade away the flexibility that makes the method useful, then spend the schematic phase undoing decisions you never needed to make.
Industry references frame this same flow under the heading of programming. The overview of architectural programming from the Whole Building Design Guide explains how a documented program feeds the schematic stage, and Autodesk’s notes on architectural programming show how that same data later drives digital tools. For the broader visual idea, a bubble chart uses circle size to encode value in much the same spirit, and the conventions of a finished floor plan mark the endpoint your diagram is heading toward.
Where to Go From Here
The bubble diagram earns its place because it is fast, honest, and easy to throw away. It forces the right questions about how a home should live before you commit a single dimension, and it gives clients a picture they can actually argue with. Treat it as a thinking tool, not a deliverable, and the layout that follows feels close to inevitable rather than forced.
Your Next Step: Take your current brief, list every space on one sheet, and sketch three different bubble diagrams from it in the next hour, redrawing rather than erasing, then carry only the strongest one into a rough plan.
Frequently Asked Questions
What is a bubble diagram in residential architecture?
It is an early schematic that shows the rooms of a house as circles and their relationships as connecting lines. It carries no scale or fixed geometry. Its job is to test which spaces should sit near each other before you draw a measured floor plan.
How big should each bubble be?
Size each circle to reflect a room’s relative importance or rough floor area, not an exact measurement. A living room should read clearly larger than a powder room. The point is proportion at a glance, so keep the sizing loose and comparative rather than precise.
Do I draw a bubble diagram by hand or on a computer?
Both work. Hand sketching is fastest for the first rough passes and keeps you from fussing over neatness. Digital tools help when you want to relabel, resize, or share the diagram with a client, and a free online maker lets you export a clean version for review.
What comes after the bubble diagram?
The diagram feeds the schematic design phase, where circles become rough room shapes on a real site plan while the relationships stay fixed. From there the layout firms into a scaled floor plan, and the adjacency logic carries forward into zoning and circulation studies.
- architectural bubble diagram
- Architectural Diagram Types
- Bubble Diagram
- Bubble Diagram Architecture
- bubble diagram creator
- bubble diagram for interior design
- bubble diagram in interior design
- bubble diagram maker
- bubble diagram residential
- bubble diagrams
- interior design bubble diagram
- Residential Architecture


Spatial Organization Diagrams in Architecture: Types, Examples, and How to Choose
This guide breaks down the five core types of spatial organization diagrams...

Bubble Diagram School Design: A Step by Step Guide for Educational Buildings
A practical look at bubble diagram school design for educational buildings. It...

Understanding Architectural Functional Relationship Diagrams: A Practical Guide
Functional relationship diagrams are essential planning tools that architects use during the...

Massing Diagram Architecture: A Practical Guide to Building Form Studies
Massing diagrams are the first visual step in turning an architectural program...

Leave a comment