
Free Online Massing Diagram Maker for Architecture
Everything this massing diagram maker does, free, no account, nothing to install
- Blocks drawn to scale in metres or feet: drag a footprint, rotate it, stack it on another block, give it a flat, gable or shed roof.
- Floors, floor height and use for every block, from eleven uses with their own colours, plus existing neighbours and landscape volumes that stay out of your area figures.
- A live axonometric next to the plan: isometric or plan oblique, turned in 90 degree steps, with floor lines and labels.
- Sun shadows on the ground for any latitude, date and solar time.
- The figures that decide a scheme: gross floor area by use, footprint, site coverage, FAR, maximum height and floors, with a warning when volumes overlap.
- Up to four options on the same site, compared side by side in one table.
- PNG, SVG and PDF sheets with plan, axonometric, figures and legend, plus CSV, JSON and a share link. Nothing is uploaded.
Massing diagrams in brief
A massing study answers three questions before anyone draws a floor plan: how much can go on the site, how tall it gets, and what it does to the light around it. A massing diagram shows the building as plain volumes, with no windows, materials or structure, only the shape and size of what is built. It is the drawing where a brief turns into an envelope: you use it to test how much floor area fits, how the volumes sit against the street and the neighbours, where the open space ends up and how the height changes across the site. The guide to massing diagrams in architecture covers the drawing type in depth; this page is about making one quickly and reading its numbers correctly.
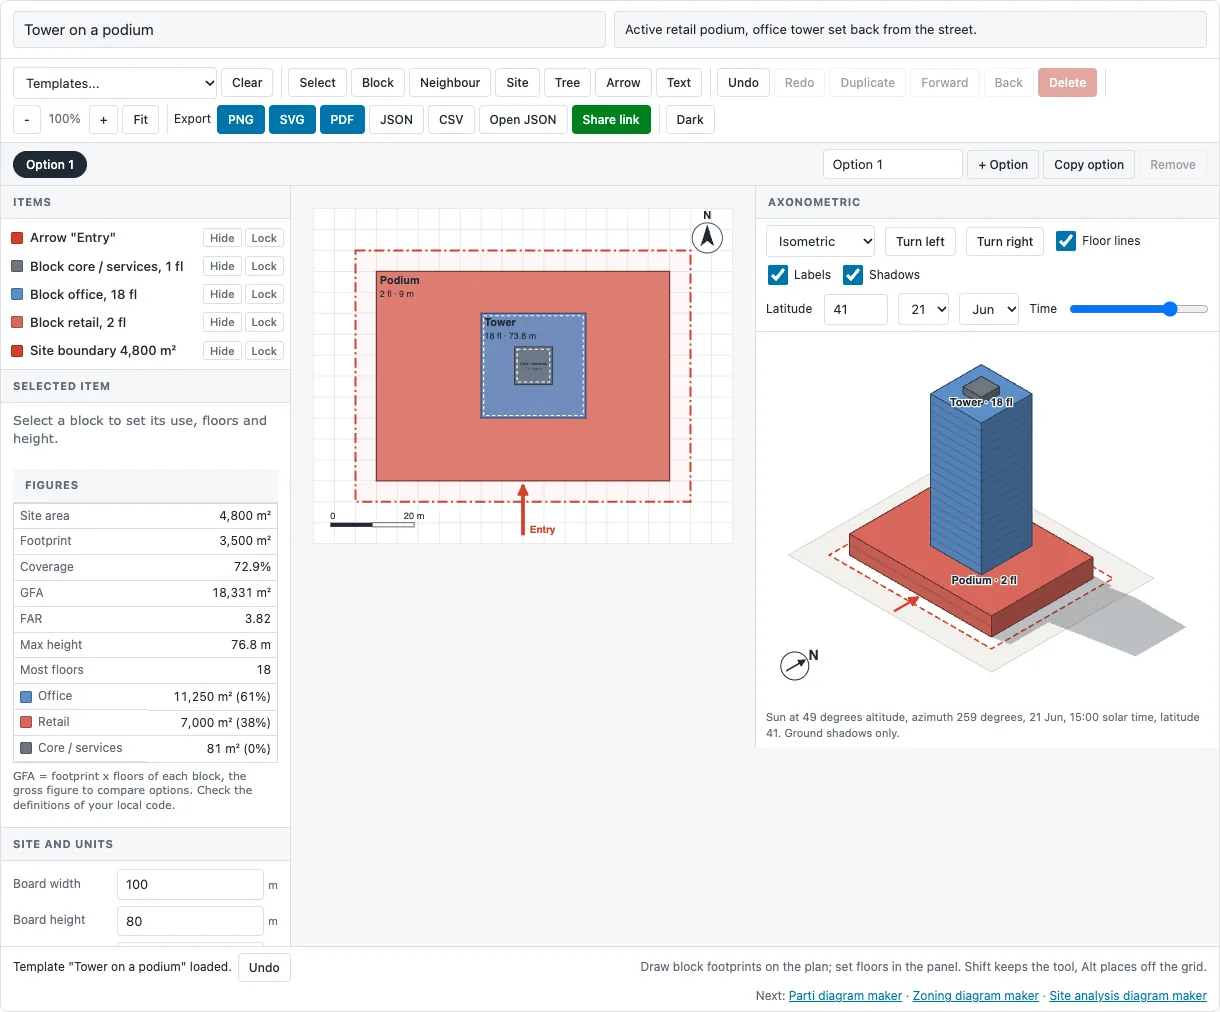
This tool keeps the plan and the volume side by side. You draw footprints on a scaled site plan, where dimensions are easy to control, and the axonometric next to it updates with every change: the blocks, their floor lines, their roofs and the shadows they cast. Below them, the figures panel tells you what the scheme adds up to.
How to use this massing diagram maker
- Set the board. Under Site and units, choose metres or feet and set the board a little larger than your plot. Set North if north is not straight up on your plan.
- Draw the site. Pick Site and click each corner of the plot. Click the first corner, or the last one again, to close it. The site area appears in Figures, and coverage and FAR start to read.
- Block the buildings. Pick Block and drag a footprint. In the panel, set the use, the number of floors and the floor height. Drag the handles to resize and the round handle to rotate.
- Stack. Draw a smaller block over a bigger one and press Stack on top: its underside moves to the top of the block below. This is how you build a tower on a podium or a set back upper storey.
- Add the context. Use Neighbour for existing buildings around the site. They are drawn in grey, cast shadows and are left out of your area figures. Add trees and the entrance arrow while you are there.
- Read the axonometric. Turn the view, switch to plan oblique, set the latitude, date and time, and see where the shadows land. Click any block in the axonometric to select it on the plan.
- Export. PNG or PDF for a presentation sheet, SVG to keep drawing over it, CSV for the area schedule, JSON to continue later.
Reading the figures
The figures panel recalculates with every change. Each figure has a precise meaning, and it is worth knowing exactly what the tool counts.
| Figure | How it is calculated |
|---|---|
| Site area | The area inside every site boundary you drew |
| Footprint | Ground area covered by blocks that start at ground level; overlaps counted once, raised blocks not added |
| Coverage | Footprint divided by site area |
| GFA | Footprint of each proposed block multiplied by its floors, added up; neighbours and landscape volumes excluded |
| FAR | GFA divided by site area (also called plot ratio or floor space index) |
| Max height | The highest point of any proposed block, roof included |
A FAR of 2 means twice the site area in floor space, whether as two full floors or eight floors on a quarter of the plot. That is why FAR and coverage belong together: the same FAR reads as a low, dense carpet at high coverage and as a tower in open ground at low coverage. Building codes define these terms in their own ways. Some leave out parking, plant rooms, balconies or basements, and some measure height to the eaves rather than the ridge. Treat the figures as a consistent way to compare options, then check the result against the definitions that apply to your site. If two blocks overlap in volume, the panel warns you, because their shared floors would be counted twice.
A worked example: tower on a podium
The default template is a mixed use scheme: a two storey retail podium covering most of the site, an eighteen storey office tower set back from the street on top of it, and a small plant room on the roof of the tower. Each block carries its own floor height, 4.5 m for the shops and 3.6 m for the offices, and the tower and the plant room were placed with Stack on top, so they start exactly where the block below ends.
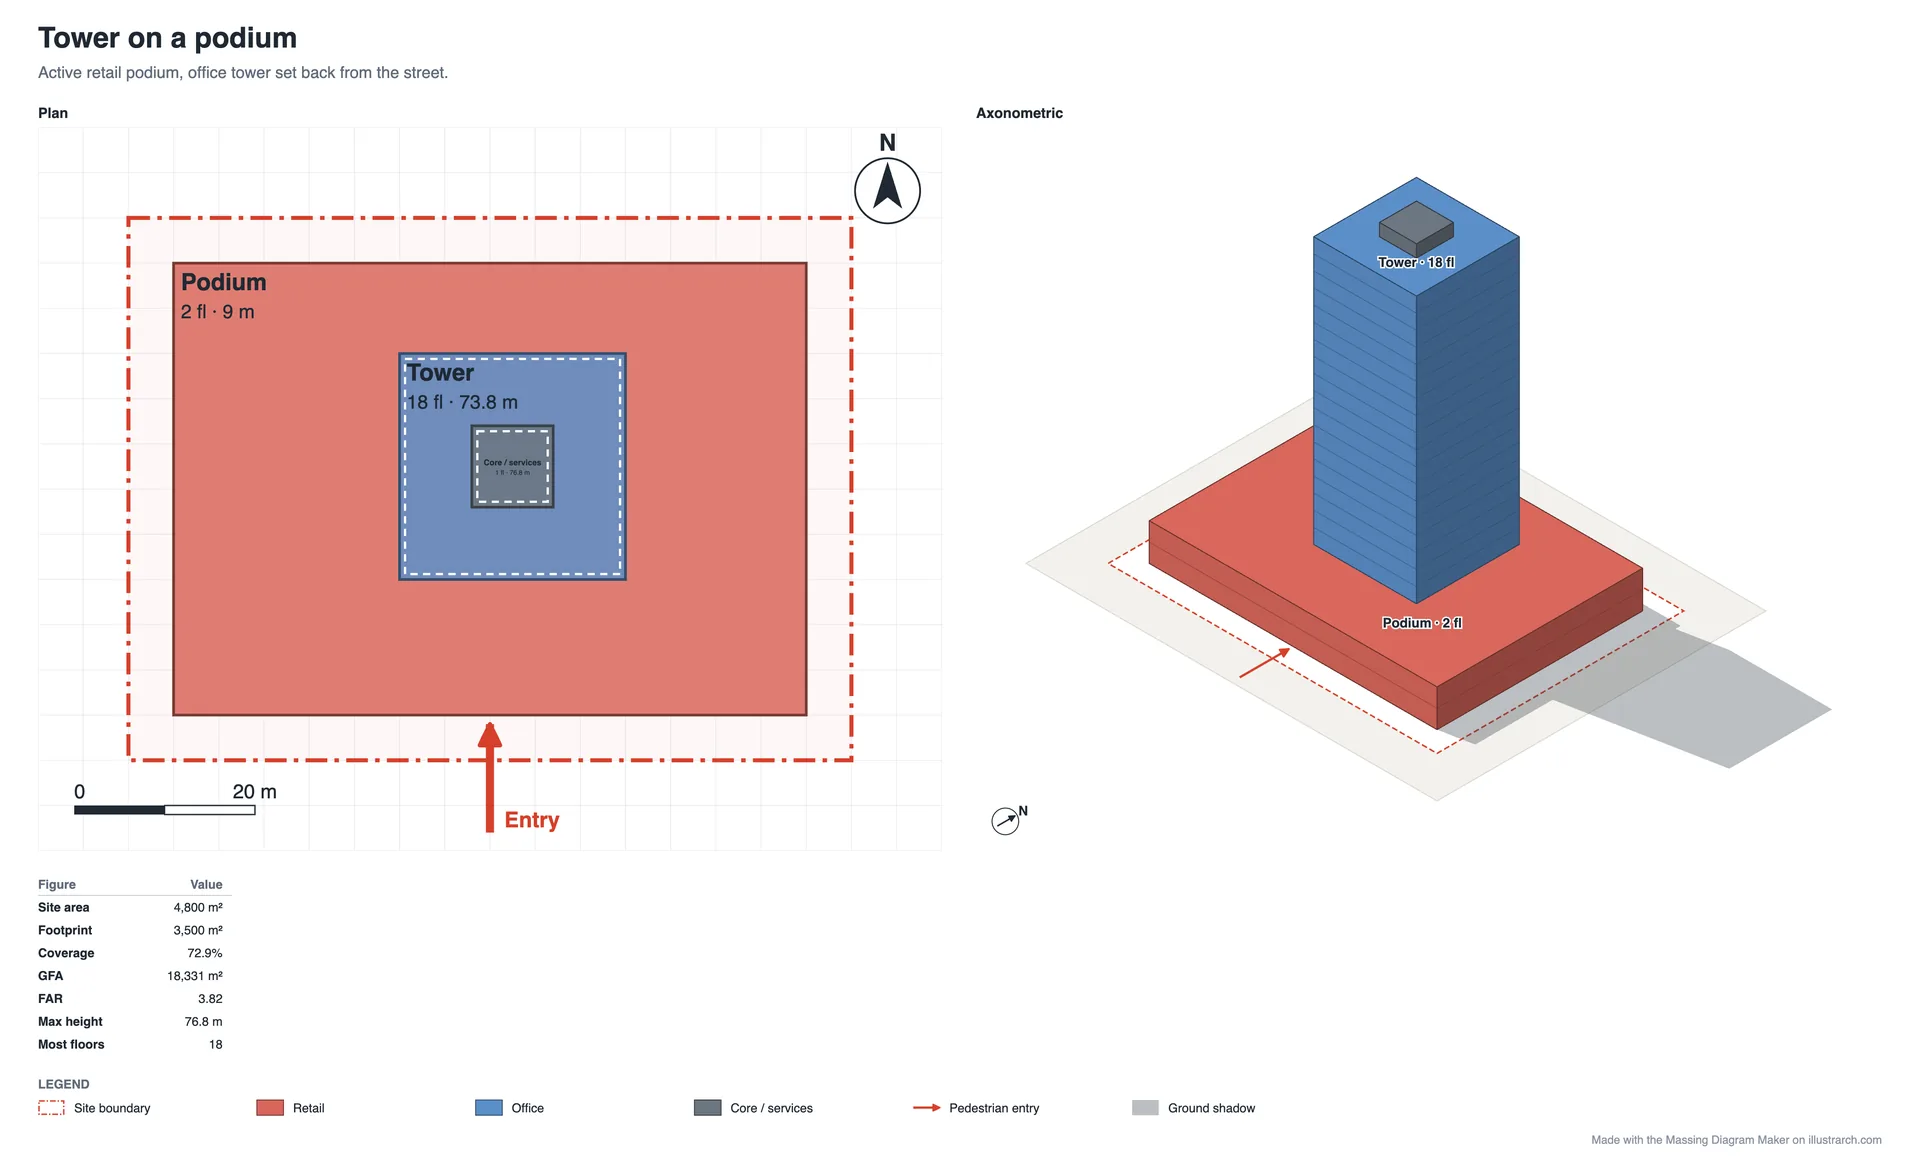
Read the figures from the sheet: on a 4,800 m² site the scheme reaches 18,331 m² of gross floor area, a FAR of 3.82 with 72.9% coverage and a maximum height of 76.8 m. The podium holds 38% of the floor area and the tower 61%. In the plan, the tower’s label moves to its corner because the plant room covers its centre; in the axonometric, the floor lines make the two floor heights visible at a glance.
Isometric or plan oblique
The isometric view draws the three axes at equal angles, so every direction is shortened by the same amount. It is the most balanced view of a whole scheme. The plan oblique view keeps the plan undistorted, turned 45 degrees, and draws heights straight up. It reads more like a model on a table and lets you compare the plan and the axonometric directly. Turn left and Turn right rotate the view in 90 degree steps so you can check the side that faces away from you. Labels can be switched off for a cleaner image, and floor lines can be hidden when you want plain volumes.
Sun and shadows
Shadows are calculated from the latitude of the site, the date and the solar time. Solar time puts the sun due south (or due north in the southern hemisphere) at 12:00, so it can differ from clock time by up to an hour or more depending on your time zone and daylight saving. The sun position uses a standard declination formula that is accurate to about a degree, the right precision for a massing study. The tool draws shadows on the ground only; a shadow falling on another roof is shown on the ground beneath it.
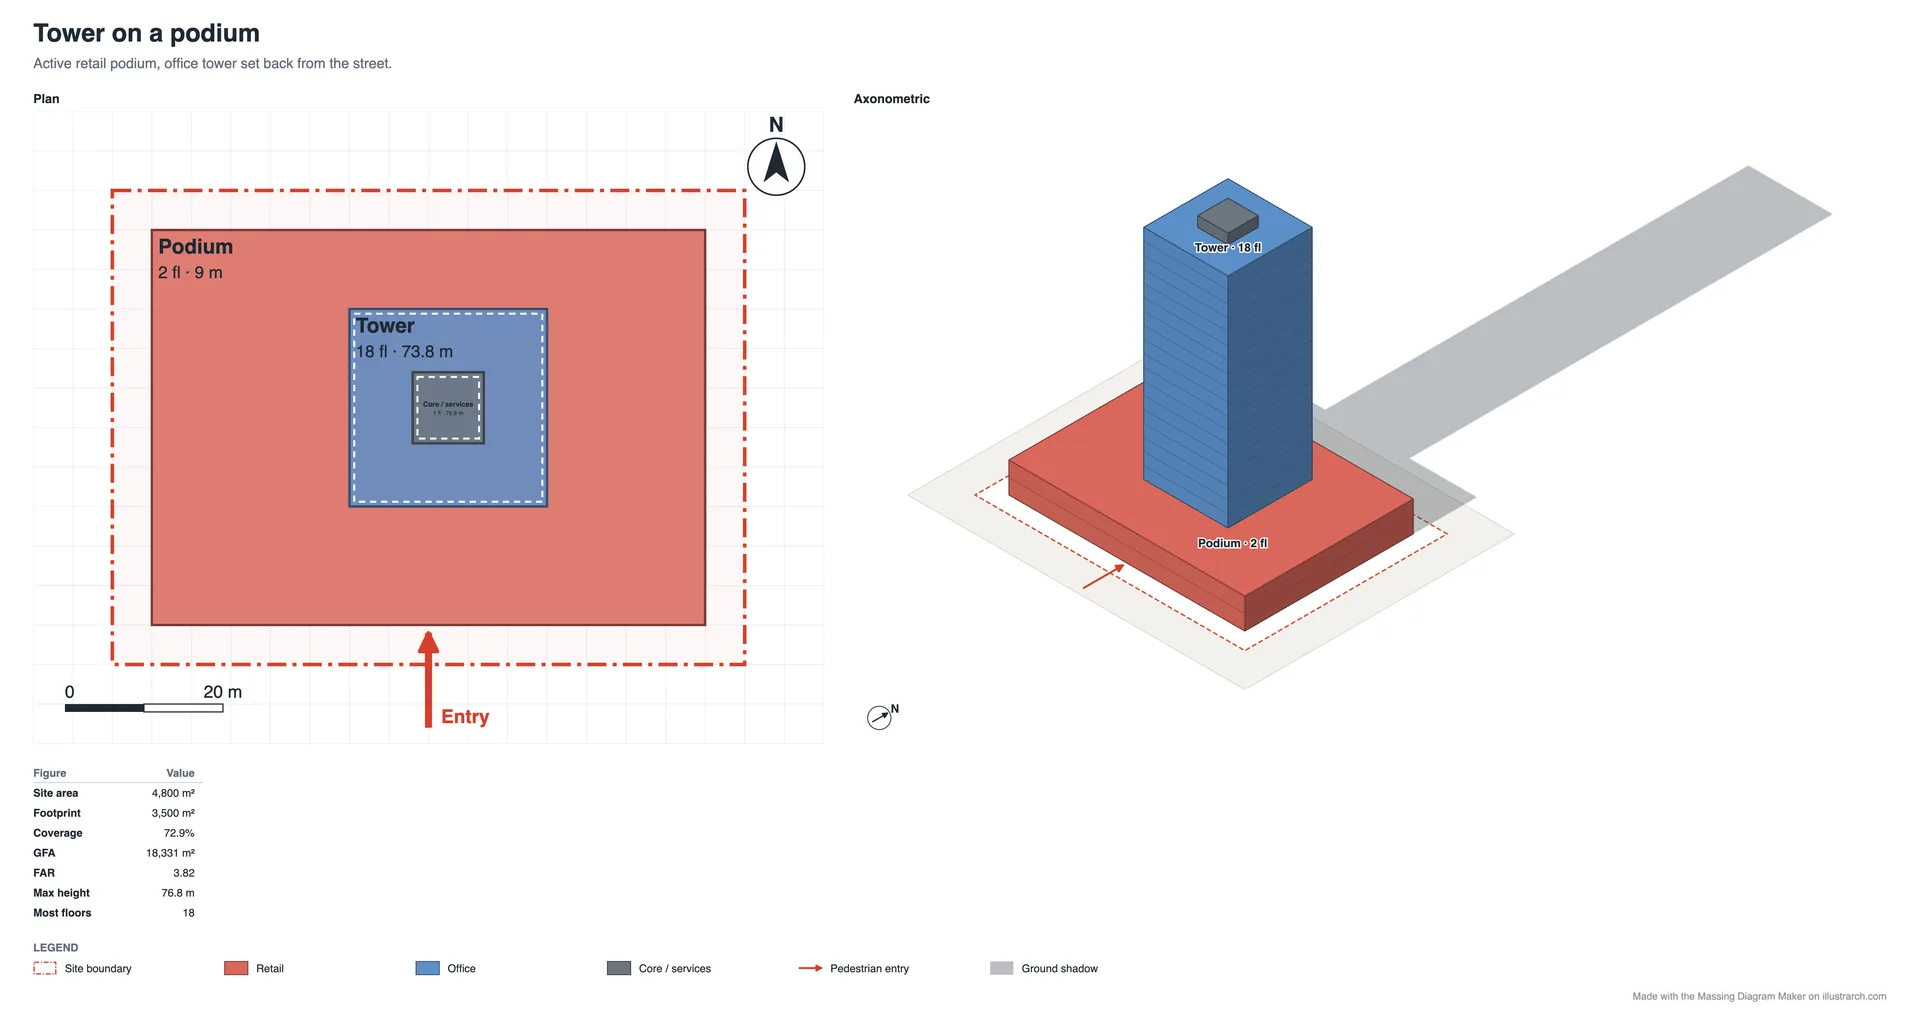
The same tower at noon on 21 December, at latitude 41° north, shows why the winter solstice is the test that matters. The sun stands only about 26 degrees above the horizon, so every shadow is roughly twice as long as the building is tall; at 15:00 on 21 June the same tower casts a shadow shorter than its own height. If a neighbour’s garden or a public square sits in that long winter shadow, look at the shape and position of the blocks before you look at the facades. For the theory behind the sun’s path, read the guide to the sun path diagram and the article on light and shadow in architecture.
Comparing options
A massing study is rarely one scheme. Press Copy option to duplicate the current one and change it, or + Option for an empty one, up to four. Rename them in the box next to the tabs. As soon as there are two options, a table under the drawing lists site area, footprint, coverage, GFA, FAR, height and floors for each one side by side, and the export shows every option as an axonometric with the same table underneath.
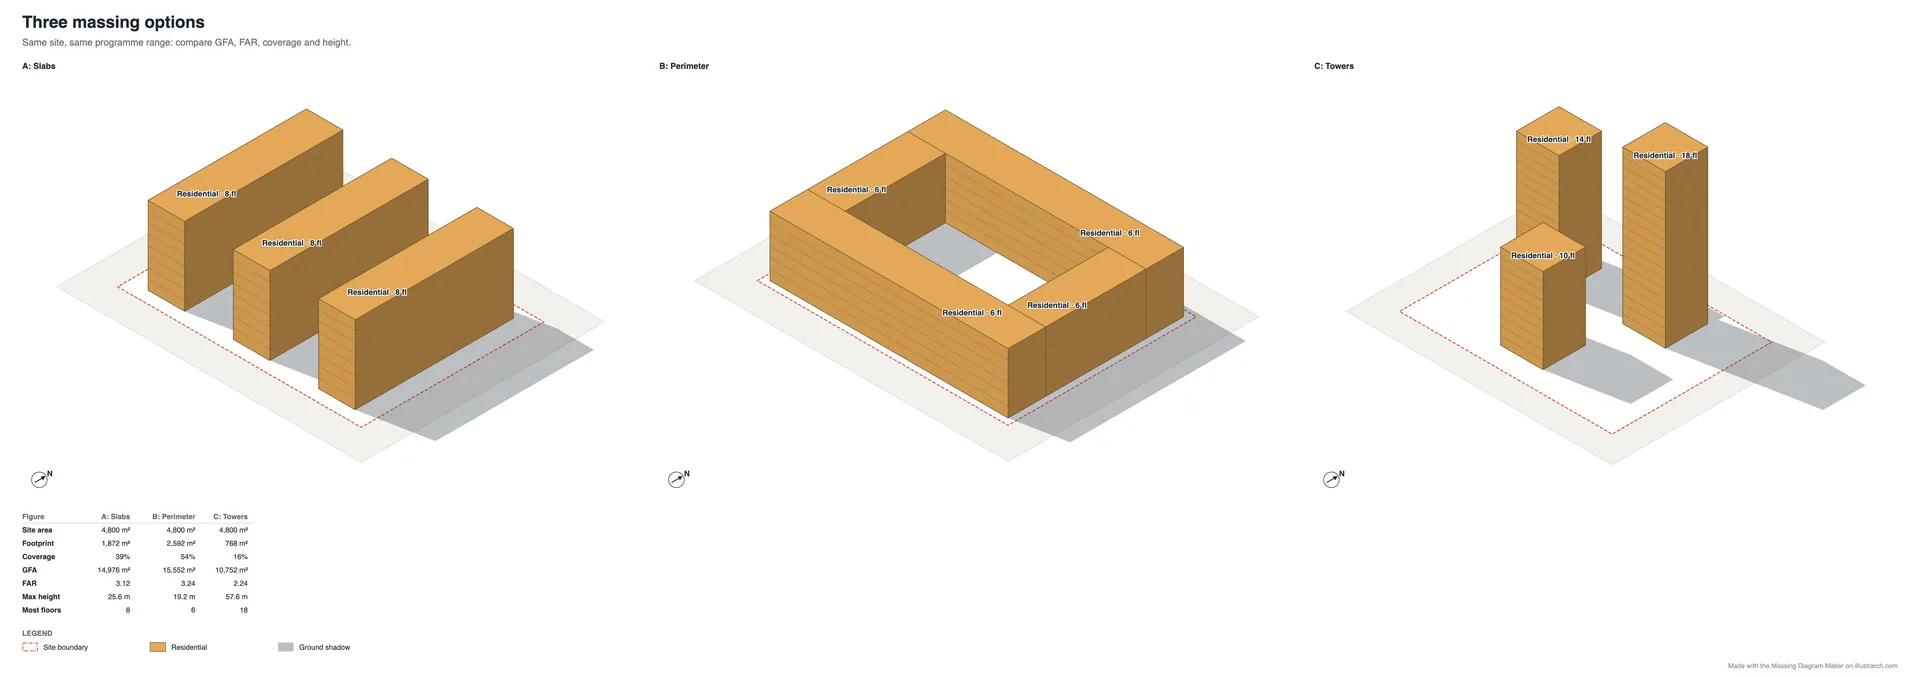
The Three options for one site template puts three common housing strategies on the same 4,800 m² plot:
| Option | GFA | FAR | Coverage | Max height | Floors |
|---|---|---|---|---|---|
| A: Slabs | 14,976 m² | 3.12 | 39% | 25.6 m | 8 |
| B: Perimeter | 15,552 m² | 3.24 | 54% | 19.2 m | 6 |
| C: Towers | 10,752 m² | 2.24 | 16% | 57.6 m | 18 |
The perimeter block delivers the most floor area at the lowest height but covers more than half the site; the towers leave 84% of the ground open but reach more than twice the height for two thirds of the floor area. None of the three is right in general. The table makes the trade off explicit, which is the point of the exercise.
Seven starting points
Every template is an ordinary study you can change. These are the ones that show a particular massing idea most clearly.
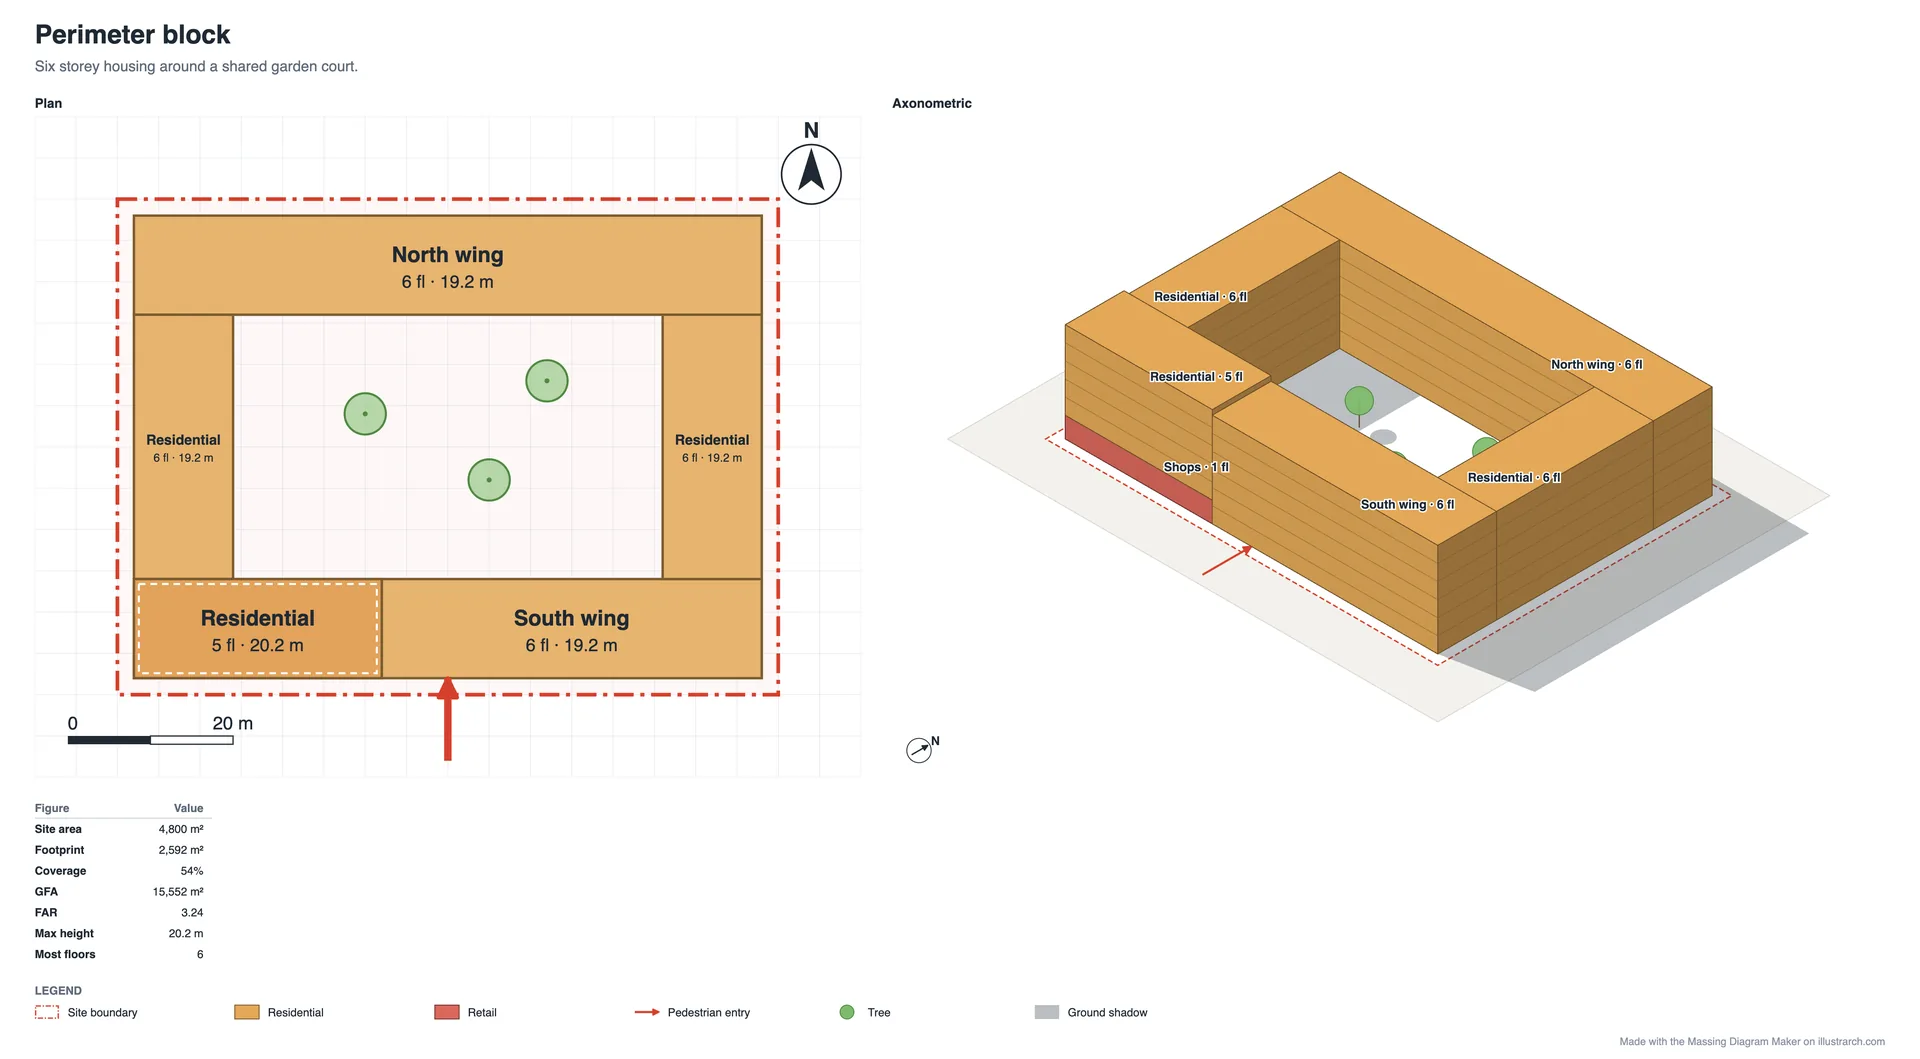
Perimeter block
Six storey housing wraps a shared garden court, with shops on one corner of the ground floor and five storeys of housing stacked above them. The court is protected from the street, and the axonometric shows how much of it the surrounding wings shade.
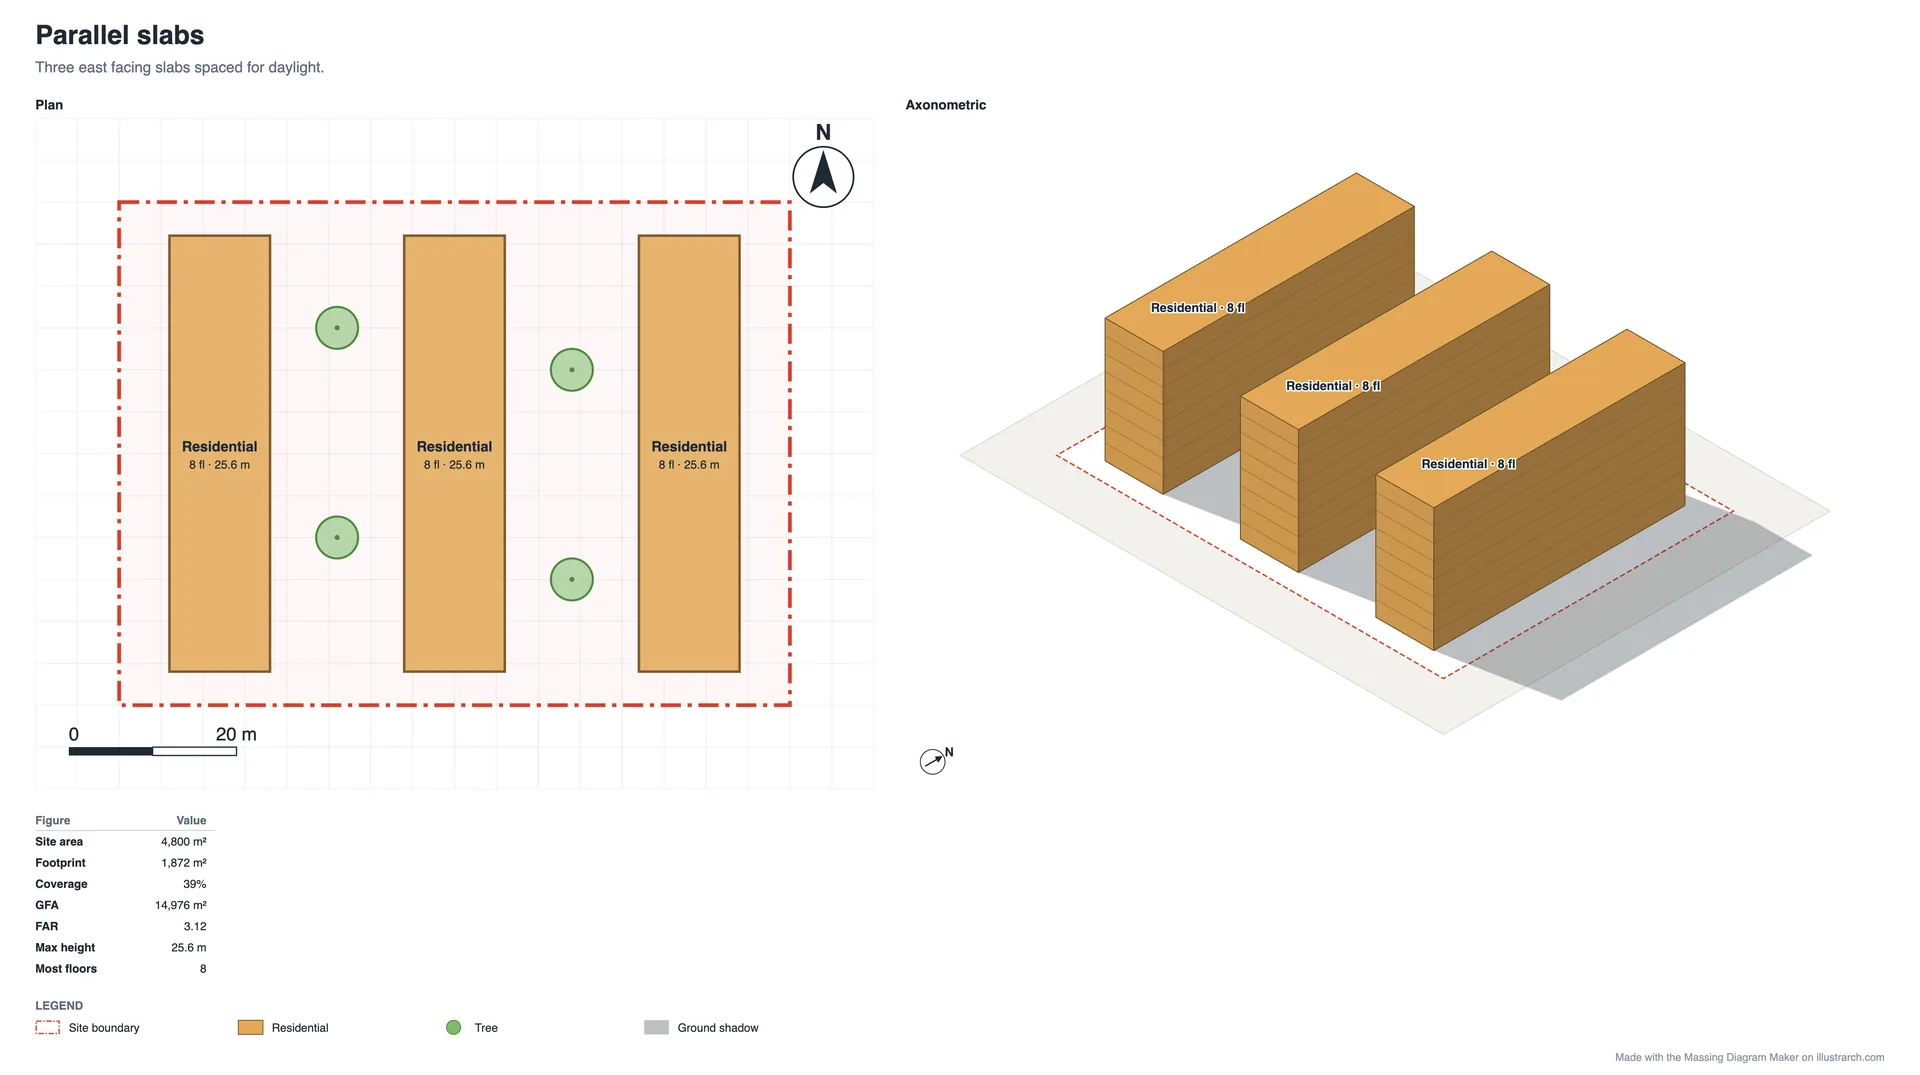
Parallel slabs
Three eight storey slabs run north to south, so their long facades face east and west and receive morning or afternoon sun. Slabs are efficient to build and easy to phase, but the space between them needs a purpose or it becomes leftover ground.
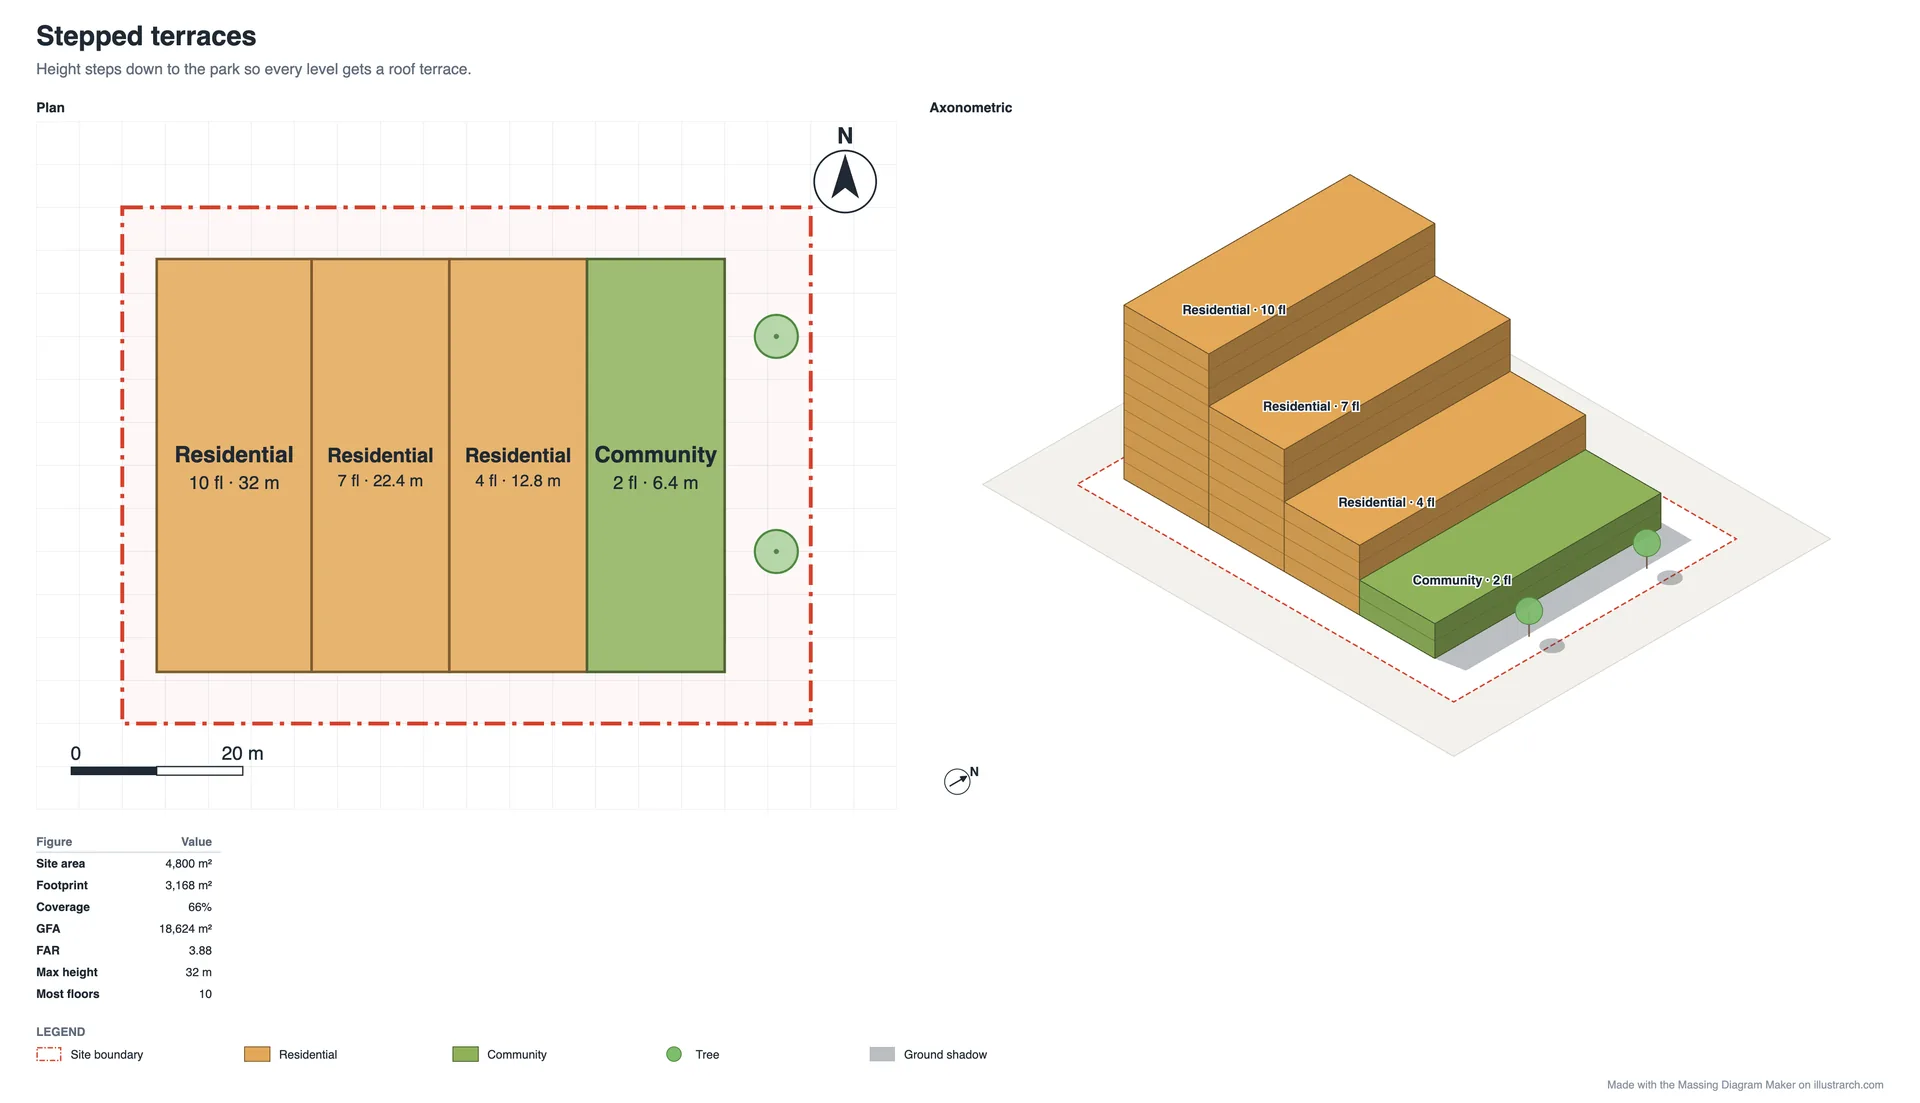
Stepped terraces
Height falls from ten storeys to two towards the park, so every level gets a roof terrace and the tallest part sits furthest from the open space it overlooks. The figures show what the stepping costs: a FAR of 3.88 at 66% coverage, where the same footprint at ten storeys throughout would reach a FAR of 6.6.
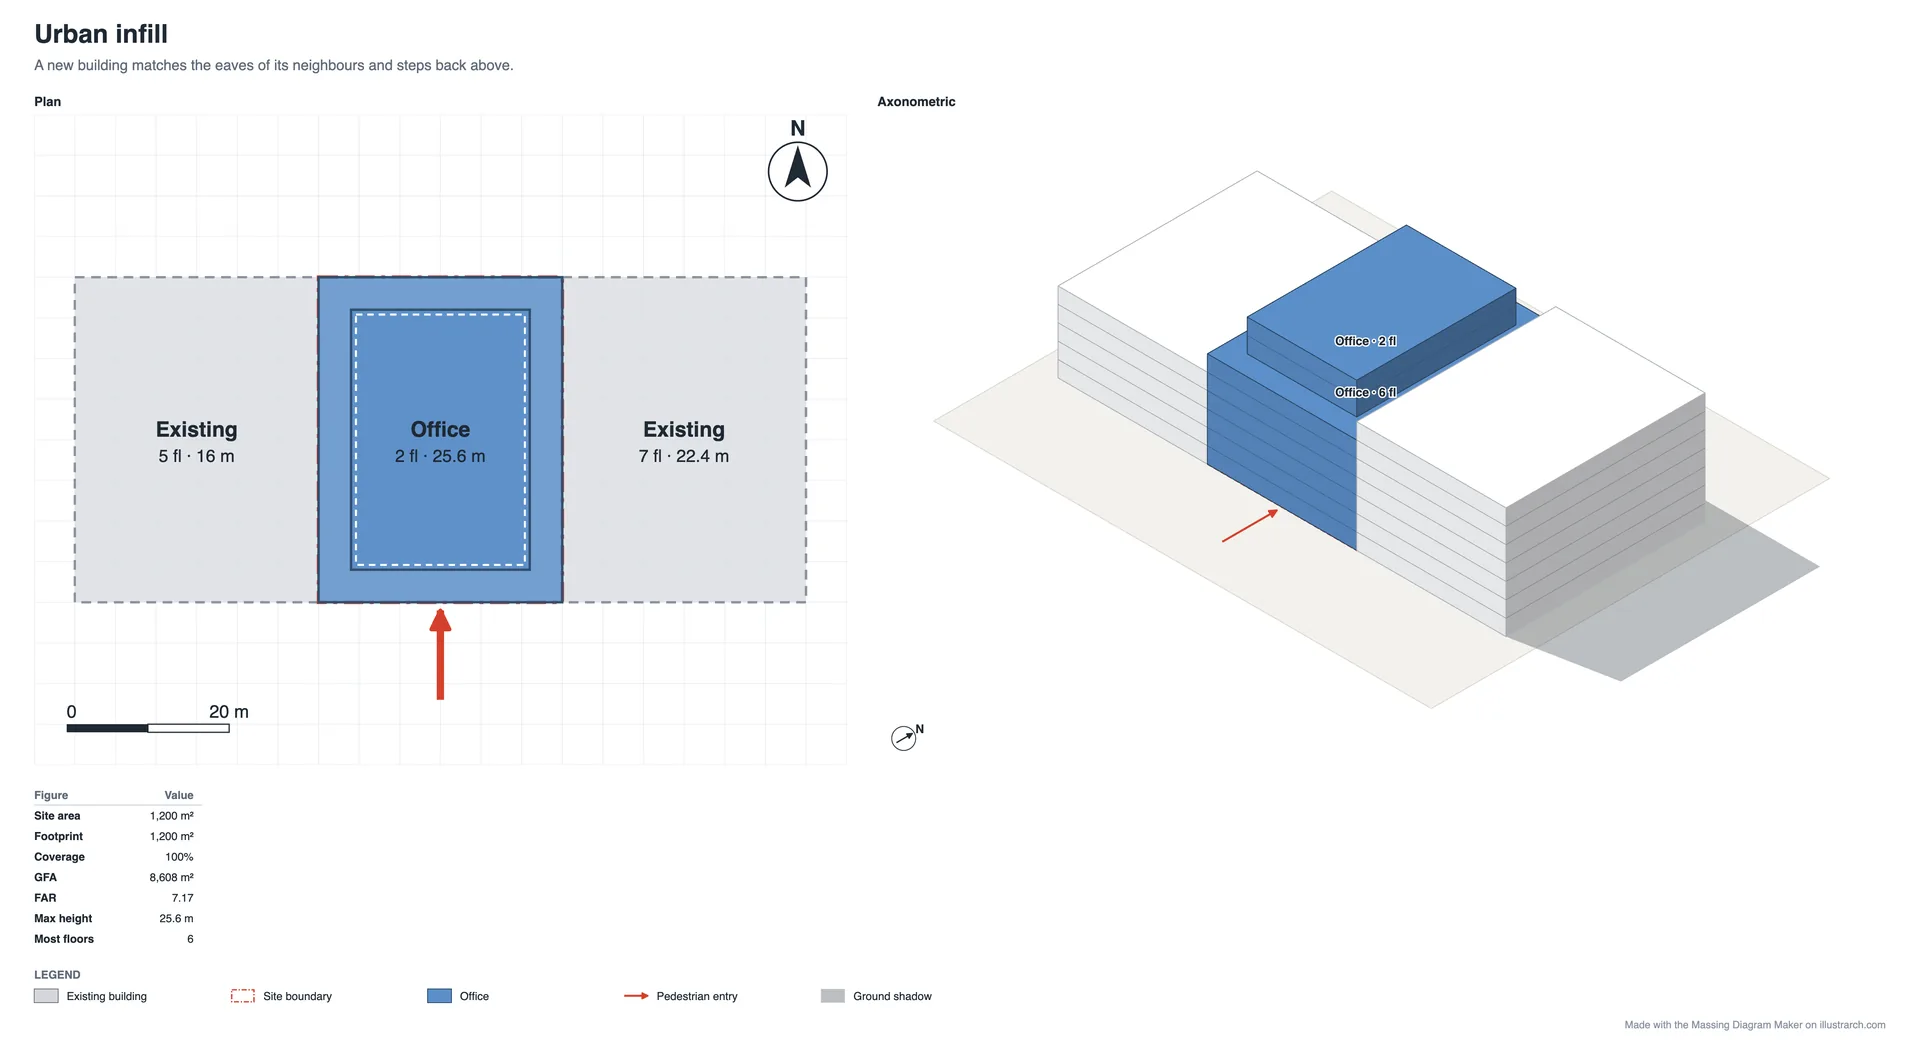
Infill between neighbours
A new office building fills a 30 m gap between two existing buildings, sits between the heights of its five and seven storey neighbours with six storeys, and steps back for two more above them. Because the site is fully built, coverage reads 100% and the FAR of 7.17 comes almost entirely from height. The neighbours, drawn with Neighbour, cast shadows but stay out of the figures.
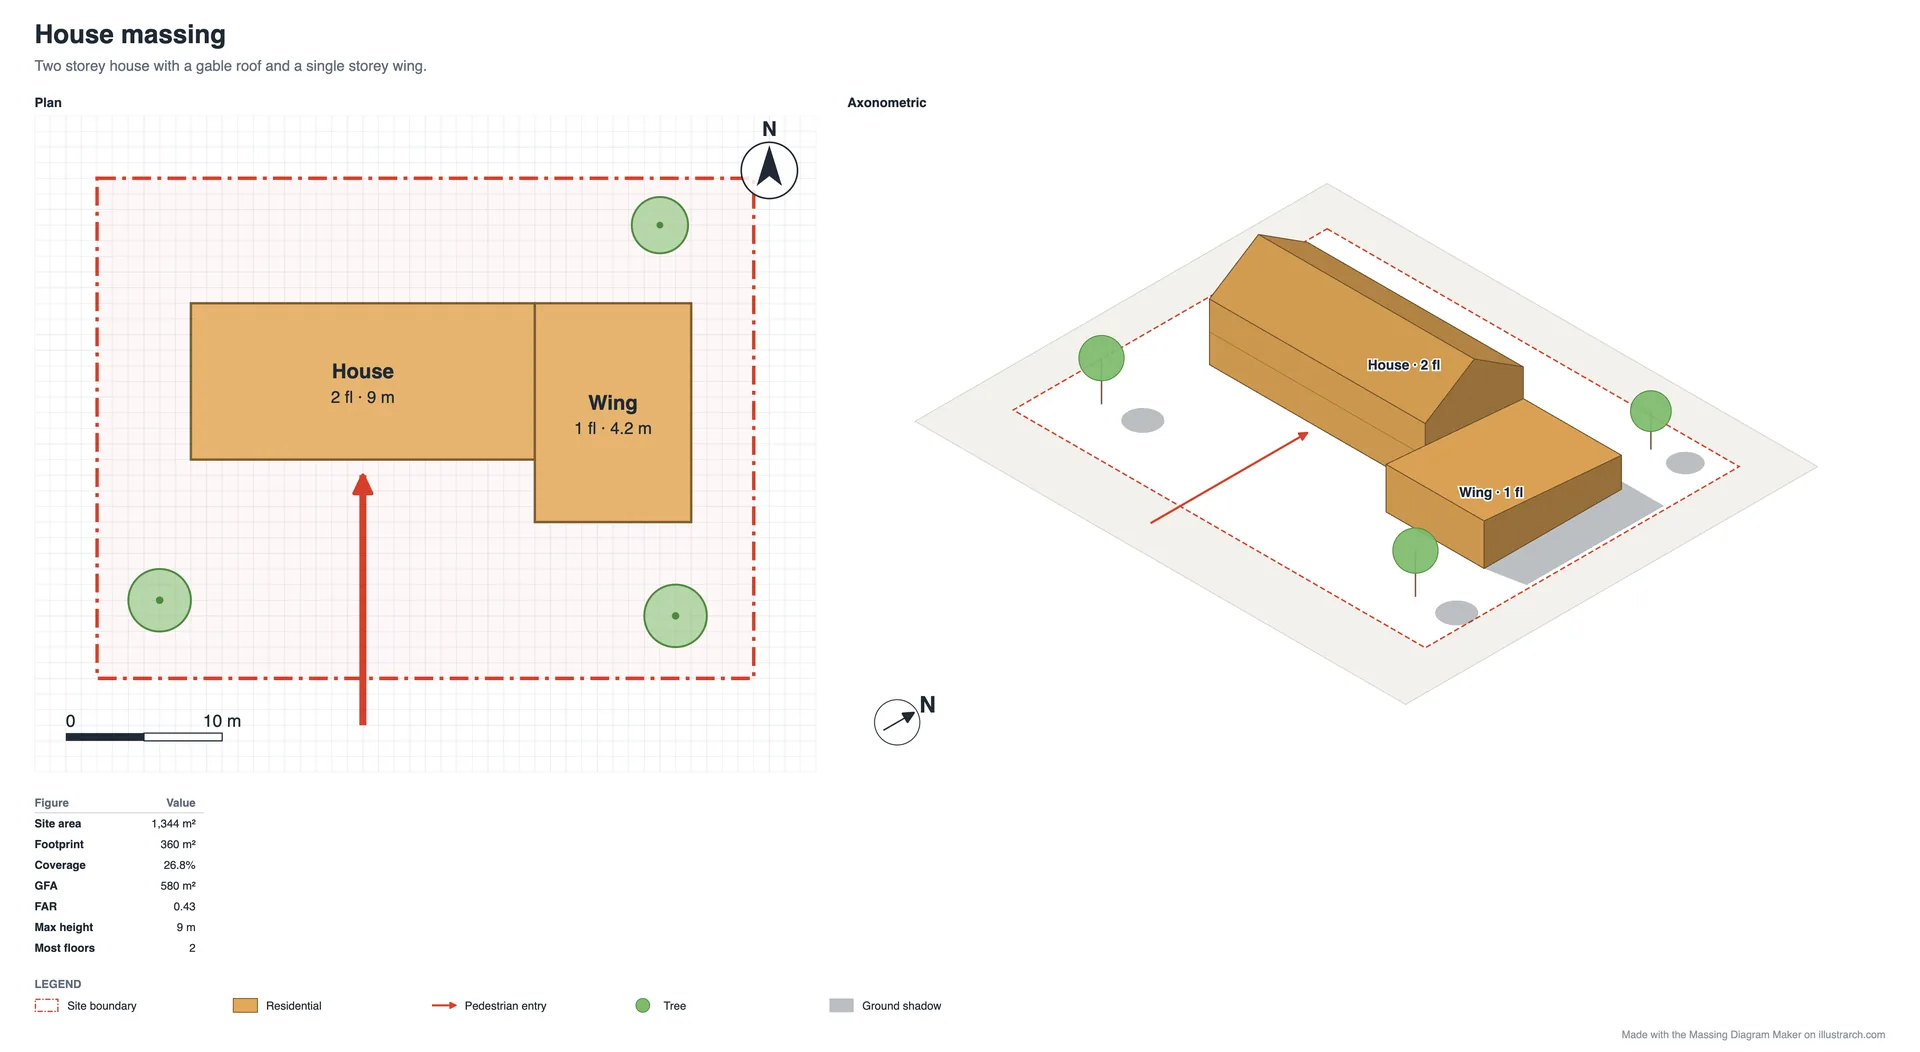
House with pitched roofs
Massing is not only for towers. The house template sets a two storey block with a gable roof next to a single storey wing with a shed roof, on a 1,344 m² plot. The roof rise counts towards the maximum height, so the figures tell you the ridge height, not only the eaves.
Point towers and the courtyard school
The remaining templates cover three slender towers of different heights in an open landscape and a two storey school with classroom wings around a play court and a taller hall. Open them from the template list and change them to fit your site.
Massing, stacking and zoning
These drawings work together. A massing diagram fixes the envelope: how much volume and where. A stacking diagram assigns uses floor by floor inside it. A zoning diagram arranges the rooms of one floor, which you can draw in the zoning diagram maker. In this tool each block carries one use, so mixed use buildings are drawn as stacked blocks, a retail podium under an office block for example, which also gives you the area of each use without extra work. The organising idea that the volumes express is drawn in the parti diagram maker.
Common mistakes in massing studies
- Counting volume twice. Two blocks occupying the same space double the GFA. Stack them or move them apart; the warning in the panel tells you when it happens.
- Floor heights left at the default. Shops, lobbies and halls are taller than flats. A podium at 4.5 m per floor reads very differently from one at 3.2 m.
- No neighbours. A massing without its context hides the only thing that usually matters: how it meets the buildings next to it.
- Shadows at noon in June. Summer noon shadows are the shortest of the year. Test winter, morning and afternoon too.
- Reading FAR without the site. FAR and coverage are only meaningful against the site boundary you drew, not against the board.
- Units switched halfway. Sizes are not converted when you change between metres and feet. Pick the unit before you start drawing.
What to export, and when
PNG or PDF gives you a finished sheet: title, design intent, plan and axonometric side by side (or one axonometric per option), the figures table and a legend of uses. SVG keeps every face and label as a vector for Illustrator, Affinity or Inkscape. CSV lists every block of every option with its use, footprint, floors, floor height, base, top and GFA, followed by the comparison table, ready for a spreadsheet. JSON is the editable file, and Share link opens a copy of the study in someone else’s browser.
Frequently asked questions
Is this massing diagram maker free?
Yes. There is no account, no trial and no watermark. Your study is kept in your own browser and is still there when you come back.
How is FAR calculated here?
FAR is the gross floor area of all proposed blocks divided by the area inside the site boundary. Gross floor area is the footprint of each block multiplied by its floors. Existing neighbours and landscape volumes are not counted.
Can I model a tower on a podium?
Yes. Draw the podium, then draw the tower footprint over it, select the tower and press Stack on top. Its underside moves to the top of the podium and both blocks are counted correctly.
Are the shadows accurate?
The sun position is accurate to about a degree for the latitude, date and solar time you set, which is enough to compare massing options. Shadows are drawn on the ground only, so use a full 3D model for a formal daylight assessment.
Can I work in feet?
Yes. Choose feet under Site and units. Sizes are not converted when you switch, so pick the unit before you start drawing.
Can I open the export in other software?
Yes. SVG opens in Illustrator, Affinity and Inkscape as editable vectors, and the CSV with every block and its figures opens in Excel, Numbers or Google Sheets.
What happens to my work if I close the tab?
It is saved in your browser automatically and reloads when you return. Save it as JSON to move it to another computer or keep several versions.
Keep going
Before massing, the adjacency matrix maker and the bubble diagram maker help you work out the programme; after it, the zoning diagram maker arranges each floor. Read the plot first in the site analysis diagram maker, and settle the organising idea in the parti diagram maker. To present the site itself, see the guide to the architectural site plan. Every free tool is on the illustrarch tools page, and the whole family of diagrams is in the architectural diagrams hub.
Rate this tool
Was Free Online Massing Diagram Maker for Architecture useful? One tap, no sign-up.