

Free Online Site Analysis Diagram Maker for Architecture
Everything this site analysis diagram maker does, free, no account, nothing to install
- The site: boundary with its area and perimeter, existing buildings with their storeys, roads drawn to their width.
- Movement: pedestrian, vehicle, service and cycle access arrows.
- Environment: a true sun path for 21 June, the equinoxes and 21 December at your latitude, winds by compass bearing, noise sources, trees to keep, protect or remove.
- Ground: contour lines with their levels, drainage and slope arrows.
- Judgement: good and poor views, opportunity, constraint, buildable, landscape and water zones, markers and notes.
- Your own base: trace over an aerial photo, a map or a survey; the image stays on your device.
- PNG, SVG and PDF sheets with legend, north arrow, scale bar and site facts, plus JSON and a share link.
Site analysis diagrams in brief
A site analysis diagram puts everything that matters about a plot on one plan: where the sun comes from, where the wind and the noise come from, how people and cars arrive, what is worth looking at and what is not, and how the ground falls. Site analysis itself is the study of everything a project inherits before design starts: climate, ground, access, neighbours, views, rules and history. The diagram is how that study is communicated. Instead of a report, it is one plan where each condition has its own symbol, so a reader can see in a minute that the best views face the noisy road, or that the only flat ground lies in the shadow of the neighbour.
For why this step shapes the rest of the project, read site analysis in architecture and why context shapes good design and the importance of site analysis. This tool covers the part that is drawn: thirteen kinds of mark on a scaled plan, a sun path calculated for your latitude, and a legend that lists only the marks you used.
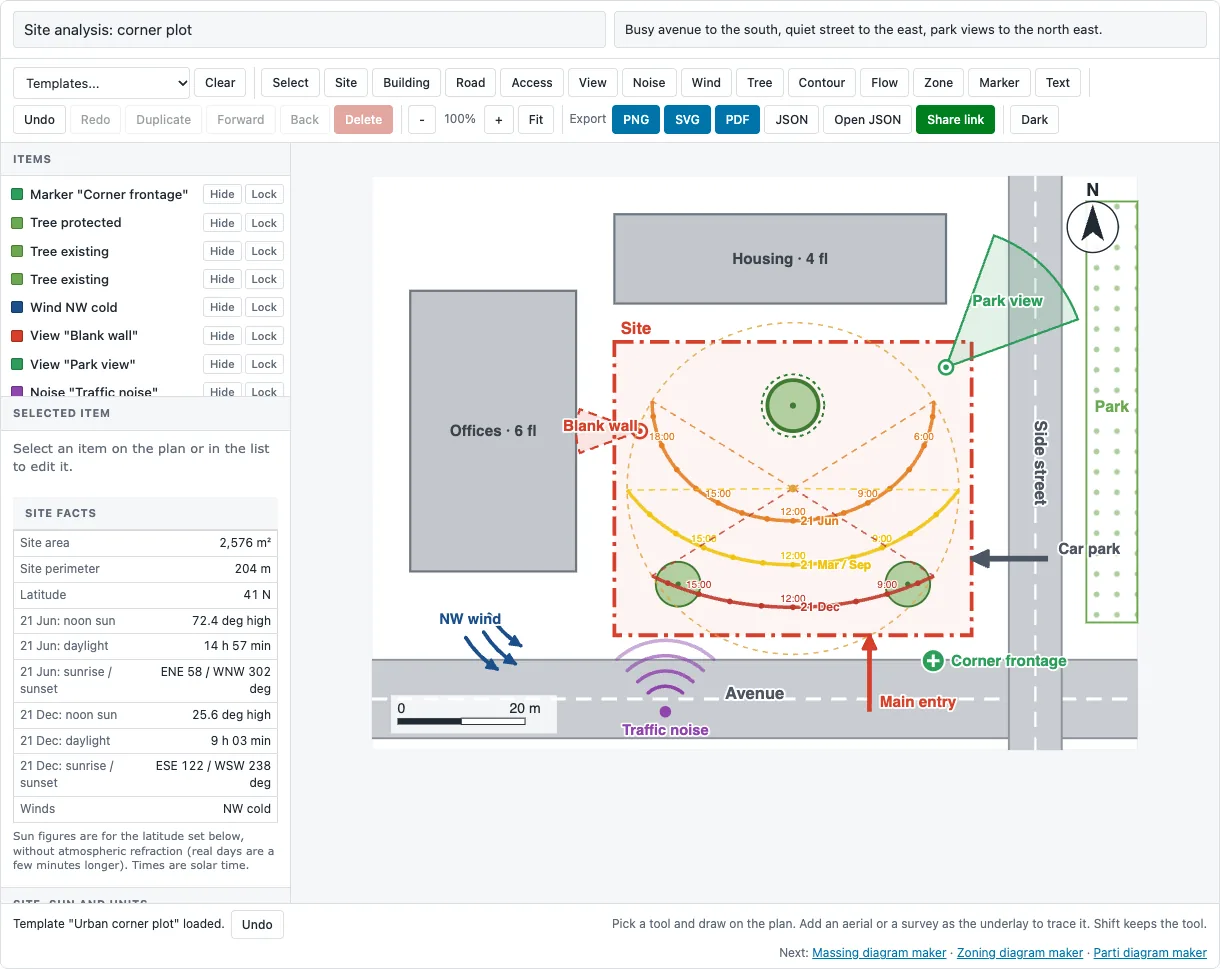
How to use this site analysis diagram maker
- Set the scale and north. Under Site, sun and units, choose metres or feet, size the board a little larger than the plot and its surroundings, and set North if north is not straight up.
- Add a base (optional). Add image loads an aerial view, a map screenshot or a survey you have the right to use. Set its width so a known distance matches the scale bar, then lower its opacity.
- Draw the site. Pick Site and click each corner; click the first corner, or the last one again, to close it. Area and perimeter appear in Site facts, and the sun path centres on the site.
- Add the context. Building for neighbours, Road for streets (drag along the centre line, bend it with the small dots and set the width), Tree for trees to keep, protect or remove.
- Add the forces. Access arrows for every way in, View cones for what is worth seeing (aim them with the round handle), Noise for roads, rail or plant, Wind with the bearing it blows from.
- Read the ground. Contour lines with their levels, Flow arrows for drainage and the fall of the slope.
- Conclude. Mark Zones for opportunity, constraint and the buildable area, and use Markers for the specific points you want to talk about. Put the key finding in the subtitle.
The thirteen marks
| Mark | Records | Settings |
|---|---|---|
| Site | The plot boundary | Area and perimeter read out |
| Building | Existing buildings around or on the site | Label, storeys |
| Road | Streets and paths | Main road, street or footpath; width |
| Access | Ways in | Pedestrian, vehicle, service or cycle |
| View | What is seen from a point | Good or poor; angle and reach |
| Noise | A noise source and its direction | Low, medium or high |
| Wind | Wind direction | Bearing it comes from; prevailing, cold or cooling |
| Tree | Trees | Existing, protected or to remove; crown radius |
| Contour | Lines of equal level | Level; open line or closed loop |
| Flow | Water and slope | Drainage or slope down; label such as a gradient |
| Zone | Areas with a meaning | Opportunity, constraint, buildable, landscape or water |
| Marker | One specific point | Opportunity, constraint, landmark or note |
| Text | Anything else | Size, bold |
The sun path on the plan
Set the latitude of the site and the tool draws the path of the sun across the sky on three dates: the summer solstice (21 June), the equinoxes (21 March and 21 September, which share a path) and the winter solstice (21 December). Each path is plotted around the centre of the site: the outer circle is the horizon, and the closer a point is to the centre, the higher the sun stands. Dashed rays run to the sunrise and sunset bearings, and dots mark the whole hours of solar time.
The Site facts panel turns the same calculation into numbers. The figures leave out atmospheric refraction, which lengthens a real day by a few minutes, and use solar time, in which the sun crosses the meridian at 12:00. These are the values the tool gives for two latitudes:
| Site facts | 41° N | 33.9° S |
|---|---|---|
| 21 June: noon sun | 72.4° | 32.7° |
| 21 June: daylight | 14 h 57 min | 9 h 44 min |
| 21 December: noon sun | 25.6° | 79.5° |
| 21 December: daylight | 9 h 03 min | 14 h 16 min |
| 21 June: sunrise / sunset bearing | 58° / 302° | 61° / 299° |
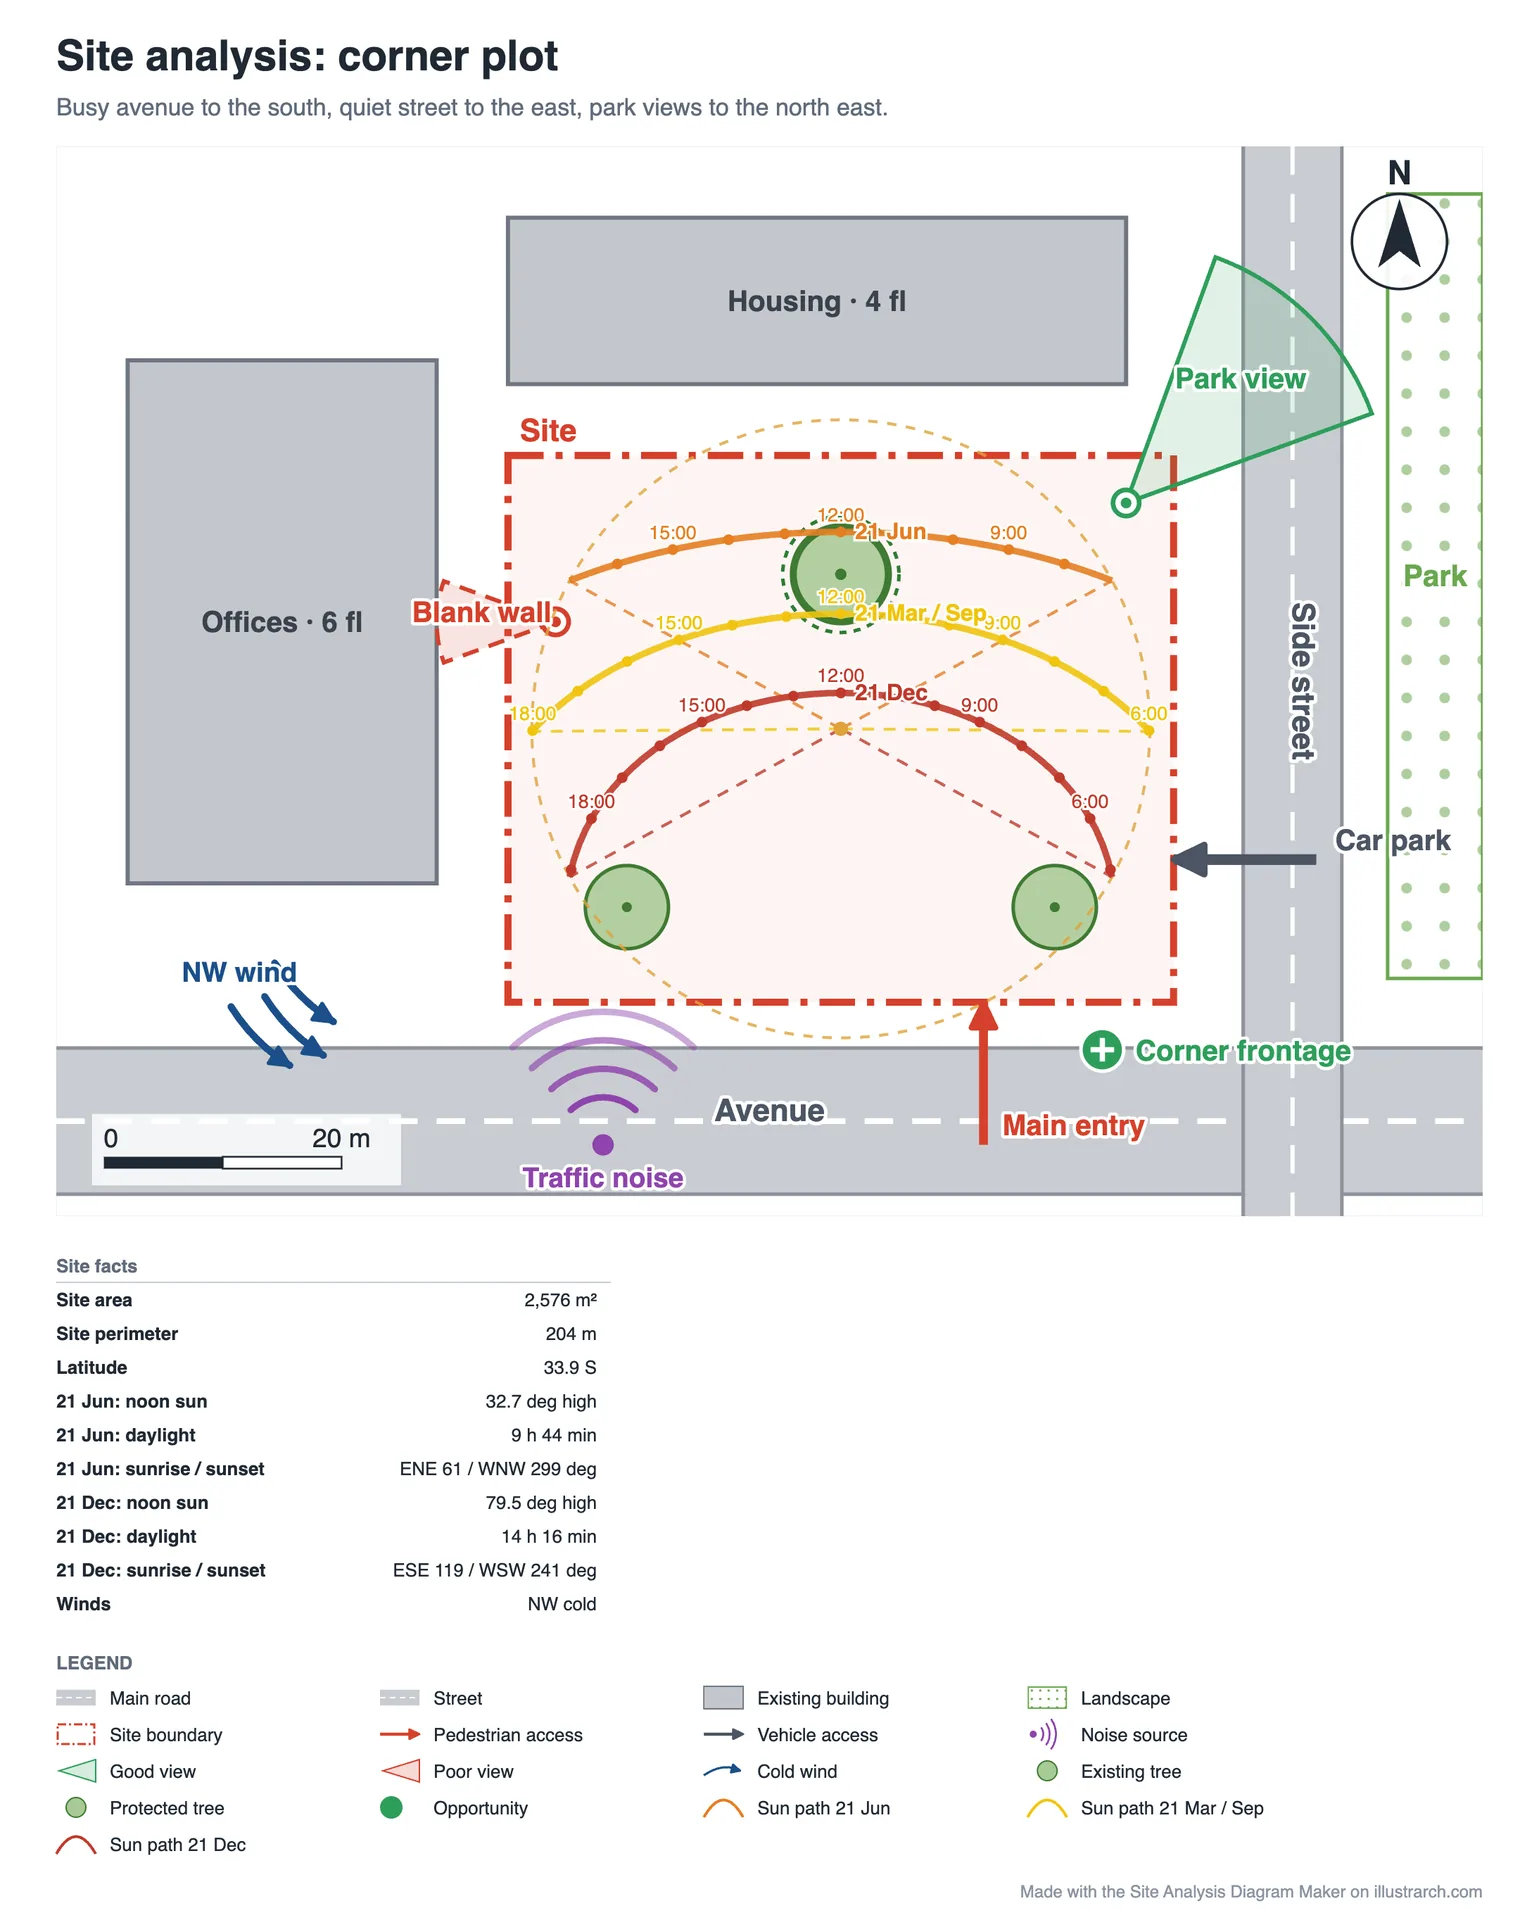
Use a negative latitude for the southern hemisphere, where the noon sun stands to the north and June is the winter month. The corner plot below is the same drawing as the one at the top of the page with the latitude set to 33.9° south: the sun paths swing to the north side of the site and the order of the three dates reverses. For how to read a full sun path chart, see the guide to the sun path diagram.
Wind, noise and views
Wind is set by the compass bearing it comes from, the way weather stations report it: 225 degrees is a south westerly. The arrows point the way the air moves, the label names the direction, and the type tells cold winter winds from cooling summer breezes. Local wind data comes from the nearest weather station or a climate database; do not guess it from the map.
Noise sources are drawn as waves spreading from the source in one direction, at three levels. Views are cones from where you stand: set the angle and the reach, mark them as good or poor, and aim them with the rotate handle. A poor view, such as a blank wall, a car park or a bin store, is as useful to record as a good one, because it tells the plan where not to put the living room.
Ground and water
Contours are drawn as smooth curves through the points you click, each with its level written on the line. Every fifth metre or foot is drawn slightly heavier, and Closed loop turns a contour into a hilltop or a hollow. Flow arrows show where surface water runs (drainage, dashed blue) or which way the ground falls (slope, brown), with an optional label such as a gradient. For why the ground deserves this attention, read site topography and its role in sustainable design.
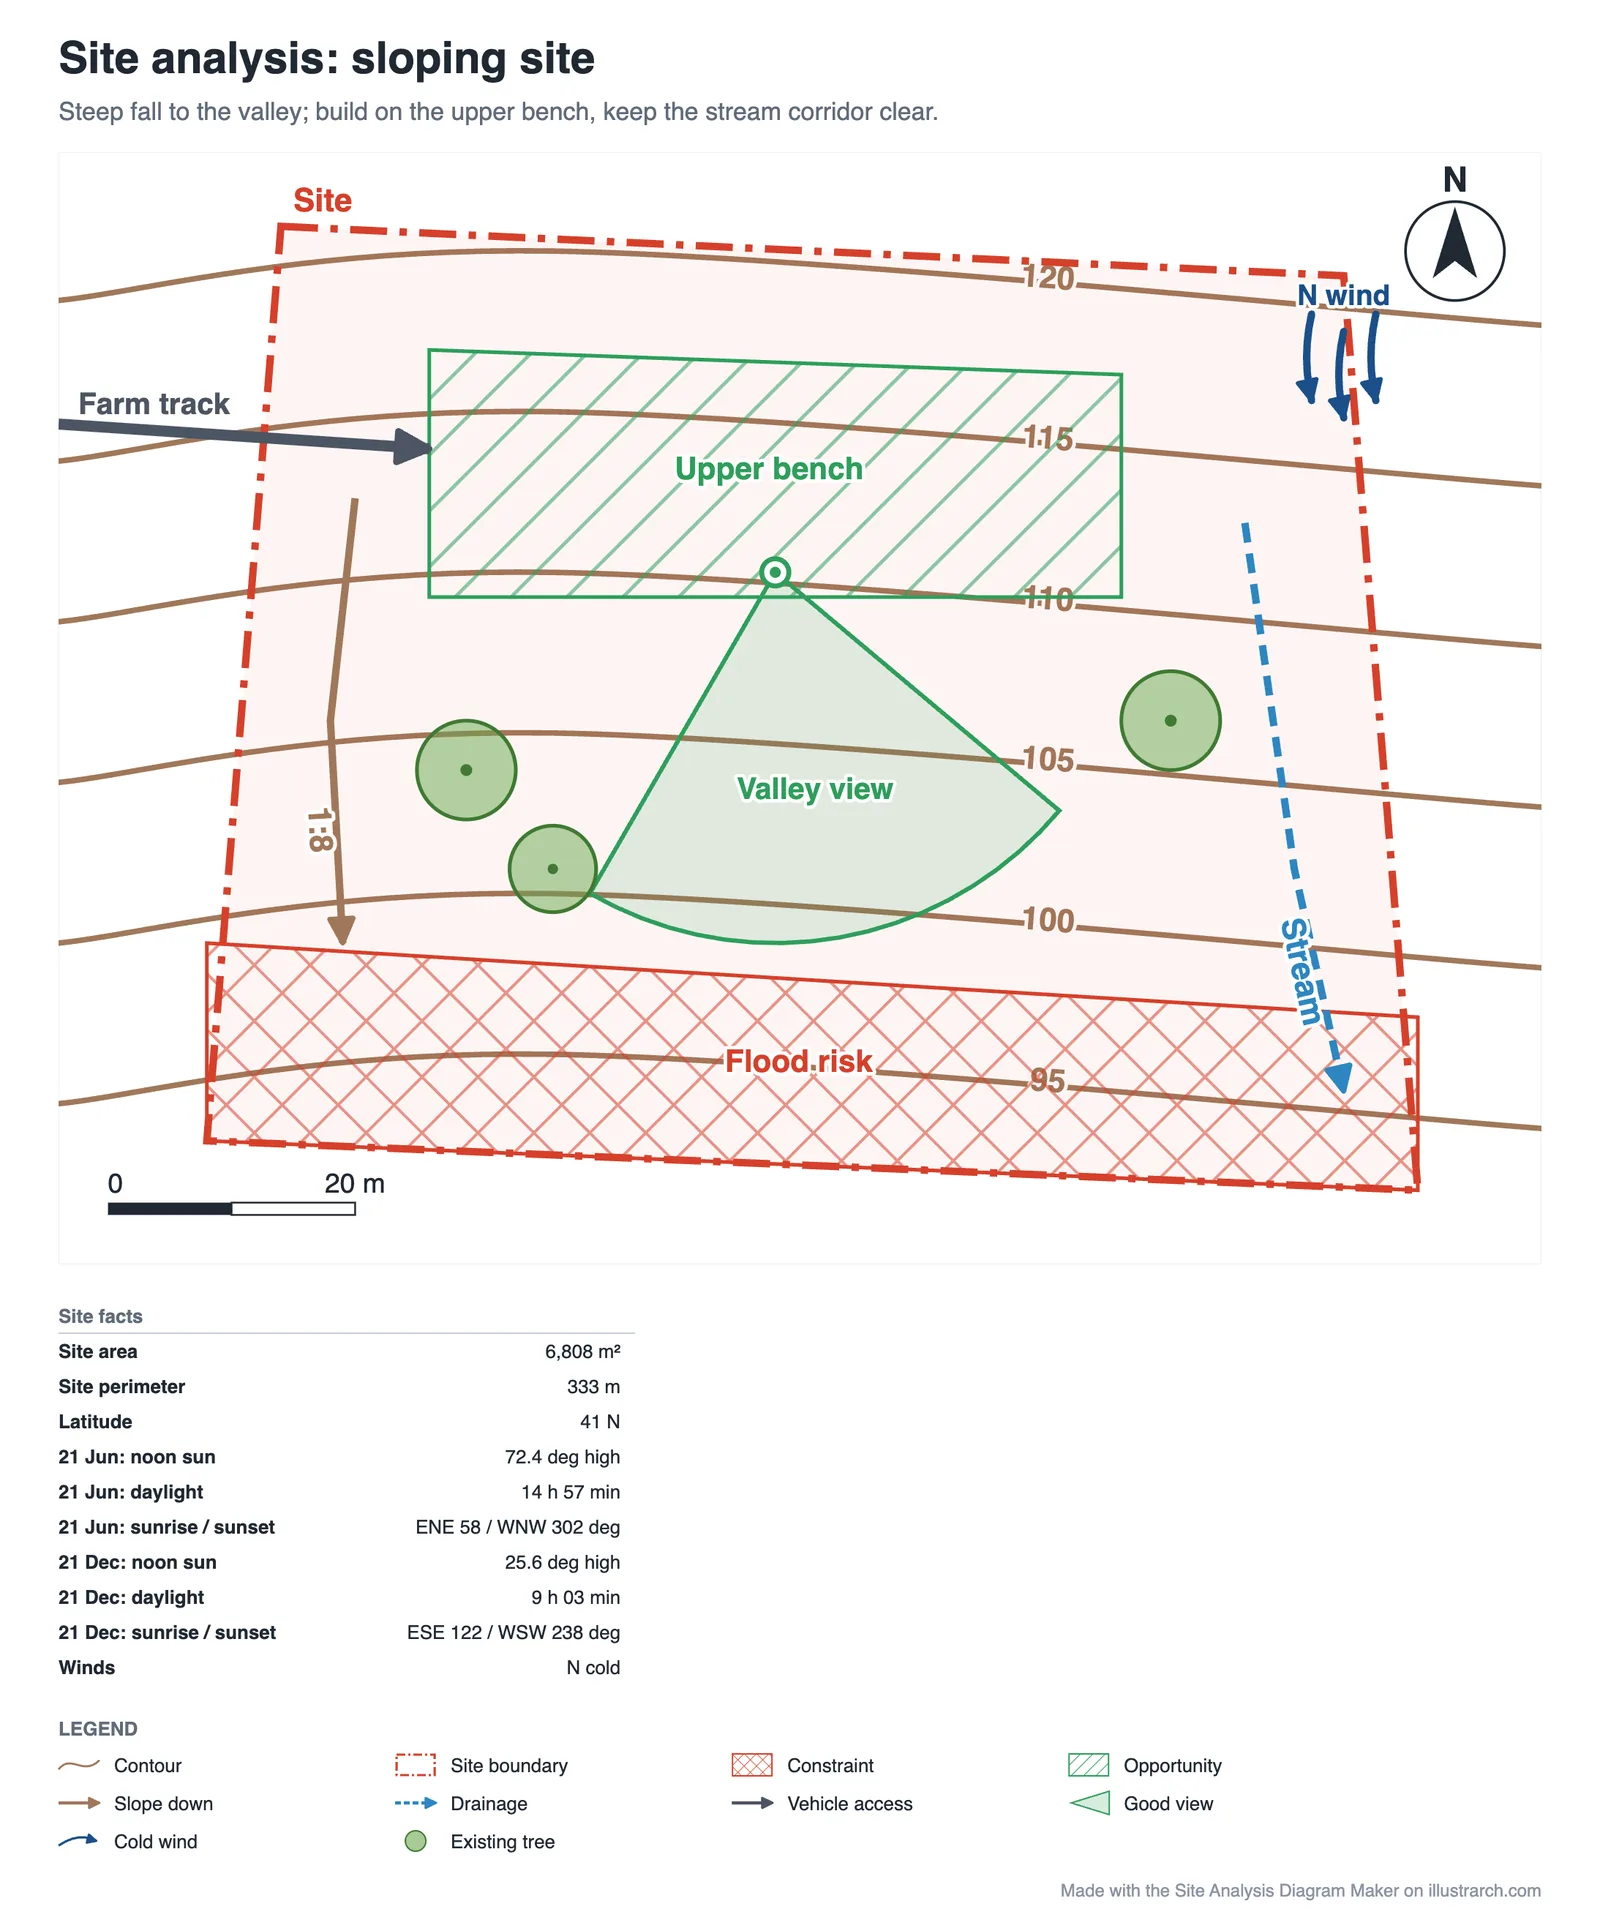
In the sloping site template, six contours fall 25 m from 120 to 95 across the plot. The flat upper bench is marked as an opportunity, the flood risk along the bottom as a constraint, a stream runs down the east side, and the view from the bench looks over the valley. The sun path is switched off in this template so the ground reads clearly; the sun figures stay in the facts table.
From analysis to strategy: zones and markers
An analysis that only records facts stops halfway. The last layer is your reading of them. Opportunity zones (green hatch) mark where the site helps: sun, views, quiet, flat ground. Constraint zones (red cross hatch) mark where it resists: flood risk, noise, overlooking, easements. The buildable outline marks what is left once setbacks and constraints are taken out. Landscape and water zones record what exists. Plus and minus markers pin individual points, and landmark and note markers add the things a reader should know about.
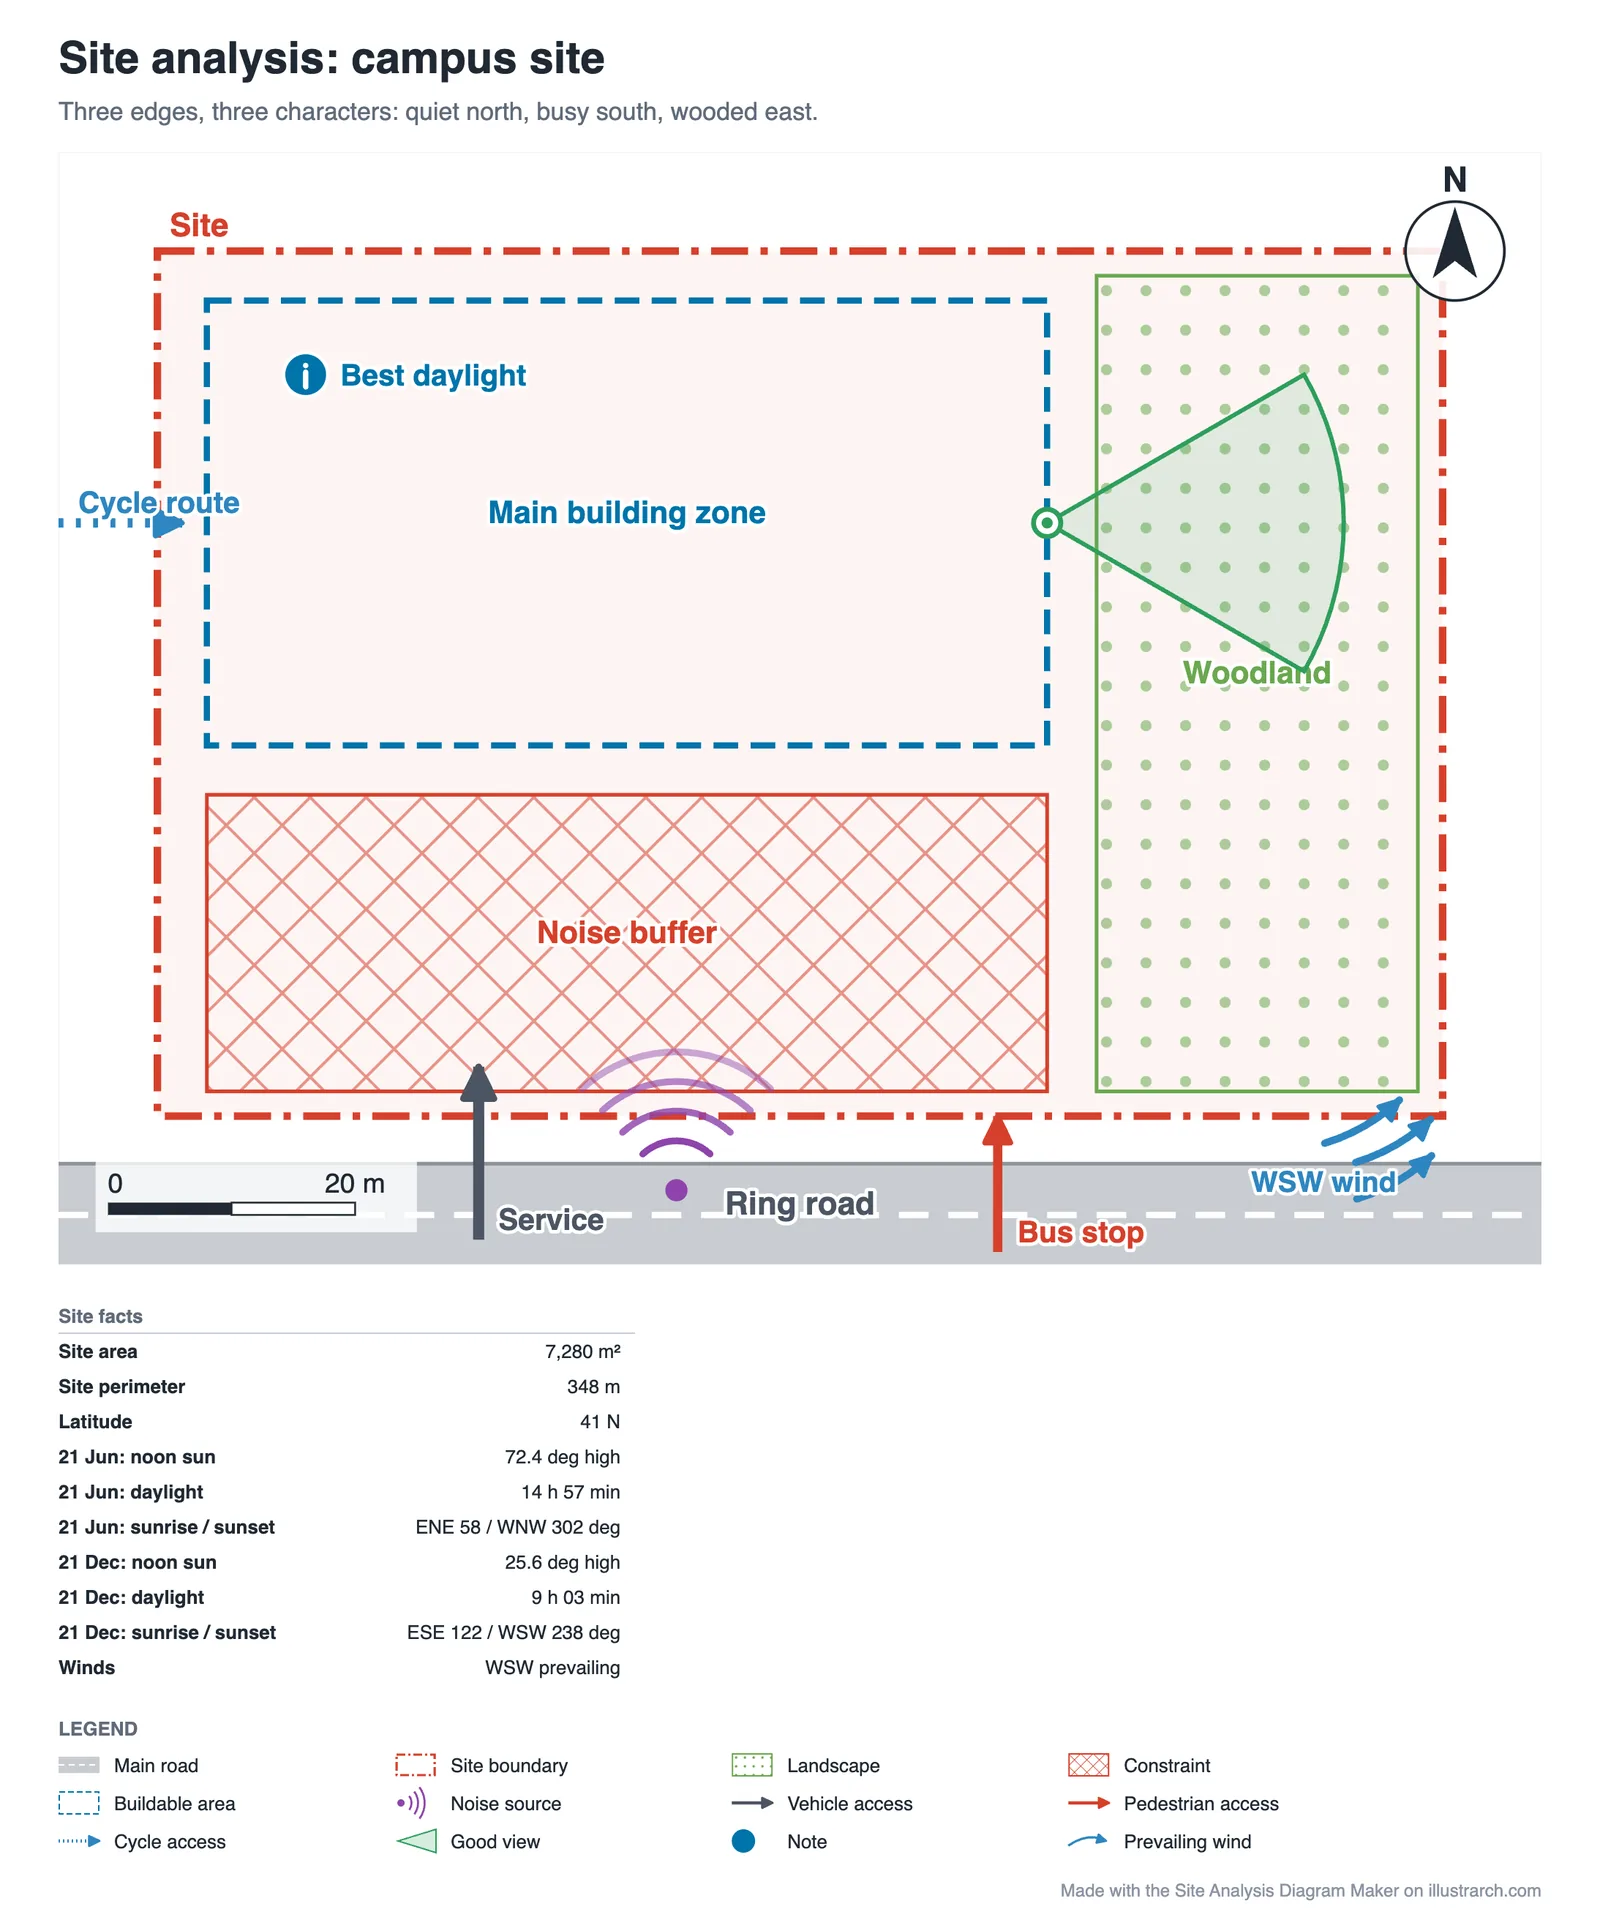
The large site template shows a whole strategy in four zones: a buildable zone in the quiet northern half, a noise buffer along the ring road, an existing woodland kept on the east side, and a note where daylight is best. The access arrows separate service, pedestrian and cycle routes, so the plan already says where the entrances should go.
Six starting points
Urban corner plot
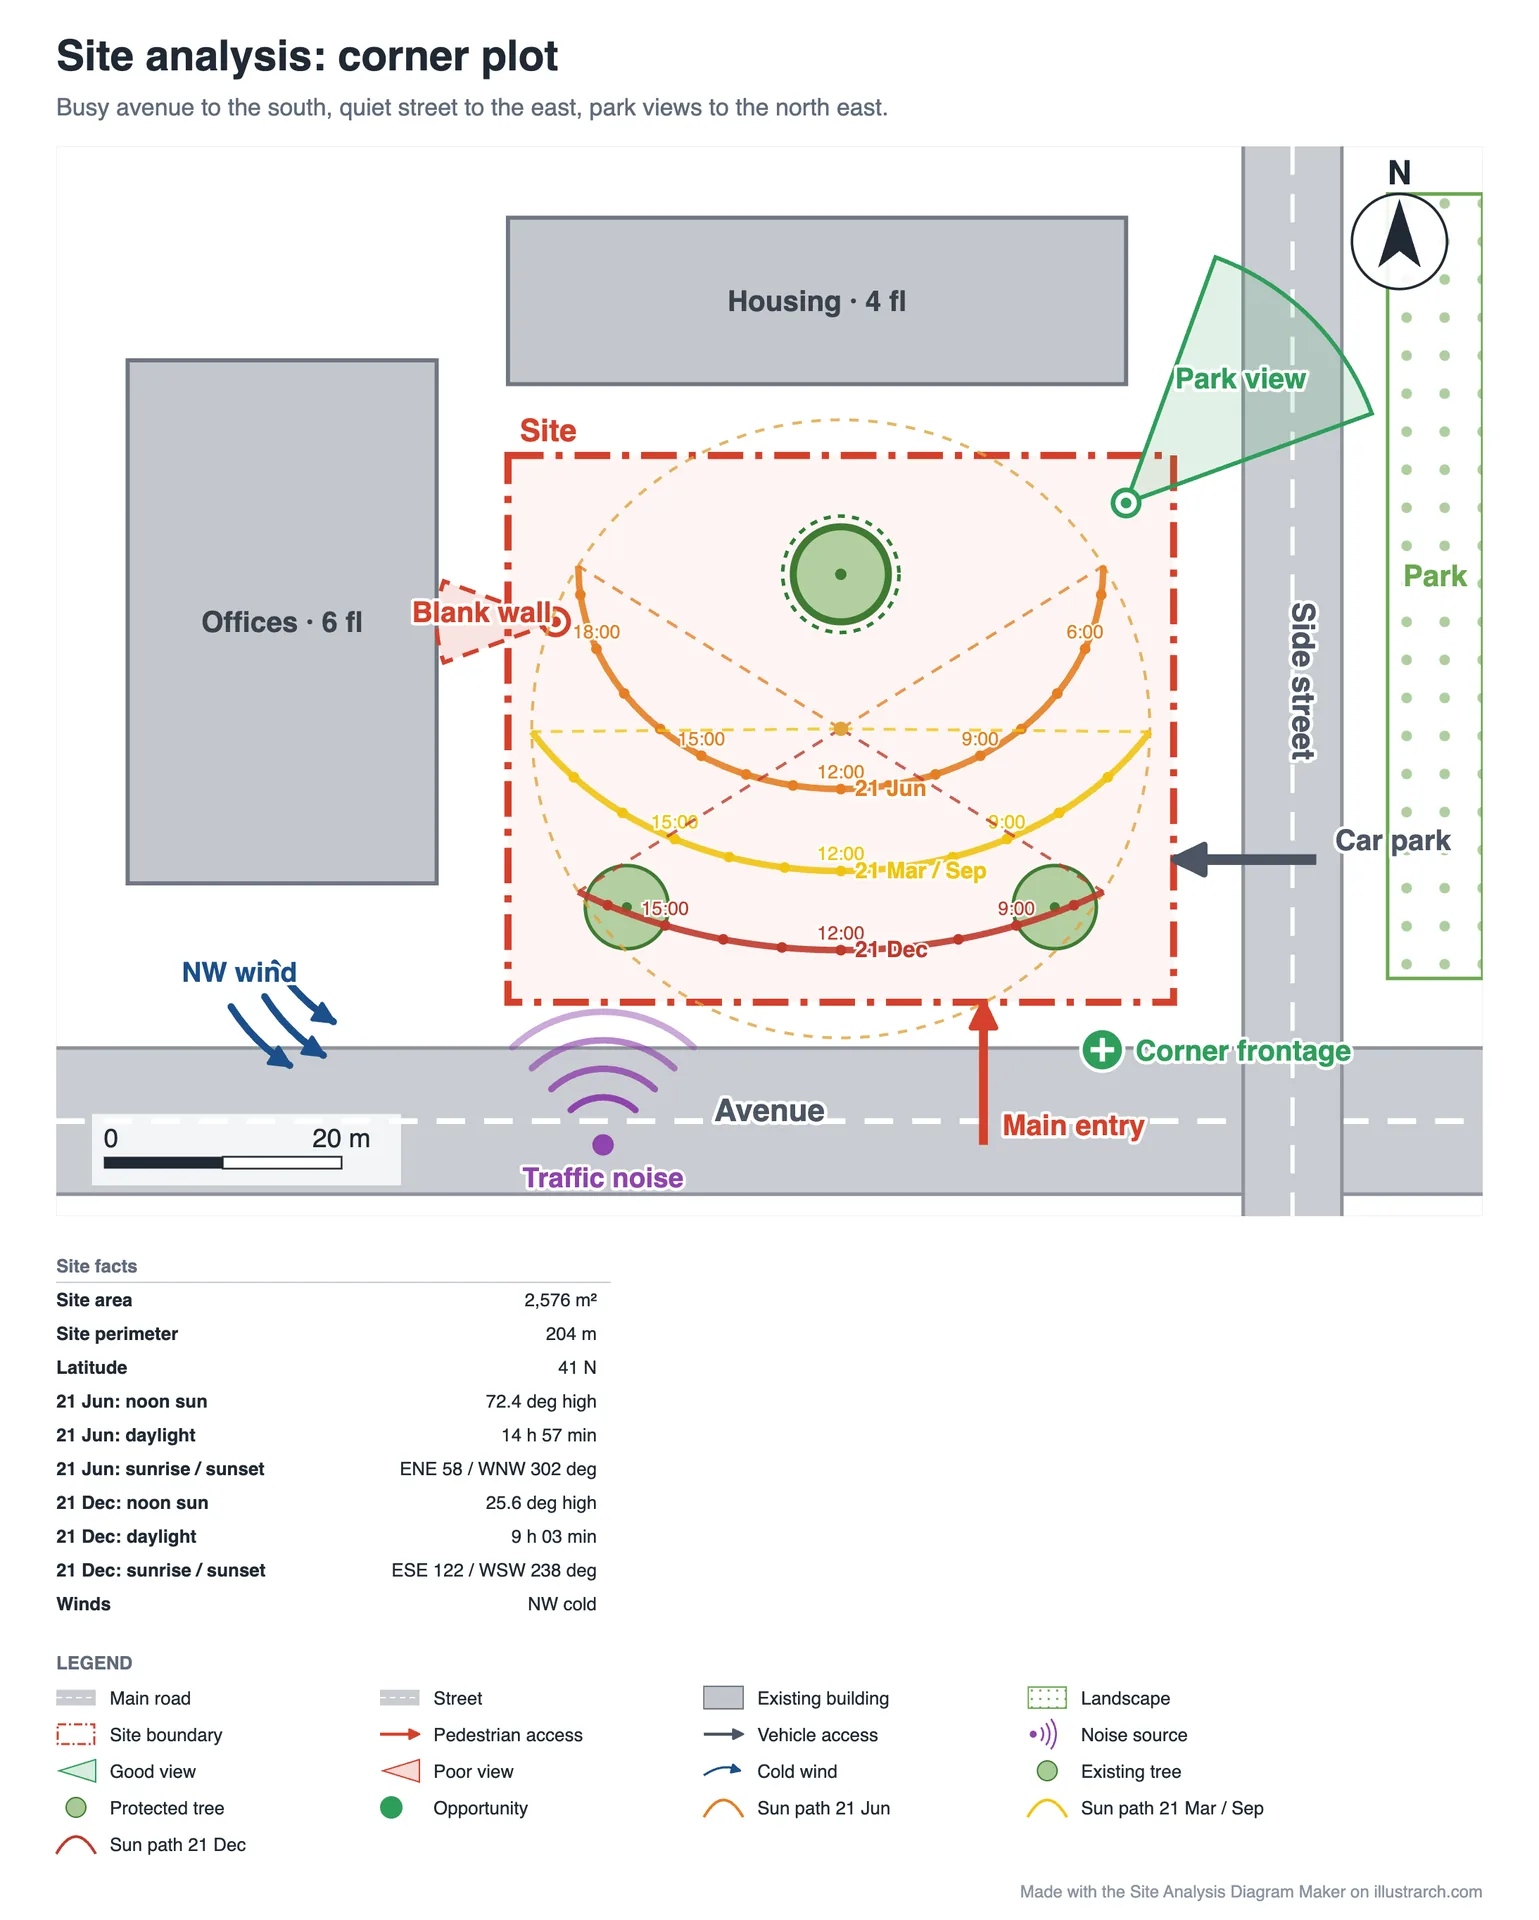
A busy avenue to the south, a quiet side street to the east, an office block and housing on the other two sides and a park across the street. The drawing at the top of this page is this template: the park view, the blank wall to the west, the traffic noise and the corner frontage are the four things a design for this plot has to answer.
Suburban house plot
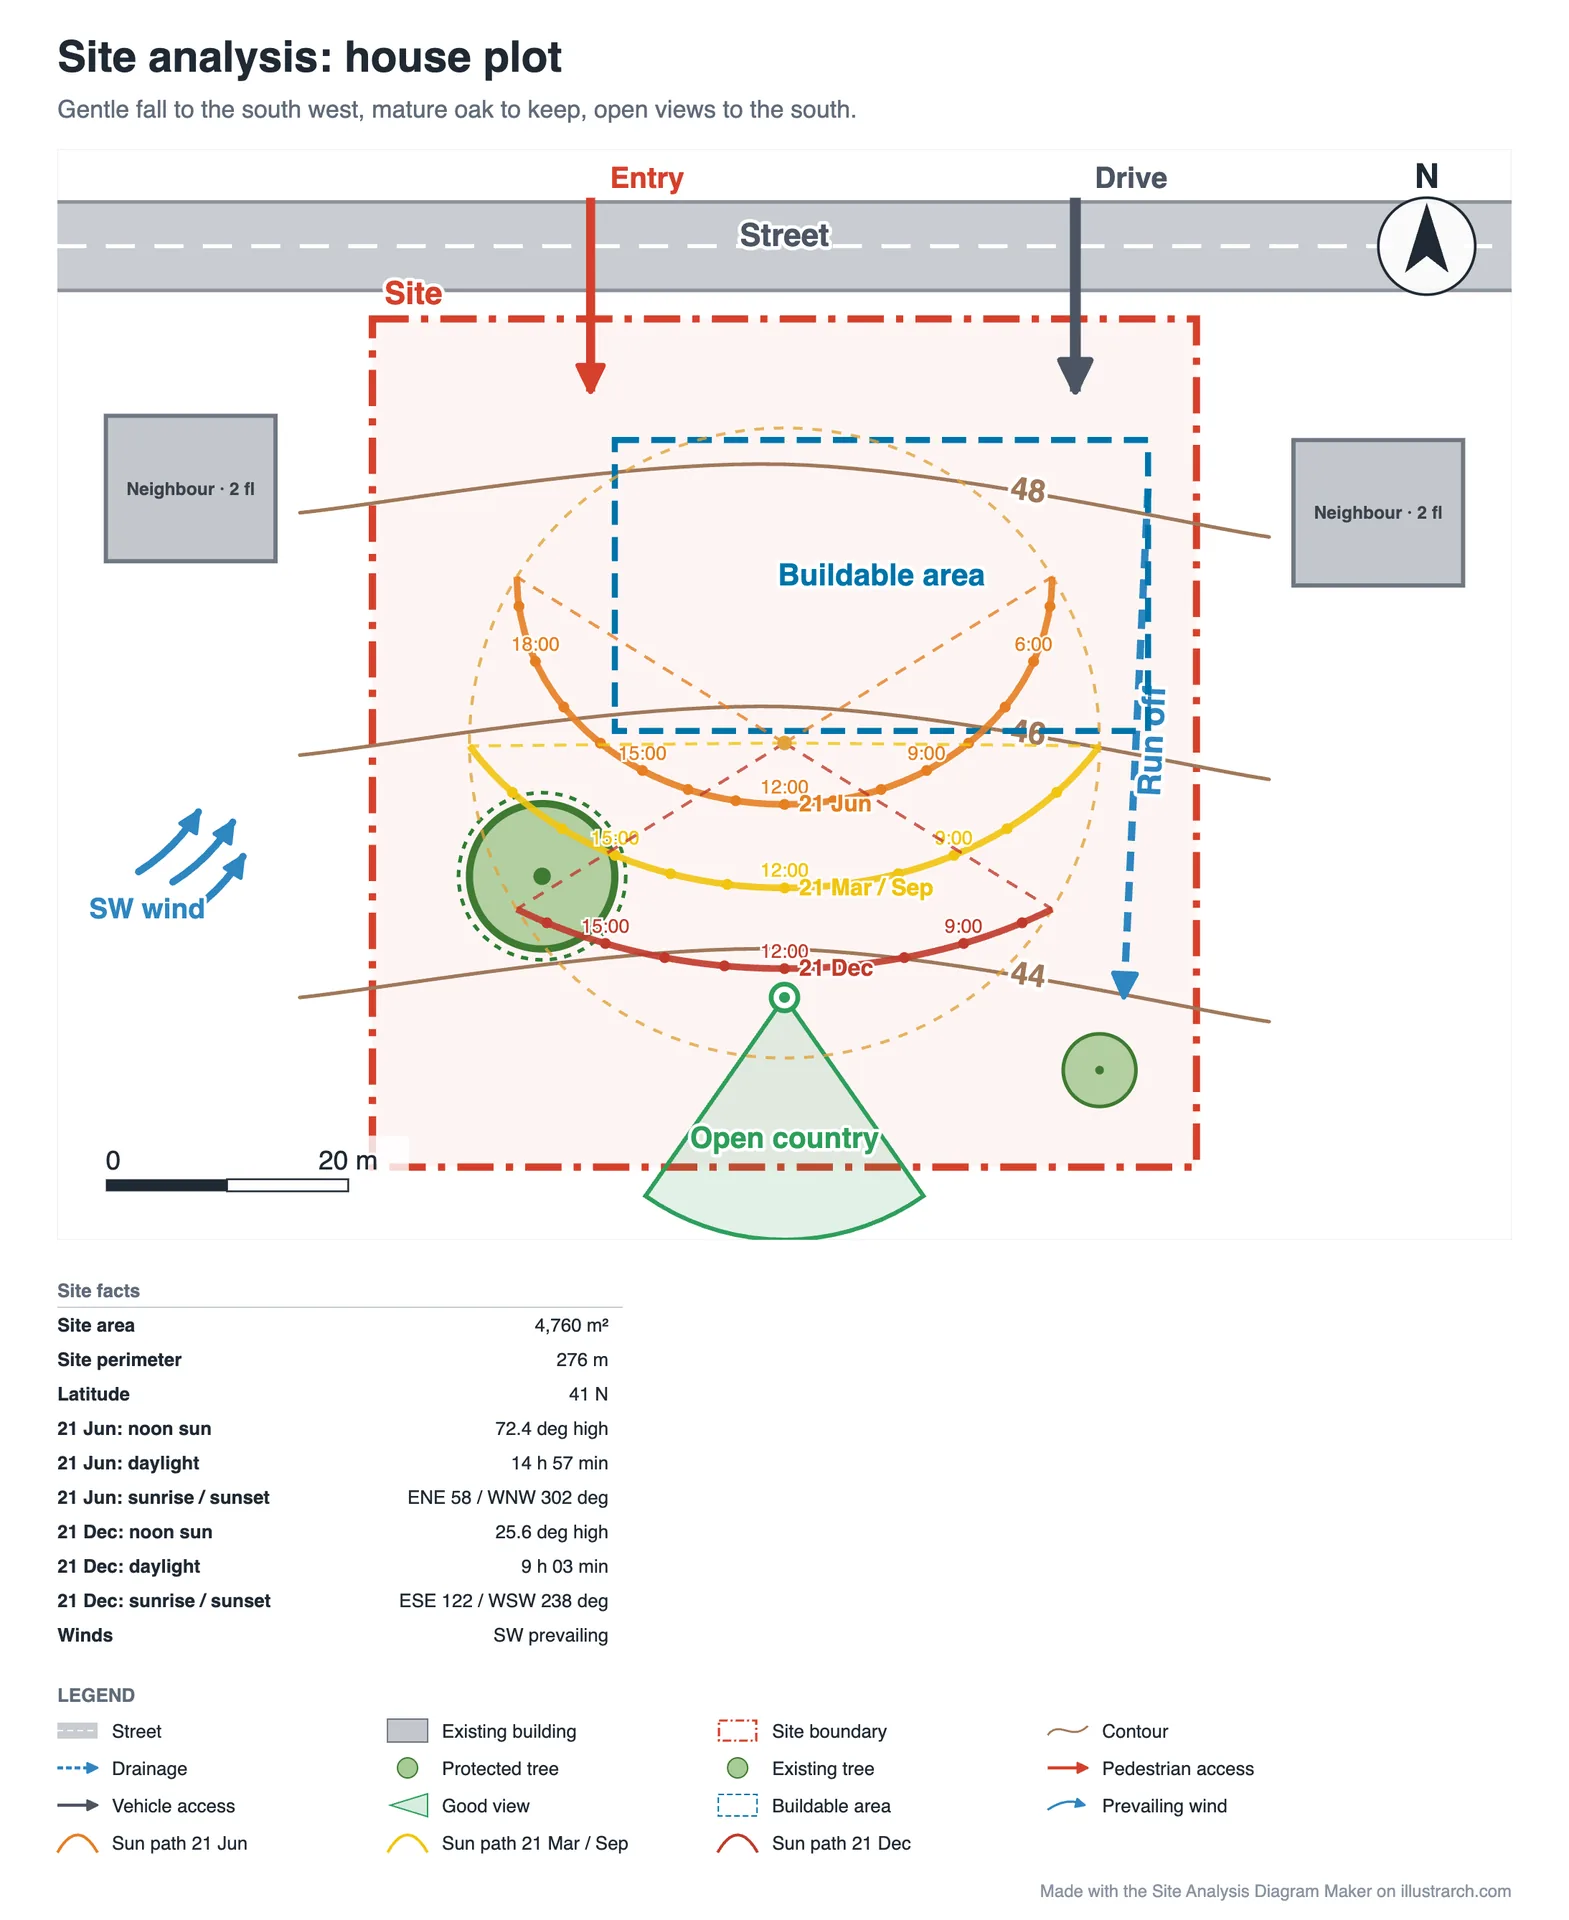
A gentle fall to the south west, a mature tree to keep, two neighbours and a buildable area inside the setbacks. Entry and drive come off the street at the top, the run off follows the fall, and the open country to the south is the view worth facing.
Waterfront site
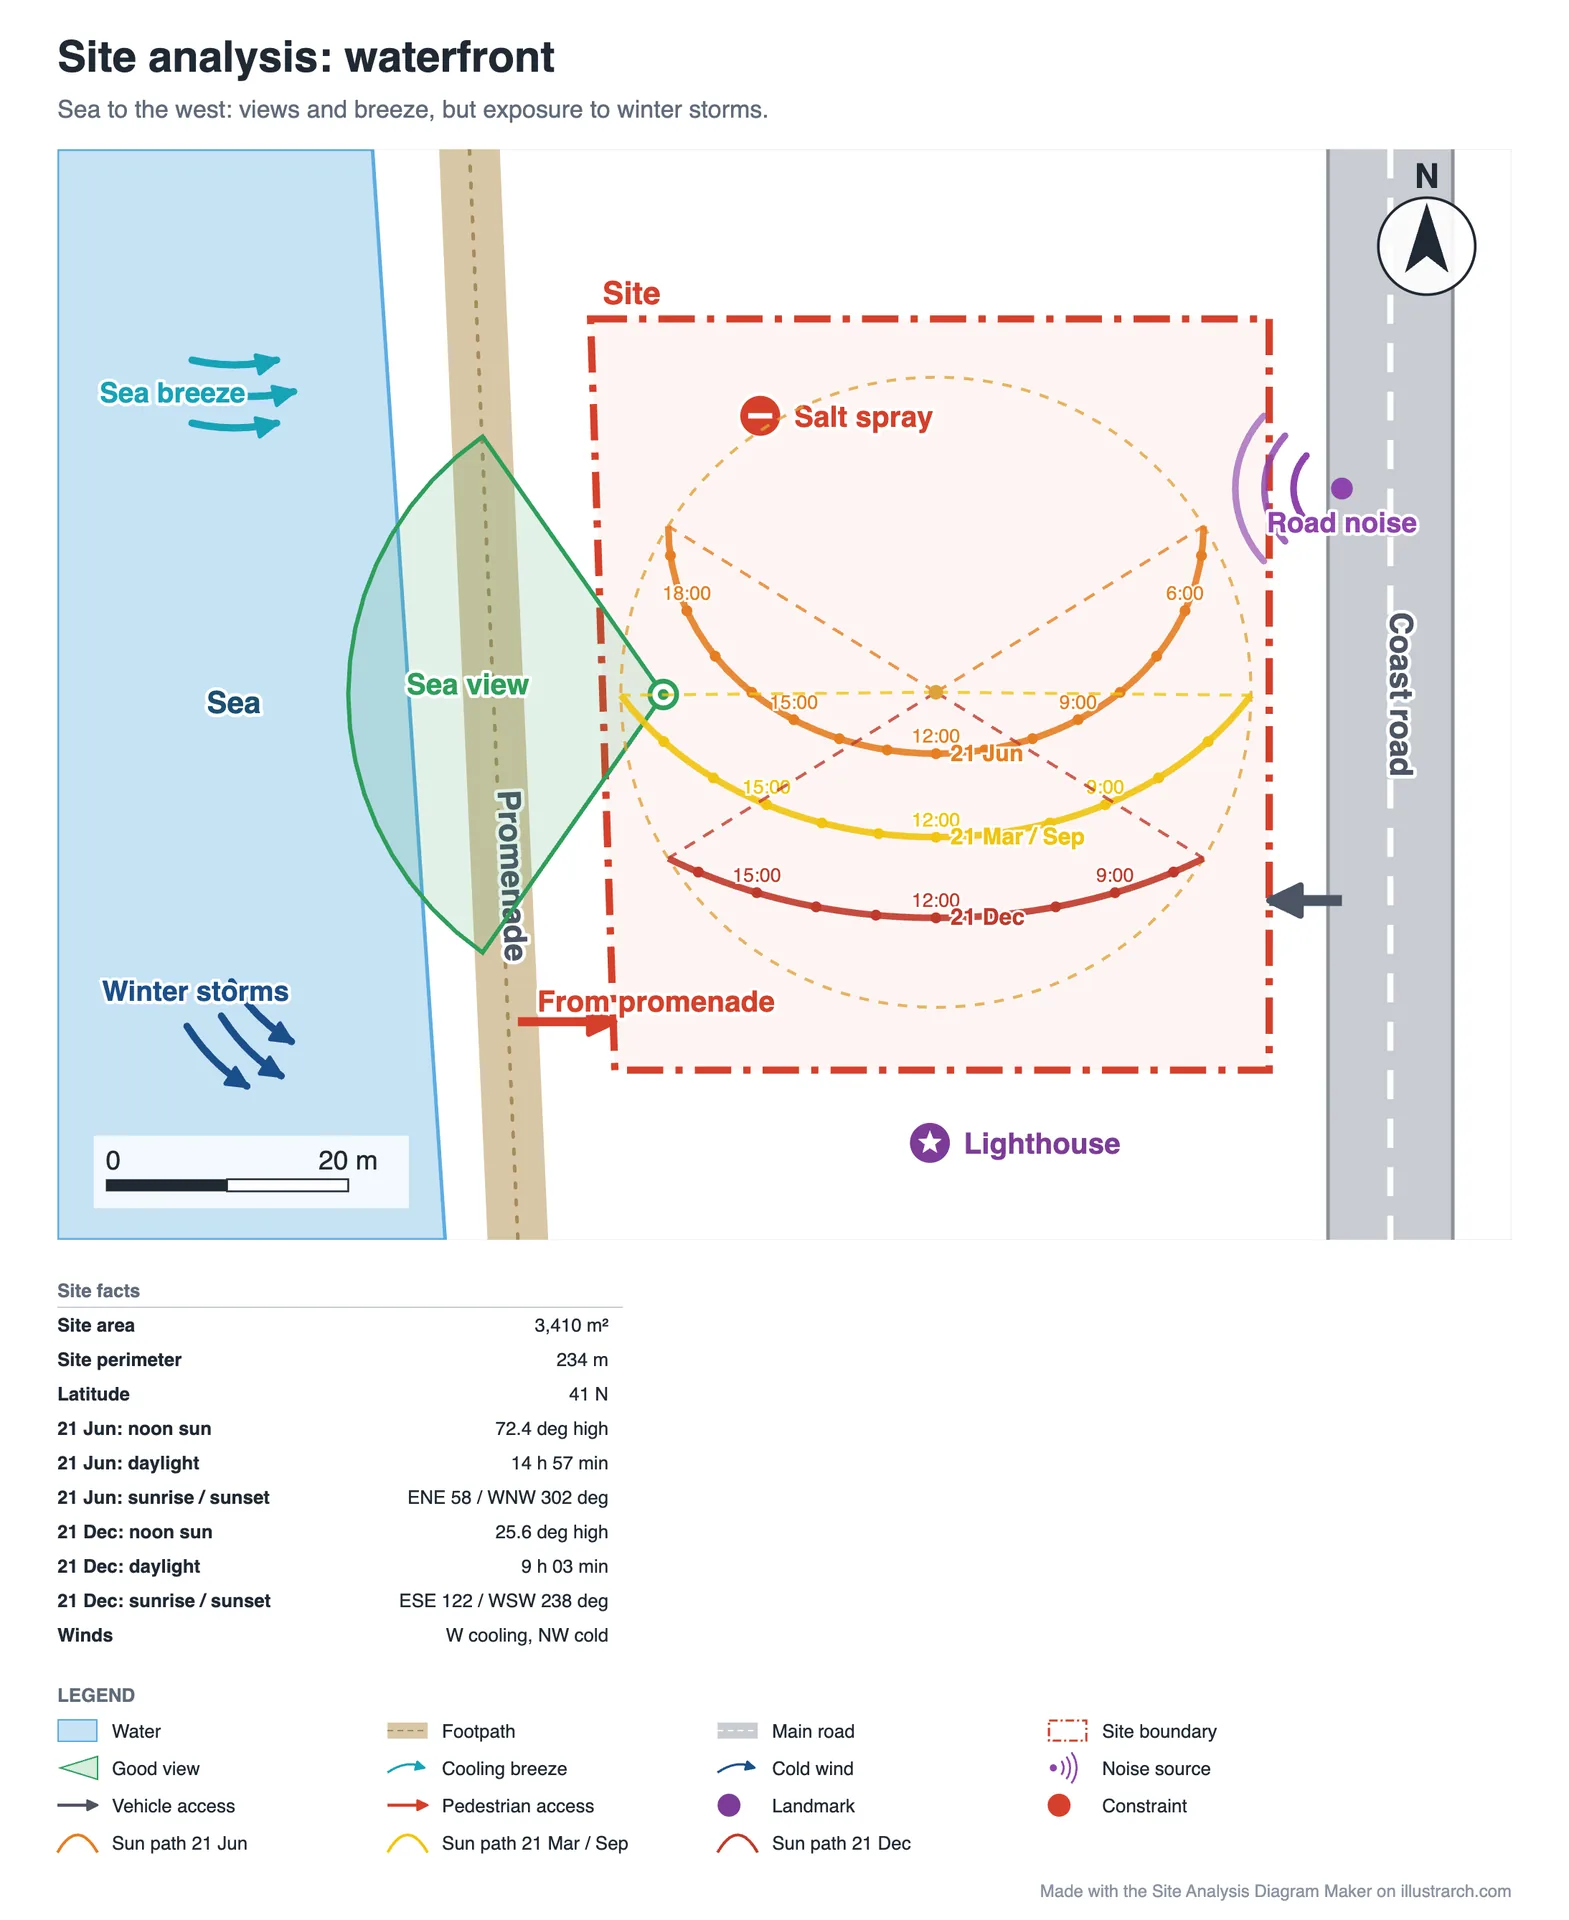
The sea to the west brings the view and the summer breeze, and also the winter storms and salt spray. A promenade separates the site from the water, the coast road runs along the east side, and a lighthouse to the south is marked as a landmark.
Sloping rural site, large site with zones and blank site
The sloping site and the large site with zones are shown above. The blank site starts with nothing but the sun path, for your own plot.
Common mistakes in site analysis diagrams
- Everything at once. Thirty symbols on one plan read as noise. Hide marks you do not need for the point you are making, switch off the sun path when the ground is the subject, and export more than one sheet.
- No north and no scale. Both are drawn automatically; keep them in the frame when you crop an export.
- The wrong sun. A sun path copied from another city is wrong for yours. Set the latitude of the actual site.
- Wind drawn the wrong way. A north wind blows from the north. Enter the bearing it comes from, and the arrows point downwind.
- Labels on top of each other. Move a mark by a grid step rather than letting a road name sit under an arrow.
- Facts without conclusions. End with zones and markers that say what the design should do about each condition.
What to export, and when
PNG for slides and pin-ups. SVG to keep working in Illustrator, Affinity or Inkscape, where every symbol stays a separate vector. PDF for an A4 or A3 sheet. All three include the legend, north arrow, scale bar and the site facts table. JSON saves the editable diagram, underlay image included. Share link sends a copy of the diagram without the underlay image, which never leaves your device.
Frequently asked questions
Is this site analysis diagram maker free?
Yes. There is no account, no trial and no watermark. Your diagram is kept in your own browser and is still there when you come back.
How accurate is the sun path?
The sun position is calculated for the latitude you enter and is accurate to about a degree, without atmospheric refraction. That is the right precision for site planning; use dedicated daylight software for a formal assessment.
Can I trace over a map or an aerial photo?
Yes. Use Add image under Site, sun and units with a PNG, JPEG or WebP up to 6 MB, then set its width so a known distance matches the scale bar. Only use images you are allowed to use. The image stays on your device and is not part of share links.
How do I set the wind direction?
Enter the compass bearing the wind comes from: 0 for north, 90 for east, 180 for south and 270 for west. The arrows then point in the direction the air moves.
Does it work for the southern hemisphere?
Yes. Enter a negative latitude, for example -33.9. The sun path then swings to the north and the site facts give the correct day lengths for June and December.
Can I edit the export in Illustrator?
Yes. Export SVG and every symbol, label and zone opens as an editable vector shape.
What happens to my work if I close the tab?
It is saved in your browser automatically and reloads when you return. Save it as JSON to move it to another computer or keep several versions.
Keep going
For the drawing that presents the finished scheme on its site, see the guide to the architectural site plan; for urban context, the figure-ground diagram; for air movement through the building, the ventilation diagram. When the analysis is done, block out the first ideas in the zoning diagram maker. Turn the conclusions into an organising idea with the parti diagram maker, then test the volumes and their shadows in the massing diagram maker. Every free tool is on the illustrarch tools page, and the whole family of diagrams is in the architectural diagrams hub.
Rate this tool
Was Free Online Site Analysis Diagram Maker for Architecture useful? One tap, no sign-up.