

Concentric Zone Model: Burgess’s Five Rings Explained
Burgess drew 1925 Chicago as five rings spreading from the business district. What each zone held, where the model still describes cities, and where later theories replaced it.
 illustrarch Editoral Team19 October 20269 Mins read2
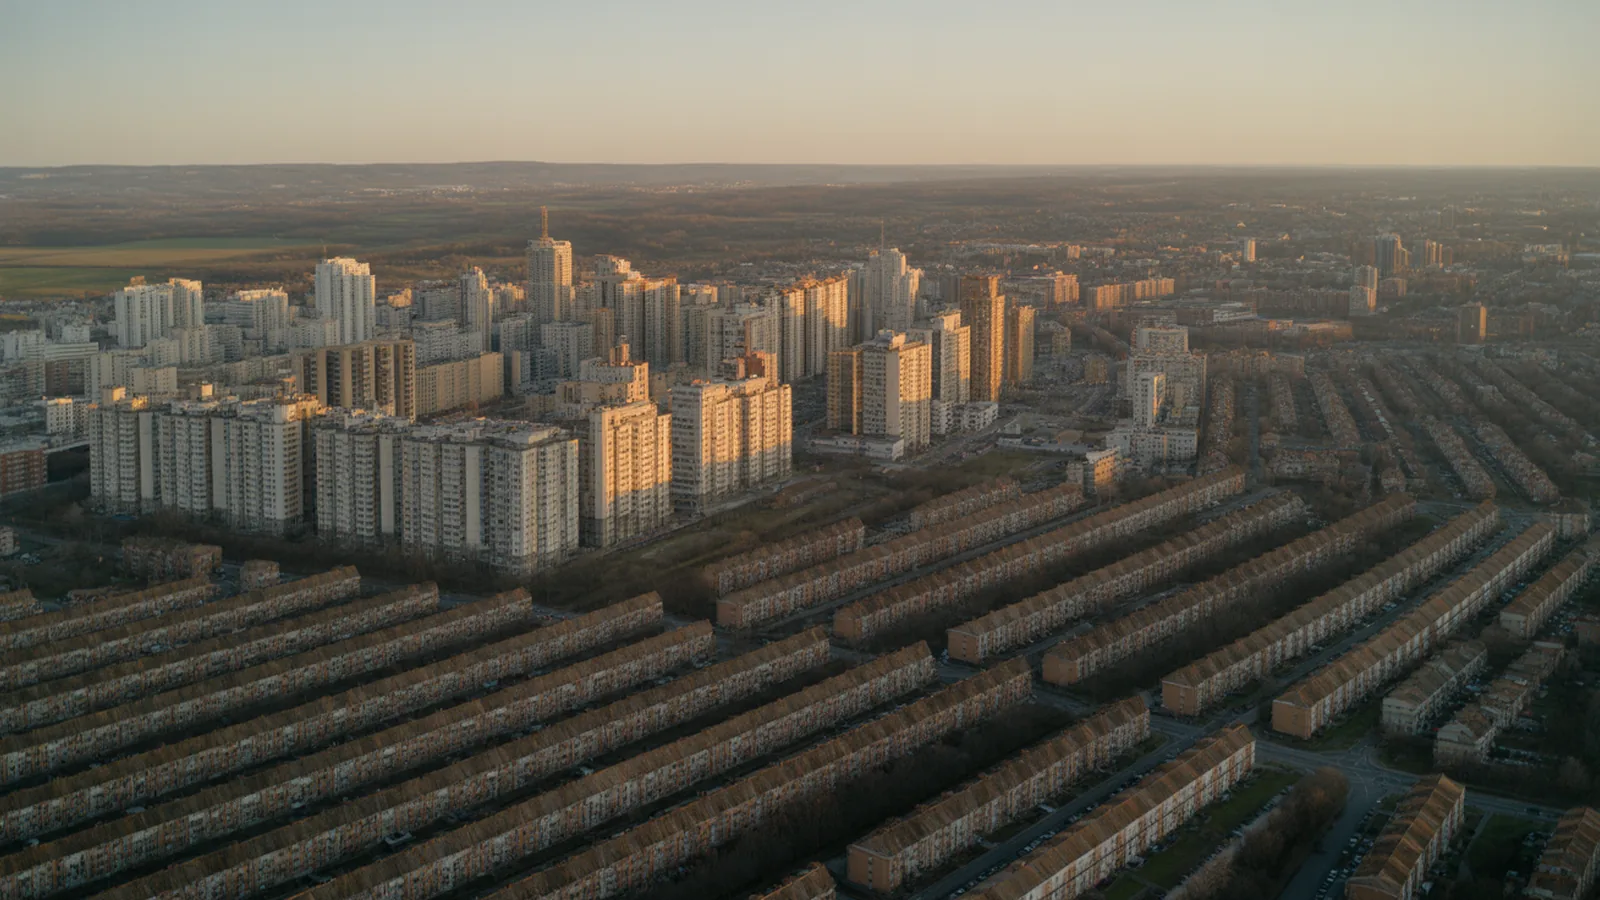
Table of Contents Show
The concentric zone model is a theory of urban structure that describes a city as a set of rings spreading out from a single central business district, with each ring holding a different land use and social group. Ernest W. Burgess published it in 1925 after studying Chicago, and it became the first systematic diagram of how a city sorts itself.
It is also called the Burgess model, the Burgess concentric zone model, or simply the concentric model. All four names refer to the same five-ring diagram. This guide covers where it came from, what each ring actually contained, where it still reads a city correctly in 2026, and the three specific situations where it fails badly enough that using it will mislead your analysis.
Who Made the Concentric Zone Model, and Why
Ernest Watson Burgess was a sociologist at the University of Chicago. His chapter “The Growth of the City: An Introduction to a Research Project” appeared in Park, Burgess and McKenzie, The City (1925), the book he wrote with Robert Park and Roderick McKenzie that founded what is now called the Chicago School of urban sociology. The chapter is short, roughly fifteen pages, and the famous diagram sits on a single chart inside it.
The context matters. Chicago’s population went from about 500,000 in 1880 to well over three million by 1930. Burgess was not theorising in the abstract; he was trying to explain a city that had tripled in a working lifetime, absorbing waves of European immigrants and, after 1916, the Great Migration from the American South. His question was not “what should a city look like” but “what pattern does explosive growth leave behind?”
His answer borrowed from plant ecology. Burgess described growth as invasion, succession and dominance: each inner ring expands outward, pushes into the ring beyond it, and the displaced population moves further out in turn. The rings are not fixed boundaries. They are a snapshot of a process that never stops. This is the part most summaries drop, and dropping it turns a theory of movement into a static picture of where poor people live.
📌 Did You Know?
Burgess did not invent concentric reasoning. Johann Heinrich von Thünen had modelled agricultural land use as rings around a market town almost a century earlier in Der isolierte Staat (1826, expanded 1850). Von Thünen’s driver was transport cost for perishable goods; Burgess swapped in social competition for land. If you have ever seen the two diagrams side by side and thought they looked related, they are.
The Five Zones, and What Each One Actually Contained
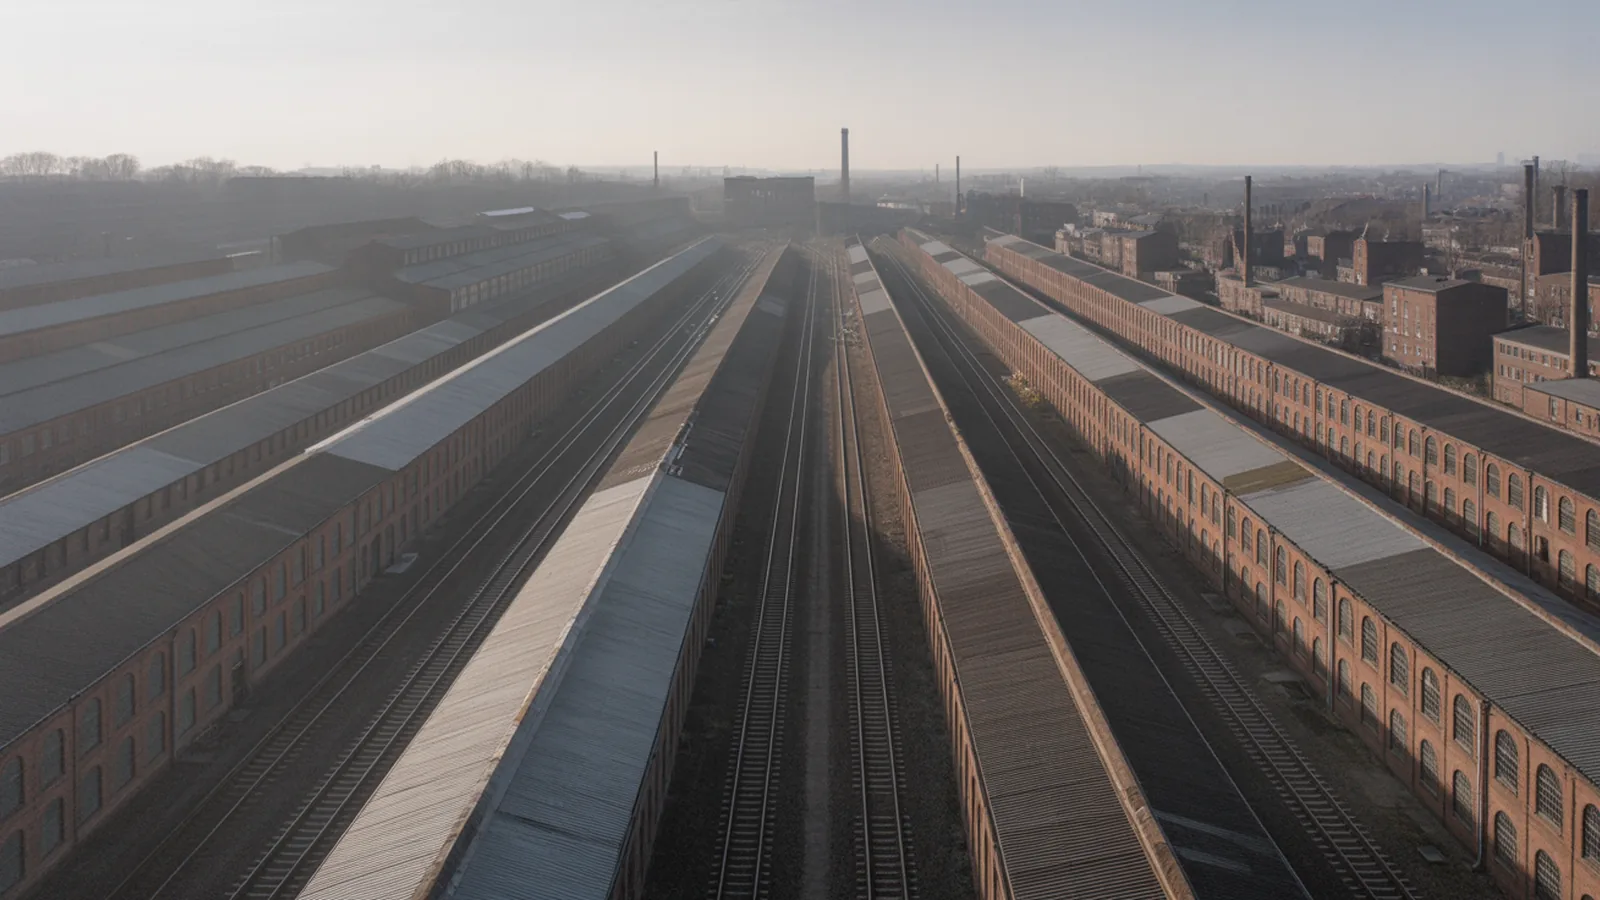
Most reproductions of the diagram label the rings with generic terms. Burgess’s own chart was specific to Chicago and carried real neighbourhood names. The table below gives both, plus the closest 2026 equivalent, because the labels have aged very differently.
| Zone | Burgess’s 1925 label | What it held | Closest 2026 equivalent |
|---|---|---|---|
| I | The Loop | Retail, offices, theatres, civic buildings. Highest land value, lowest residential population. | Central business district, now usually with residential conversions |
| II | Zone in Transition | Factories and warehouses pushing outward into decaying housing. Rooming houses, the highest turnover in the city. | The gentrification frontier, or the post-industrial district awaiting rezoning |
| III | Zone of Workingmen’s Homes | Second-generation families who had escaped Zone II. Two-flats and modest single-family stock. | Inner suburb, dense and ageing, often the most affordable non-central housing left |
| IV | Residential Zone | Higher-end apartment blocks and single-family districts, several with restrictive covenants. | Outer suburb, mostly single-family, car-dependent |
| V | Commuters Zone | Satellite towns thirty to sixty minutes from the Loop by rail. | Exurb and commuter town, now defined by highway rather than rail time |
Two details in that table do the real explanatory work. First, Zone II is the only ring defined by what is happening to it rather than by who lives there. Burgess called it a zone of transition because it was being eaten from the inside by the expanding Loop. Second, Zone V is measured in travel time, not distance. Burgess gave it as a thirty to sixty minute rail commute. That single choice is why the model still transfers: swap rail for motorway and the ring moves outward without the logic changing.
💡 Pro Tip
When you use the model in site analysis, do not ask “which ring is my site in?” Ask “which ring is currently invading my site, and which one is my site invading?” Burgess’s zones are directional. A site in Zone III that is being invaded by Zone II behaves completely differently from an identical site invading Zone IV, even though a static map puts them in the same band.
Where the Model Breaks, and Why That Matters
Half of Burgess’s own rings were in a lake
Chicago sits on Lake Michigan. Drawing complete circles around the Loop puts roughly half of each ring in open water. Burgess knew this and drew the chart anyway, as an idealisation. The problem is that every coastal, riverside or mountain-bounded city inherits the same distortion, and most cities are bounded by something. Treat the rings as a gradient, not a geometry.
Homer Hoyt showed the growth runs in wedges
In The Structure and Growth of Residential Neighborhoods in American Cities (1939), Homer Hoyt analysed residential rent data across 142 American cities for the Federal Housing Administration and found that high-rent areas did not form a ring. They formed a sector: a wedge running from the centre out to the edge, usually following a fast transport line, high ground or a waterfront, and usually staying put for decades. This is the single most useful correction to Burgess, because it explains why one side of a city stays expensive across generations while the opposite side at the same radius does not.
Harris and Ullman showed there is rarely one centre
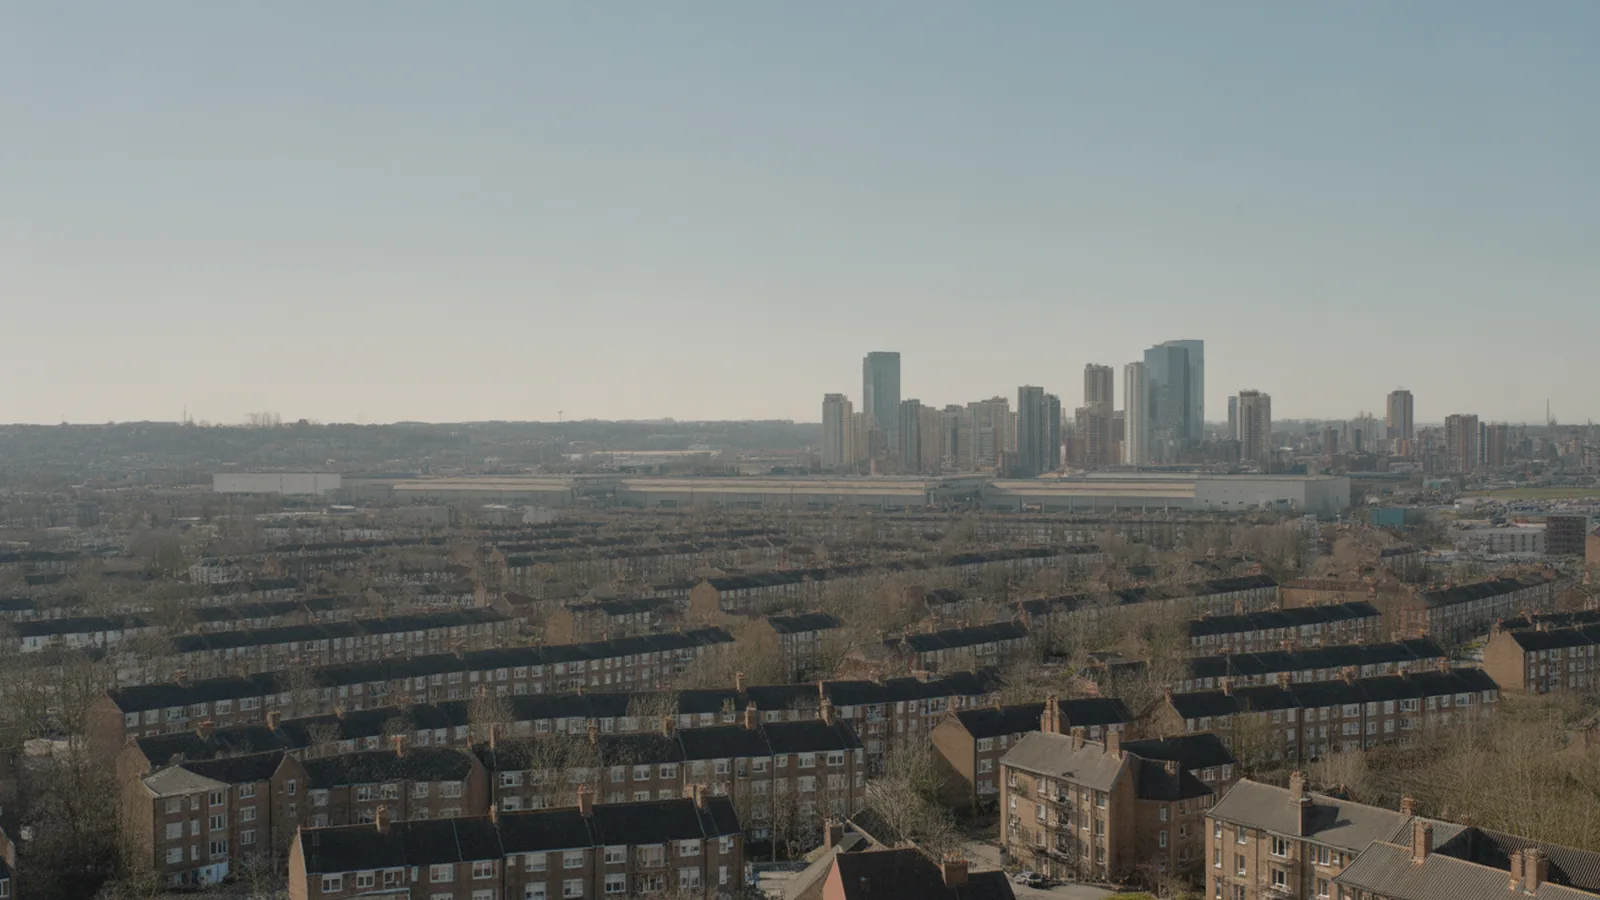
Chauncy Harris and Edward Ullman published “The Nature of Cities” (1945) in the Annals of the American Academy of Political and Social Science, arguing that cities grow around multiple nuclei: a port, a university, an industrial park, an airport, each generating its own land-use gradient. Some uses attract each other, some repel. Their model has no single centre, so it handles polycentric metropolitan regions in a way Burgess cannot.
The rings were not natural, they were drawn by policy
This is the criticism that has aged into the most important one. Burgess’s ecological language, invasion and succession, presents residential sorting as a natural process. It was not. Racially restrictive covenants were in wide use in Chicago by the 1920s, and from 1935 the Home Owners’ Loan Corporation graded neighbourhoods for mortgage risk on colour-coded maps. You can read Mapping Inequality’s scans of the 1940 HOLC map of Chicago and see the grades laid directly over Burgess’s zones. Zone III and the inner edge of Zone IV are where the yellow and red grades cluster. The pattern Burgess described as ecology was in large part underwriting policy.
⚠️ Common Mistake to Avoid
The most common misuse is treating the model as a prediction of where poverty will be. It is not. It is a description of one city at one moment, and the mechanism it proposed for that pattern has been substantially replaced by documented lending and covenant practice. Use it to ask why a gradient exists, not to assume the gradient is inevitable.
Burgess, Hoyt and Harris-Ullman Compared
These three models are usually taught together and are routinely confused with each other. They are not competing answers to the same question; each one privileges a different driver.
| Model | Year | Shape | What drives the pattern | Fits best | Main weakness |
|---|---|---|---|---|---|
| Concentric zone (Burgess) | 1925 | Rings around one centre | Competition for central land; outward invasion and succession | Rapidly growing monocentric industrial cities | Assumes one centre and uniform terrain |
| Sector (Hoyt) | 1939 | Wedges from centre to edge | Transport corridors and rent levels; wedges persist over time | Cities with strong radial rail or road spines | Still assumes one centre; says little about the edge |
| Multiple nuclei (Harris and Ullman) | 1945 | Several independent centres | Land uses that attract or repel each other around separate nodes | Large polycentric metropolitan regions | Harder to draw; less predictive for any single site |
In practice a large city usually shows all three at once. A concentric gradient of building age, a Hoyt wedge of high rent along one corridor, and two or three Harris-Ullman nuclei around an airport or a university. Reading a city well means noticing which one dominates where, not picking a winner. The distribution of tall building clusters in a metropolitan region is a good place to see the difference, since skyline mass tends to follow nuclei rather than rings.
What the Model Still Gets Right
Three things have held up for a century.
- Land value peaks at the centre and decays outward. The specific gradient varies enormously, but the shape is robust. It is why average apartment sizes tend to shrink as you approach a core, independent of country or building culture.
- Building age correlates with distance from the centre. This is often more reliable than the social pattern Burgess described, because it is a consequence of when construction reached that radius. It is a useful first read on likely building obsolescence patterns across a city.
- The zone in transition is real and still moving. Burgess’s Zone II is the concept that survived best. Rename it the gentrification frontier and the mechanism, an inner ring being invaded and its population displaced outward, is the same one urban researchers describe today.
📐 Technical Note
If you want to test the model on a real city rather than take it on faith, the cleanest method is to plot median construction year by distance band from the centre using open municipal data. Building age gives a much crisper concentric signal than income, because age cannot move house. Note that boundary definitions matter: how the US Census Bureau draws urban areas today changed in 2020, so comparing pre- and post-2020 urban area statistics without checking the definition will produce a discontinuity that is entirely artificial.
Terms the Concentric Zone Model Is Confused With
| Term | What it actually is | How it differs |
|---|---|---|
| Concentric model | The same thing. A shortened name for the Burgess model. | No difference. Both names describe the 1925 five-ring diagram. |
| Burgess model | Also the same thing, named after its author. | No difference, though it is occasionally confused with unrelated work by other Burgesses. |
| Sector model | Hoyt’s 1939 wedge model of residential rent. | Wedges from centre to edge, not rings. Driven by transport corridors. |
| Multiple nuclei model | Harris and Ullman’s 1945 model of several centres. | No single centre at all, so no radius to measure from. |
| Von Thünen model | An 1826 model of agricultural land use around a market town. | Rings again, but the driver is transport cost for crops, not social competition. |
| Bid-rent theory | The economic curve of what each land use will pay by distance from the centre. | A mechanism rather than a map. It explains why concentric gradients form. |
| Urban sprawl | Low-density outward growth, usually car-dependent. | A pattern of growth, not a model of internal structure. Sprawl mostly happens beyond Zone V. |
The distinction between a model and a mechanism is worth holding onto. Bid-rent theory explains why land near a centre commands more; the concentric zone model is one possible outcome of that pressure. Hoyt’s sectors and Harris and Ullman’s nuclei are two other outcomes of the same underlying pressure under different transport and terrain conditions.
How Architects Actually Use It
The model earns its place in an architectural workflow in three narrow, concrete ways.
As a first hypothesis in site analysis. Before you have local data, the concentric assumption gives you a testable starting guess about building age, plot size, tenure mix and likely development pressure at your radius. You then look for the Hoyt wedge and the secondary nuclei that break it. A hypothesis you disprove in an afternoon is more useful than no hypothesis at all.
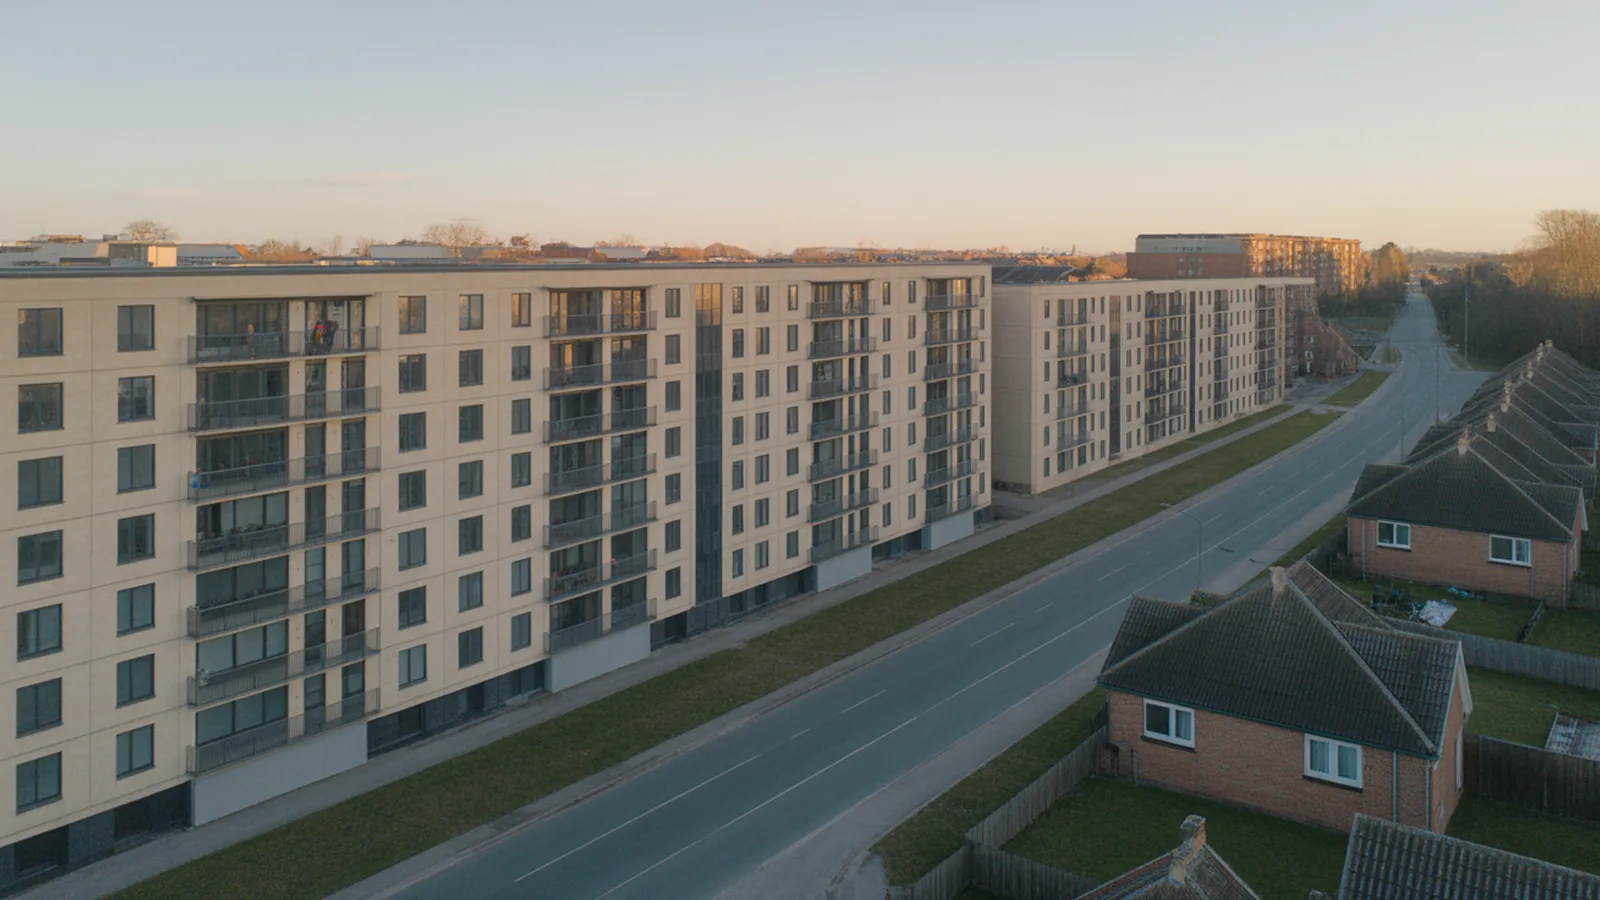
As a way to explain context to a client or a planning committee. The rings are legible to non-specialists in a way that a land-use map is not. This is the same reason the diagram survives in teaching: it compresses a very large amount of urban structure into a shape anyone can read. Writing that reading up clearly is a large part of how architects work at the scale of a city.
As a check on zoning arguments. If you are arguing for a rezoning, the model tells you which ring your proposal is asking to move outward and who is standing in the way of that movement. The mixed-use versus single-use zoning debate is, in Burgess’s terms, an argument about whether Zone I uses should be allowed to appear inside Zone III and IV.
🎓 Expert Insight
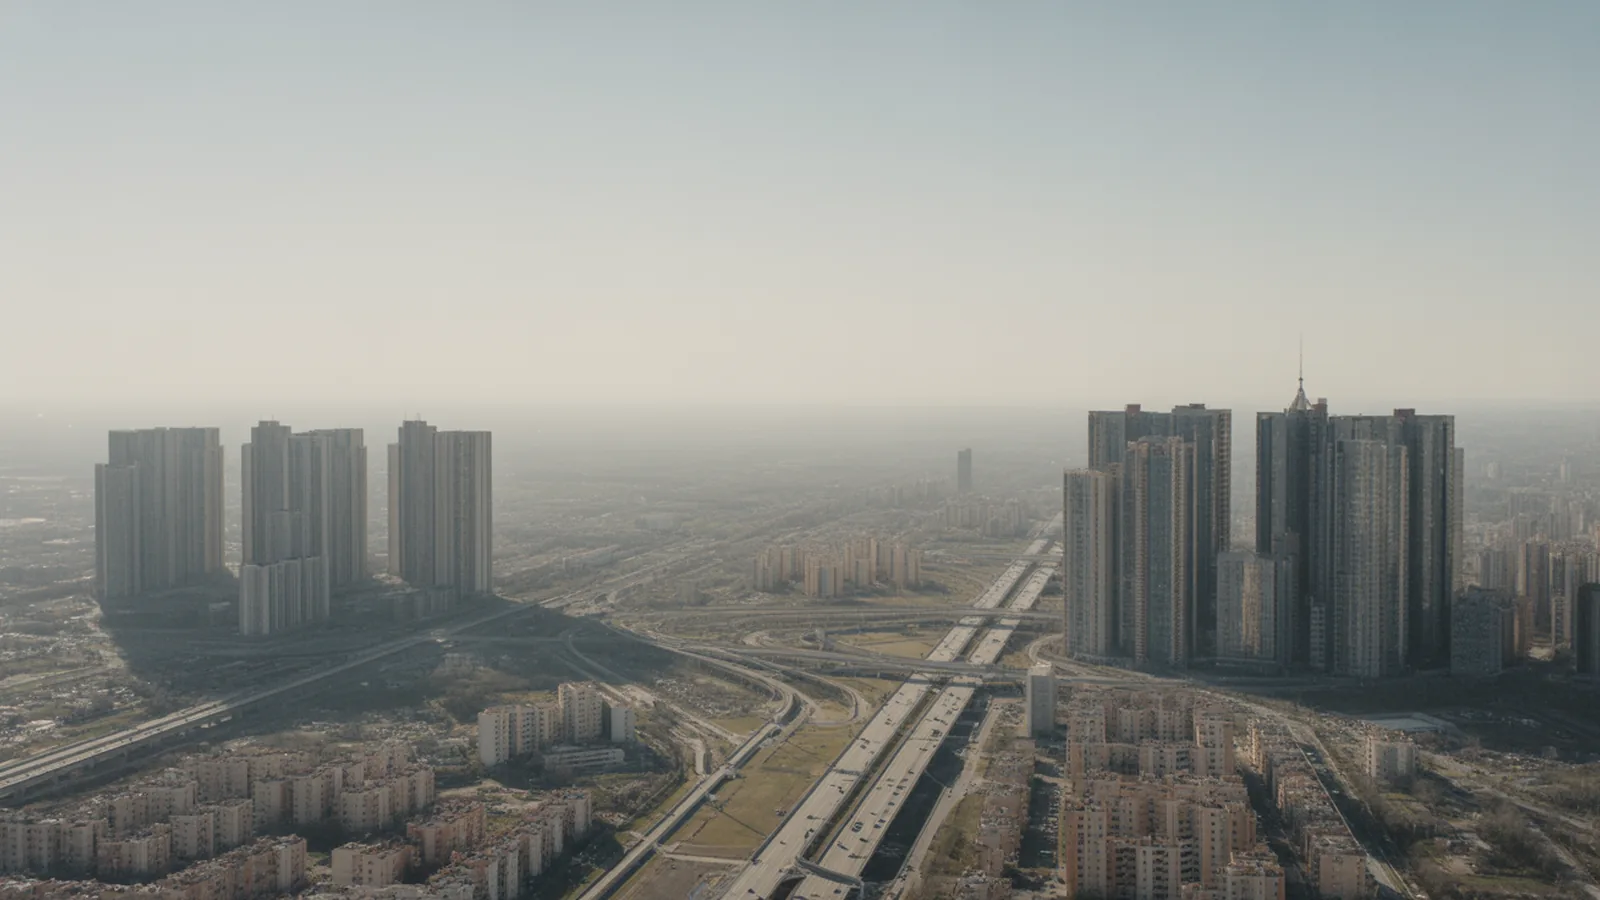
The models were all built on twentieth-century Western industrial cities. They transfer badly to cities that grew under different logics, whether that is a pre-industrial capital with an elite core and a poor periphery, a planned socialist city with microdistricts, or the rapid state-directed development patterns that leave voids where the concentric logic predicts pressure. Before applying Burgess anywhere outside North America, check whether your city ever had the free land market the model assumes.
The Short Version
The concentric zone model is a hundred-year-old snapshot of one American city that turned out to describe a real and repeating gradient: land value and building age fall as you move outward from a centre, and the inner rings expand into the outer ones over time. It gets the mechanism partly wrong, because it presents as ecology a sorting that was substantially produced by covenants and lending policy, and it gets the geometry wrong for any city with a coast, a mountain or more than one centre. Read it alongside Hoyt and Harris-Ullman, treat it as a hypothesis rather than a description, and it remains one of the fastest ways to start reading an unfamiliar city. Concepts like this one sit inside a longer argument about what architecture is and what it is responsible for.






The Third Place: Oldenburg’s Eight Characteristics Explained
Cafés, pubs, barber shops and libraries do social work that homes and...
illustrarch Editoral Team7 Mins read

andre kong studio and Wayward Turn Old Lampposts into Solar-Powered Waylamps in Barnet
Four Waylamps by andre kong studio and Wayward reuse old lampposts as...
illustrarch Editoral Team1 Mins read

Neom Stadium, the Elevated 2034 World Cup Venue, Reportedly Shelved by Saudi Arabia
Two sources told Reuters that Saudi Arabia has put the 46,000 seat...
illustrarch Editoral Team2 Mins read
Mixed-Use Development vs Single-Use Zoning: The Urban Planning Debate
Urban planning has long debated mixed-use development versus single-use zoning. This comparison...
 Sinan Ozen4 Mins read


Leave a comment