

Landscape Architecture Diagrams: 12 Examples Showing Water, Planting and Movement
Twelve real landscape architecture diagrams of water, planting and movement, from Fisk's Mississippi meander maps and Shaker watersheds to Halprin's Skyline Park motation study, with the numbers behind each sheet and what it leaves out.
 illustrarch Editoral Team1 November 202617 Mins read1

Table of Contents Show
Landscape architecture diagrams are simplified drawings that explain how a landscape works: where water drains, how planting changes with height or time, and how people move through a site. Unlike a construction plan, a landscape diagram keeps only the layer that matters, so a single sheet can explain a watershed, a forest belt or a walking route.
The twelve diagrams below are real sheets tied to real places, from Harold Fisk’s 1944 map of the Mississippi’s abandoned channels to a 2025 parking and planting manual for a climate housing estate in Herne. Nine of them are public domain drawings made for U.S. federal surveys, which means you can study them at full resolution. The other three are recent student and office work that shows how the same ideas look on a current board. For each one you get the people behind it, at least one measured number from the sheet or its sources, and an honest note on what the drawing leaves out.
What Makes a Landscape Architecture Diagram Different?
A landscape architecture diagram explains a process that changes over space or time, usually water, vegetation or movement, rather than the arrangement of rooms or volumes. The ground, the weather and the seasons are the subject, so the drawing often needs a profile, a sequence of dates or a flow arrow that a building diagram rarely carries.
Building diagrams follow their own conventions, and our collection of architectural diagram examples covers them, while zoning diagrams have a guide of their own. This list stays outdoors. If you want the step-by-step logic of drawing one, our notes on the diagram design process apply to landscape sheets as well.
The 12 Diagrams at a Glance
| Diagram | Place | Main layer | Made for |
|---|---|---|---|
| Ancient Courses of the Mississippi (1944) | Lower Mississippi Valley | Water over time | Mississippi River Commission |
| Drainage Basin Analysis (2009) | New Lebanon, New York | Watersheds | HALS survey |
| Soils and Constructed Water Systems (2002) | Woodstock, Vermont | Soil and piped water | HALS survey |
| Cranberry Production (2004) | Pemberton, New Jersey | Flooding and harvest | HALS survey |
| Water Regeneration Amphitheatres (2026) | Cali, Colombia | Canal, drainage, transit | Student proposal |
| Prototyping the Bay (2022) | Chesapeake Bay | Marsh and settlement | University studio |
| Klimasiedlung Wiescherstraße (2025) | Herne, Germany | Trees, parking, infiltration | City design manual |
| Climate, Terrain and Vegetation (1996) | Great Smoky Mountains | Forest belts along a road | HAER survey |
| Evolution of Theodore Roosevelt Island (2007) | Washington, D.C. | Land cover in six periods | HALS survey |
| Evolution of the Hill (2006) | Overhills, North Carolina | Ornamental planting | HALS survey |
| Skyline Park Motation Study (2004) | Denver, Colorado | People moving | HALS survey |
| St. Elizabeths Circulation Plan (2009) | Washington, D.C. | Paths and roads | HALS survey |
1. Ancient Courses of the Mississippi River Meander Belt (1944) – Lower Mississippi Valley, USA
Author: Harold N. Fisk | Client: Mississippi River Commission, U.S. Army Corps of Engineers | Set: 15 sheets, Cape Girardeau, Missouri, to Donaldsonville, Louisiana

Fisk’s plates are the best known water diagrams in American landscape culture, and they are diagrams rather than maps for one reason: each sheet overlays many different rivers that never existed at the same time. The legend on Plate 22, Sheet 7 lists 20 numbered stages. The four newest carry dates, 1765, 1820, 1880 and 1944, and the 1944 channel is drawn in plain white on top, so the living river reads as just the latest loop in a tangle of older ones.
The set accompanied Fisk’s report for the Mississippi River Commission, and the full series is held by the American Geographical Society Library in Milwaukee. According to South Writ Large, Fisk and his team spent three years on the investigation, combining field work, engineering survey maps and deep borings drilled by the oil industry. The colour coding is what makes that data usable: you can see at a glance how far the river has wandered from its present levees.
The diagram is also a reminder that confident colour is not proof. A 2008 study by Tristram Kidder and colleagues in Geomorphology reported new coring in the Tensas Basin and concluded that the chronology of a relict Arkansas River channel first mapped on Fisk’s Plate 15 had been significantly misinterpreted. The beauty of the sheets has outlived parts of the science behind them.
2. Drainage Basin Analysis, North Family (2009) – New Lebanon, New York, USA
Drawn by: David Driapsa, ASLA | Survey: Historic American Landscapes Survey, HALS NY-7, sheet 5 of 29 | Scale: 1:8,000

This sheet explains a whole settlement with three watersheds and a set of black arrows. Driapsa splits the slopes of Mount Lebanon into a North basin of 737 acres, a Center basin of 648 acres and a South basin of 866 acres, and draws circles for the Shaker families: East, North, Church, Center, Second and South. Every circle sits on a stream that falls towards the Lebanon Valley and the Shaker Swamp, which is the argument of the drawing. The communities were sited where water could be dammed and used, and the companion sheet in the same survey maps their millponds and waterworks.
The site itself is well documented. The Shaker Museum Mount Lebanon describes Mount Lebanon, founded in 1787, as the first official community organized by the Shakers, and the North Family today keeps 10 original buildings on 91 acres. The survey belongs to the Historic American Landscapes Survey run by the National Park Service, which explains its standard title block.
Read the arrows carefully. Their thickness shows the hierarchy of streams, not measured flow, and the source list at the foot of the sheet runs from Shaker plans of about 1827 to Google Earth in 2009. It is an interpretation built on many documents, which is exactly what a good site analysis diagram should admit.
💡 Pro Tip
When you draw a drainage diagram, trace the watershed boundaries from the contours before you draw a single arrow, and write the area of each basin inside it. Driapsa’s acreage labels are what turn a pattern of arrows into a comparison a client can check.
3. Soils and Constructed Water Systems (2002) – Woodstock, Vermont, USA
Drawn by: Betsy Melrose | Survey: HALS VT-1, sheet 5 of 19 | Park area: 643 acres

Melrose’s sheet stacks three diagrams that answer one question: why is water where it is on this estate? A long section runs from Prosper Road at 1,120 feet over West Peak at 1,440 feet and down to the Ottauquechee River at 680 feet, with a numbered soil type under every stretch. Beside it, four soil profiles go down 65 inches, and a plan below marks springs, wells, water troughs, dams and the pipeline that fed the estate.
The notes give the history behind the lines. The Pogue was a marshy bog until Frederick Billings bought it in 1884, removed the peat and built a dam in 1890, and a pipeline built in 1900 to 1902 carried its water to the mansion, farm and gardens. The sheet also quotes a measured effect: using a modified Soil Conservation Service method, grazed pasture with less than 50 percent ground cover produces nearly one and a half times more runoff than a good stand of forest with understory and leaf litter. That number explains why the diagram pairs soils with water at all. The estate is now Marsh-Billings-Rockefeller National Historical Park, named partly for George Perkins Marsh, whose book Man and Nature appeared in 1864, according to the park’s history.
The weak point is honest and printed in the key: the pipeline is marked “location not field verified”, and the sheet admits that no trace of Charles Marsh’s earlier wooden aqueduct survives. Part of the water system on this diagram is informed inference.
4. Cranberry Production, Whitesbog (2004) – Pemberton, New Jersey, USA
Drawn by: Fatima M. Al-Nammari | Survey: HALS NJ-1, sheet 2 of 13 | Scale: 1:2,395 | Period shown: 1870s to 1930s
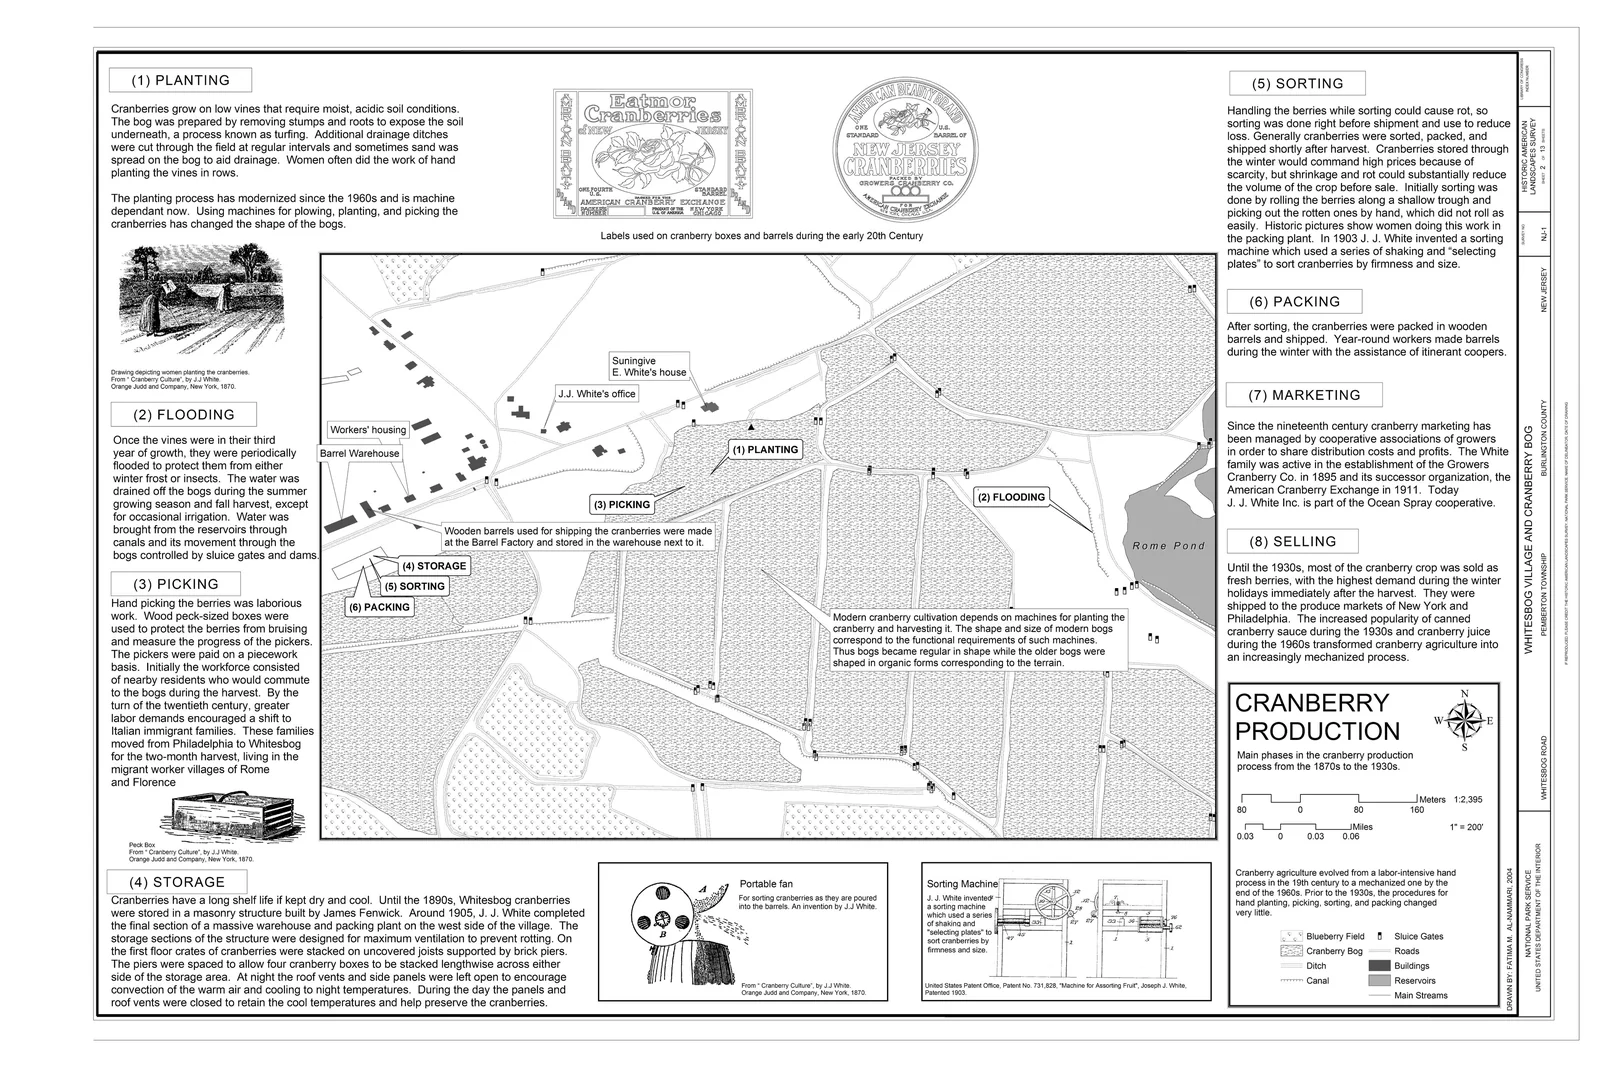
Most process diagrams float on a white page. This one pins each step of cranberry farming to the exact spot where it happened. Eight numbered phases, planting, flooding, picking, storage, sorting, packing, marketing and selling, sit on a plan of bogs, ditches, canals, reservoirs and sluice gates. The flooding note is the heart of it: once vines reached their third year, the bogs were flooded to protect them from winter frost or insects, with water brought from the reservoirs through canals and controlled by sluice gates and dams.
Whitesbog is large enough to need that discipline. The Whitesbog Preservation Trust describes 3,000 acres of cranberry bogs, blueberry fields, reservoirs, sand roads and Pine Barrens forest. It now sits inside Brendan T. Byrne State Forest, and the sheet’s legend even includes blueberry fields, a crop with its own story here.
📌 Did You Know?
The cultivated blueberry was developed at Whitesbog. Elizabeth Coleman White, daughter of the cranberry grower J.J. White, worked with the botanist Frederick Coville to breed a commercial plant from wild Pine Barrens bushes, according to the history of Brendan T. Byrne State Forest.
The diagram’s limit is its date range. The sheet itself notes that planting has been machine dependent since the 1960s and that machines changed the shape of the bogs, so the neat hand process it shows describes a landscape that no longer works this way.
5. Water Regeneration Amphitheatres (2026) – Cali, Colombia
Designer: @entre.estilos | School: Universidad de San Buenaventura Cali | Type: student proposal, labelled axonometric and section

This proposal reads the street as a waterway. According to the project caption, a navigable canal runs along Carrera Séptima and links the Cauca River to Calle 25, with a system of locks to climb the difference in level between the two. The axonometric labels each layer in turn: green bridges over the locks, the urban tram, new edge buildings, a sustainable urban drainage system, the commuter train and the canal itself, while the section below shows the sunken water channel between planted banks and the rail line.
The choice of water as the organising layer makes sense in Cali. The national agency Fondo Adaptación says the Cauca River dike protects about 900,000 residents of eastern Cali, and that its failure could leave 75 percent of the city without drinking water. A proposal that brings river water into the city as a public space is answering a real fear, not decorating a street.
The drawing works as an argument but not yet as engineering. There are no levels for the locks, no flow figures and no source for the canal’s water, so the diagram promises more than it can prove. Our guide to axonometric diagrams explains why the projection flatters this kind of layered scheme.
6. Prototyping the Bay (2022) – Chesapeake Bay, USA
Studio: LAR 7020, Foundation Studio, University of Virginia School of Architecture | Posted: May 2022 | Bay average depth: about 21 feet

This aerial axonometric from UVA’s foundation studio draws a marsh settlement in two colours of line. Existing houses on stilts are outlined in white, while new pavilions, boardwalks and people are drawn in magenta, so the intervention separates from the context without a single label. Water is painted in graded blues, deepest at the shoreline cut, which gives the shallow bay a sense of depth it barely has.
The studio frames the territory as adaptive infrastructure and the landscape as “in a state of flux”. The school reports that the course, now led by Bradley Cantrell and Leena Cho, won the inaugural 2024 to 2025 Tulane Prize for Climate Change Curriculum, with $10,000 shared among the awardees, for work using GIS climate modelling and hydrodynamic simulation. The Chesapeake Bay Program puts the bay’s average depth at about 21 feet and its watershed at about 64,000 square miles, home to more than 18.5 million people, so even a small change in water level reaches a large and crowded territory.
The weakness is legibility outside the studio. The posted frame has no legend, so the broad magenta band crossing the marsh is never explained, and a viewer cannot tell whether it is a path, a flood line or a phase boundary.
7. Klimasiedlung Wiescherstraße Design Manual (2025) – Herne, Germany
Designer: Blaeser Jansen Partner | Client: City of Herne | Site: about 2.3 to 2.5 hectares | Homes planned: 120 to 130
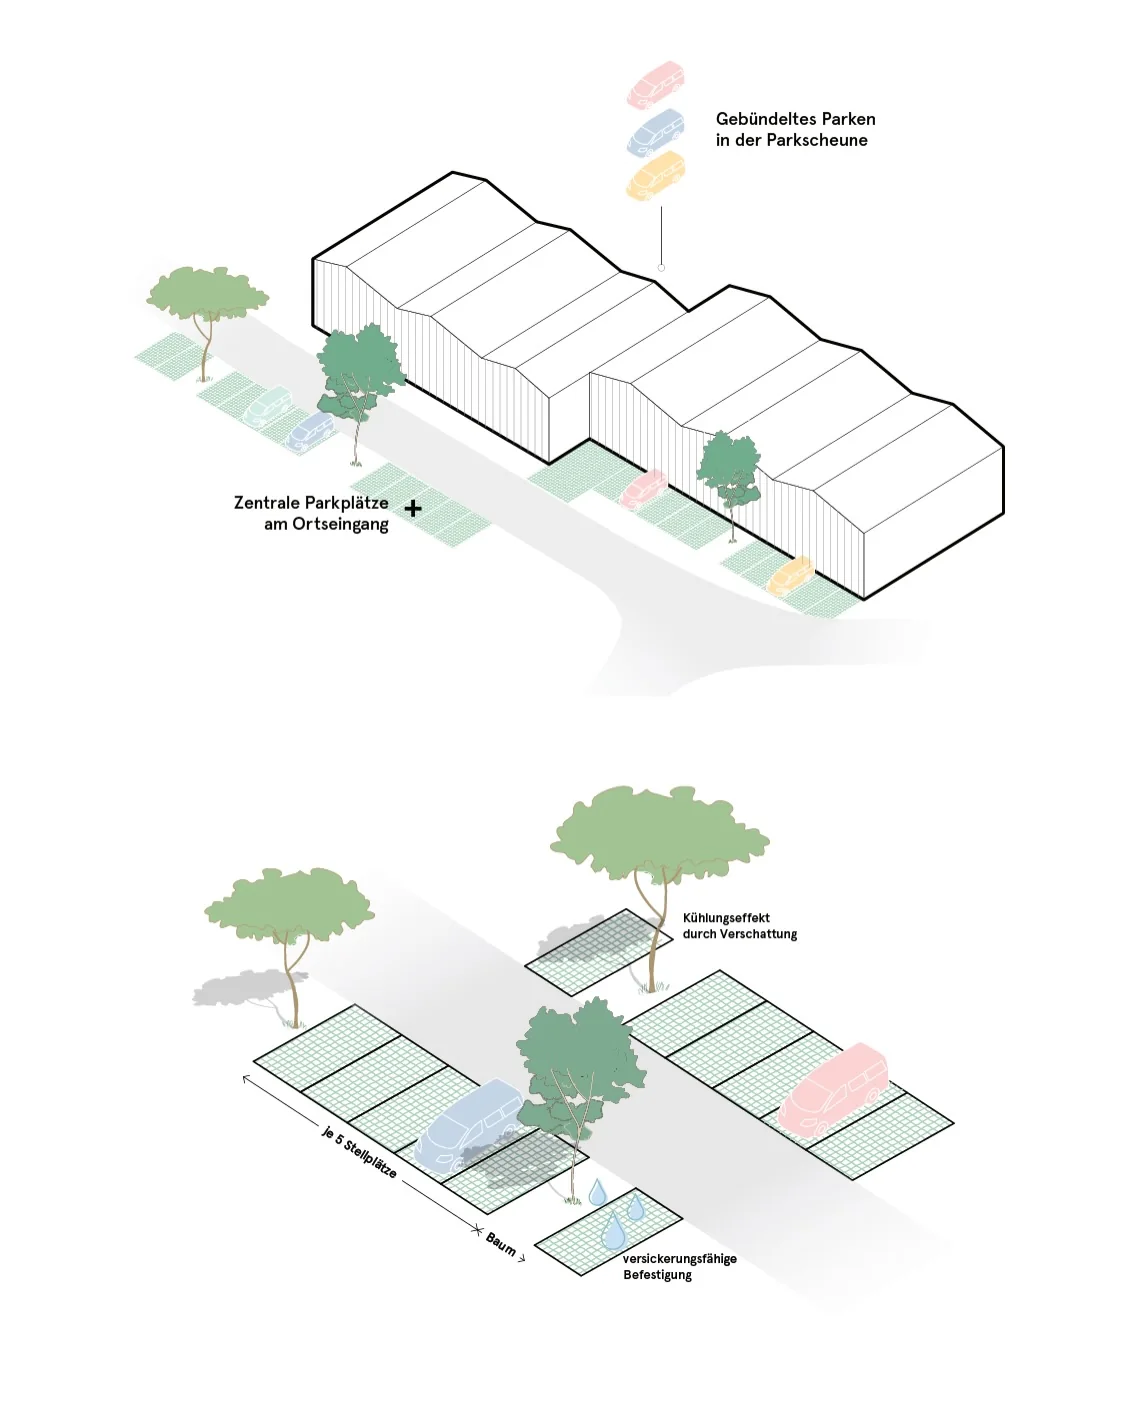
Two small isometric diagrams from this design manual do the work of a planting plan, a drainage strategy and a parking policy at once. The upper one shows cars bundled in a “Parkscheune”, a parking barn at the village entrance. The lower one sets the street rule: one tree for every five parking spaces, shade marked as a cooling effect, and spaces finished in permeable paving, with water drops showing rain soaking into the ground.
The rules come from the brief. The office won first prize in a 2022 competition and says the plan keeps almost all existing trees on the site, which was a former municipal depot and city nursery. The developer SEG Herne adds green roofs and minimal sealed surfaces to hold back rainwater. According to halloherne, 25 percent of the homes will be subsidised and the estimated cost is 60 million euros. These are the same principles as water sensitive design, reduced to one drawing a contractor can follow.
The estate is not built. Demolition of the old depot only began on 29 May 2026, more than four years after the design was presented, because of contamination checks and soil investigations, and first construction is expected from late 2027 at the earliest. The diagram is a promise, not a record.
8. Climate, Terrain and Vegetation, Newfound Gap Road (1996) – Great Smoky Mountains, Tennessee and North Carolina, USA
Drawn by: Dorota Sikora | Survey: Historic American Engineering Record, HAER TN-35, sheet 4 of 11 | Route: Gatlinburg, Tennessee, to Cherokee, North Carolina

Few drawings show movement and planting together as clearly as this sheet. The middle band is the profile of Newfound Gap Road, with geology in the ground and forest belts drawn above the line: acid cove forest at the bottom, cove hardwood on the slopes, a heath bald and red spruce and Fraser fir at the top. Under the profile the road is drawn in plan from Gatlinburg past Chimney Tops to Newfound Gap and down to Smokemont and Cherokee, so a driver’s trip becomes a walk through five plant communities.
The numbers on the sheet explain the bands. Elevations in the park range from 800 to 6,643 feet, temperatures can differ by 10 to 20 degrees Fahrenheit from base to summit, and rainfall rises from about 55 inches a year in the lowlands to 85 inches at the summit the sheet calls Clingmans Dome, now officially called Kuwohi. The spruce and fir forest grows generally above 5,500 feet, and Newfound Gap itself sits at 5,046 feet, the lowest drivable pass through the park.
The clean bands simplify a messy forest. The sheet’s own text says the Fraser fir has been badly ravaged by the balsam woolly adelgid, so the top belt of this diagram was already in decline when it was drawn.
9. The Evolution of Theodore Roosevelt Island (2007) – Washington, D.C., USA
Drawn by: Meghan Clemmens, Anne E. Kidd and Cal J. Mincey | Survey: HALS DC-12, sheet 2 of 14 | Island area: 88.5 acres
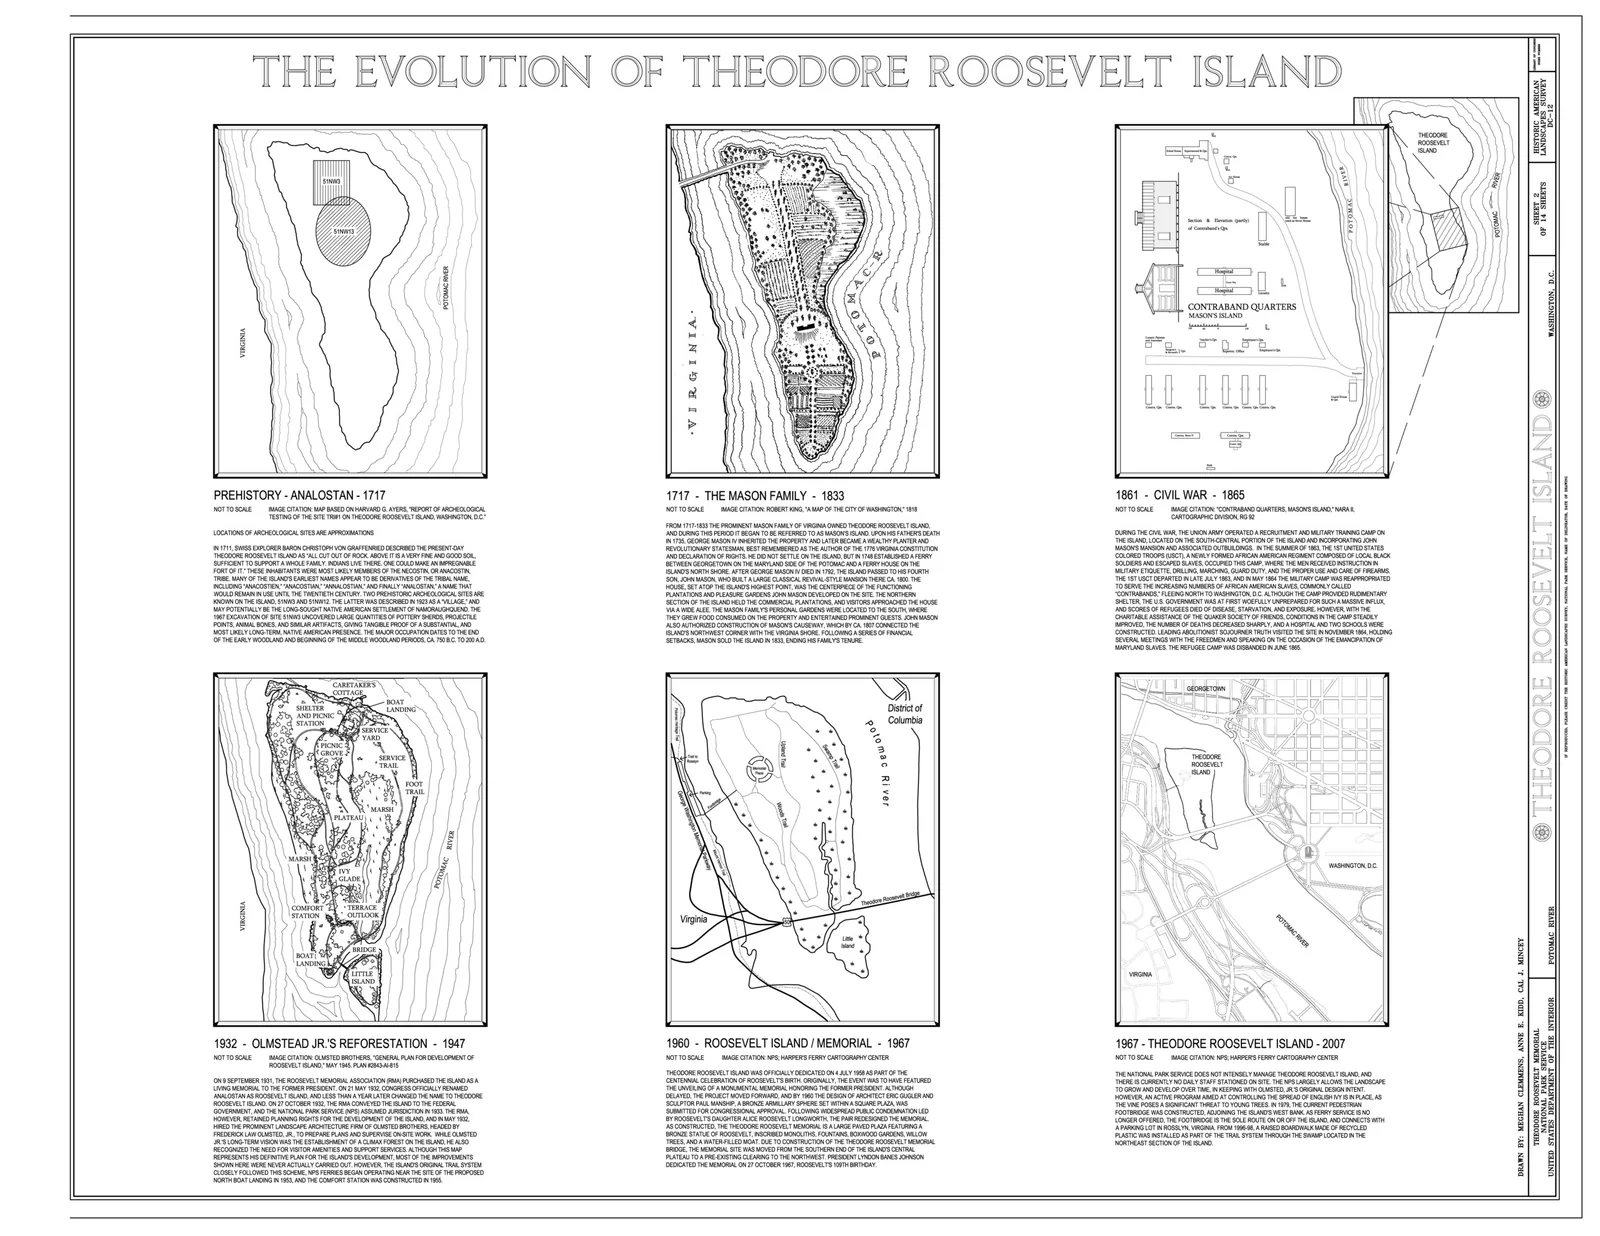
This is a planting diagram told in six frames. The same outline of the island in the Potomac repeats from prehistory to 1717, the Mason family plantation of 1717 to 1833, the Civil War camp of 1861 to 1865, Olmsted Jr.’s reforestation of 1932 to 1947, the memorial years of 1960 to 1967 and the island from 1967 to 2007. Because the outline never changes, your eye reads only what grows on it: gardens and fields, then barracks, then dense woodland.
The reforestation frame is the one designers study. The notes say the Olmsted Brothers were hired in 1932 and that Frederick Law Olmsted Jr.’s long-term aim was a climax forest on the island. The island’s history records that the Civilian Conservation Corps had cleared much of it by 1935, and that the memorial by Eric Gugler, with Paul Manship’s 17-foot statue, was dedicated on 27 October 1967. The National Park Service manages the island today.
The sheet is frank about the gap between plan and outcome. It states that most of the improvements on Olmsted’s 1945 plan were never carried out, and that English ivy is a significant threat to young trees, so the forest in the last frame grew mostly under a policy of letting the island develop on its own, not from the plan Olmsted drew.
10. Ornamental Landscape: Evolution of the Hill (2006) – Overhills, North Carolina, USA
Drawn by: The Jaeger Company | Survey: HALS NC-3, sheet 6 of 13 | Frames: 1913, 1925, 1938

Three small plans of the same hilltop show how an estate’s planting grew around its buildings. The key has only five symbols, deciduous tree, evergreen, shrub mass, road and tree line, and that restraint lets you count the evergreen stars spreading from a few by the golf path in 1913 to belts along the entrance drives in 1925 and a whole informal evergreen garden in 1938. The notes explain the choice: many plants were evergreen or bloomed in winter or early spring, because the estate was a winter resort.
The documentation fills in the cast. According to the Historic American Buildings Survey report on Overhills, the Lindley Nursery bought about 650 acres here in 1911 for nursery fields, and stock such as Burford and American hollies, magnolia, dogwood, nandina and camellia was planted on the Hill. Donald Ross designed the golf course the clubhouse faced by 1916, Percy Rockefeller and W. Averell Harriman built cottages, and the district has 50 contributing structures built between 1906 and 1938.
The diagram also records loss. The clubhouse at the centre of the 1913 frame was demolished in 1945, the sheet says only that one shrub formation “may have been” a formal garden, and the Army bought the estate in 1997, after which the survey listed its present use as vacant.
11. Motation Study, Skyline Park (2004) – Denver, Colorado, USA
Park designer: Lawrence Halprin & Associates, built 1972 to 1975 | Drawn by: Jon Hunt and Ann Komara, University of Colorado Denver | Survey: HALS CO-1, sheet 8 of 11 | Area: about one acre over three blocks
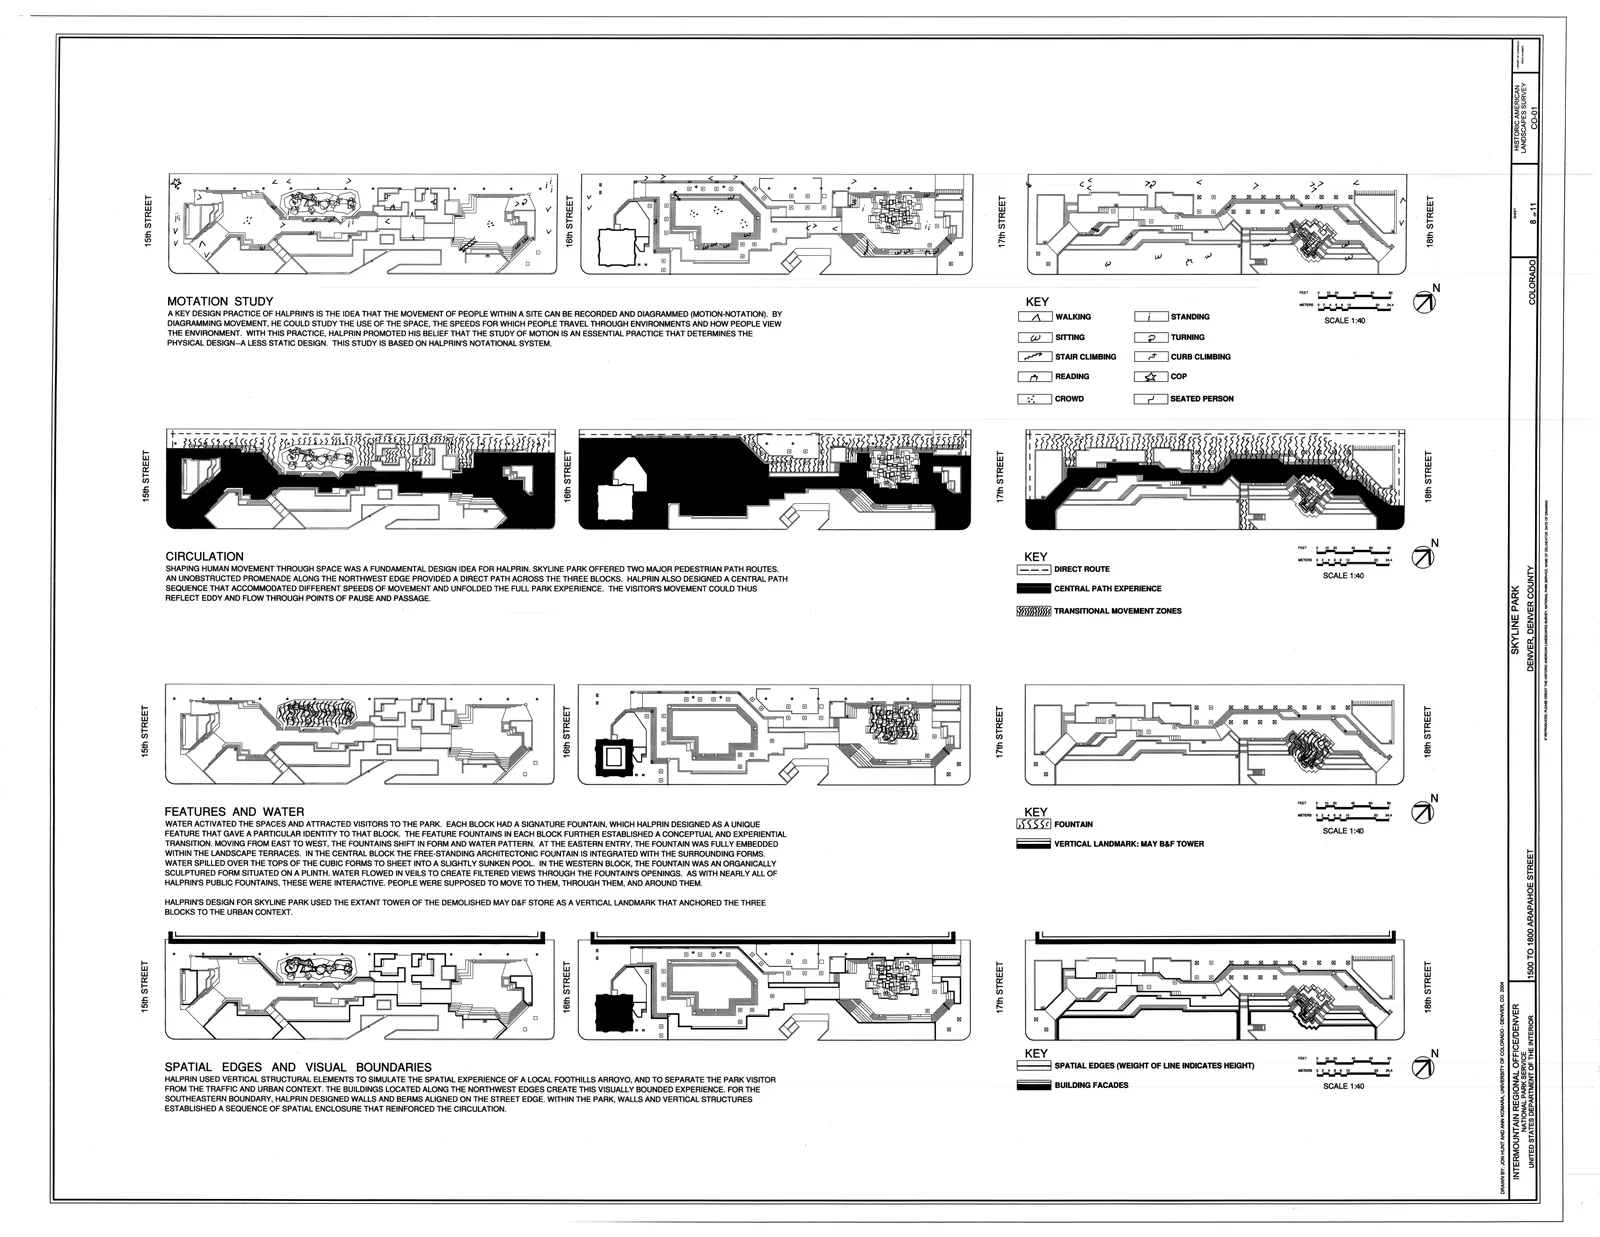
Halprin believed that movement could be recorded like music, and he called his notation “motation”. This sheet applies it to his own park. The top strip plots ten symbols, walking, sitting, stair climbing, reading, crowd, standing, turning, curb climbing, seated person and even a police officer, across the three blocks between 15th and 18th Streets. The strips below map circulation, the three fountains and the walls that edge the park, each in its own key.
The circulation strip shows the logic behind the plan: an unobstructed promenade along the northwest edge for people in a hurry, and a central path sequence with transitional zones for people who want the full park. According to The Cultural Landscape Foundation, the park was sunken below street level, heavily planted at the edges and built between 1972 and 1975 with one geometric fountain per block. Halprin’s wider work is profiled on the foundation’s Lawrence Halprin page, and our guide to the circulation diagram covers the building version of the same idea.
💡 Pro Tip
To make your own motation study, sit on site for a fixed period, say twenty minutes at lunchtime and twenty in the evening, and mark each person with a symbol from a key of no more than ten. Two sessions drawn side by side show where a plaza works and where people only pass through.
The study now documents something largely gone. The foundation records that use declined in the 1980s, and a 2003 redesign removed two of the three fountains and the berms and replaced the planting with a simpler palette and large areas of lawn. The park is on its at-risk list.
12. Circulation, Elements and Objects Plan, St. Elizabeths West Campus (2009) – Washington, D.C., USA
Drawn by: Heritage Landscapes | Survey: HALS DC-11, sheet 7 of 7 | Campus: 182 acres
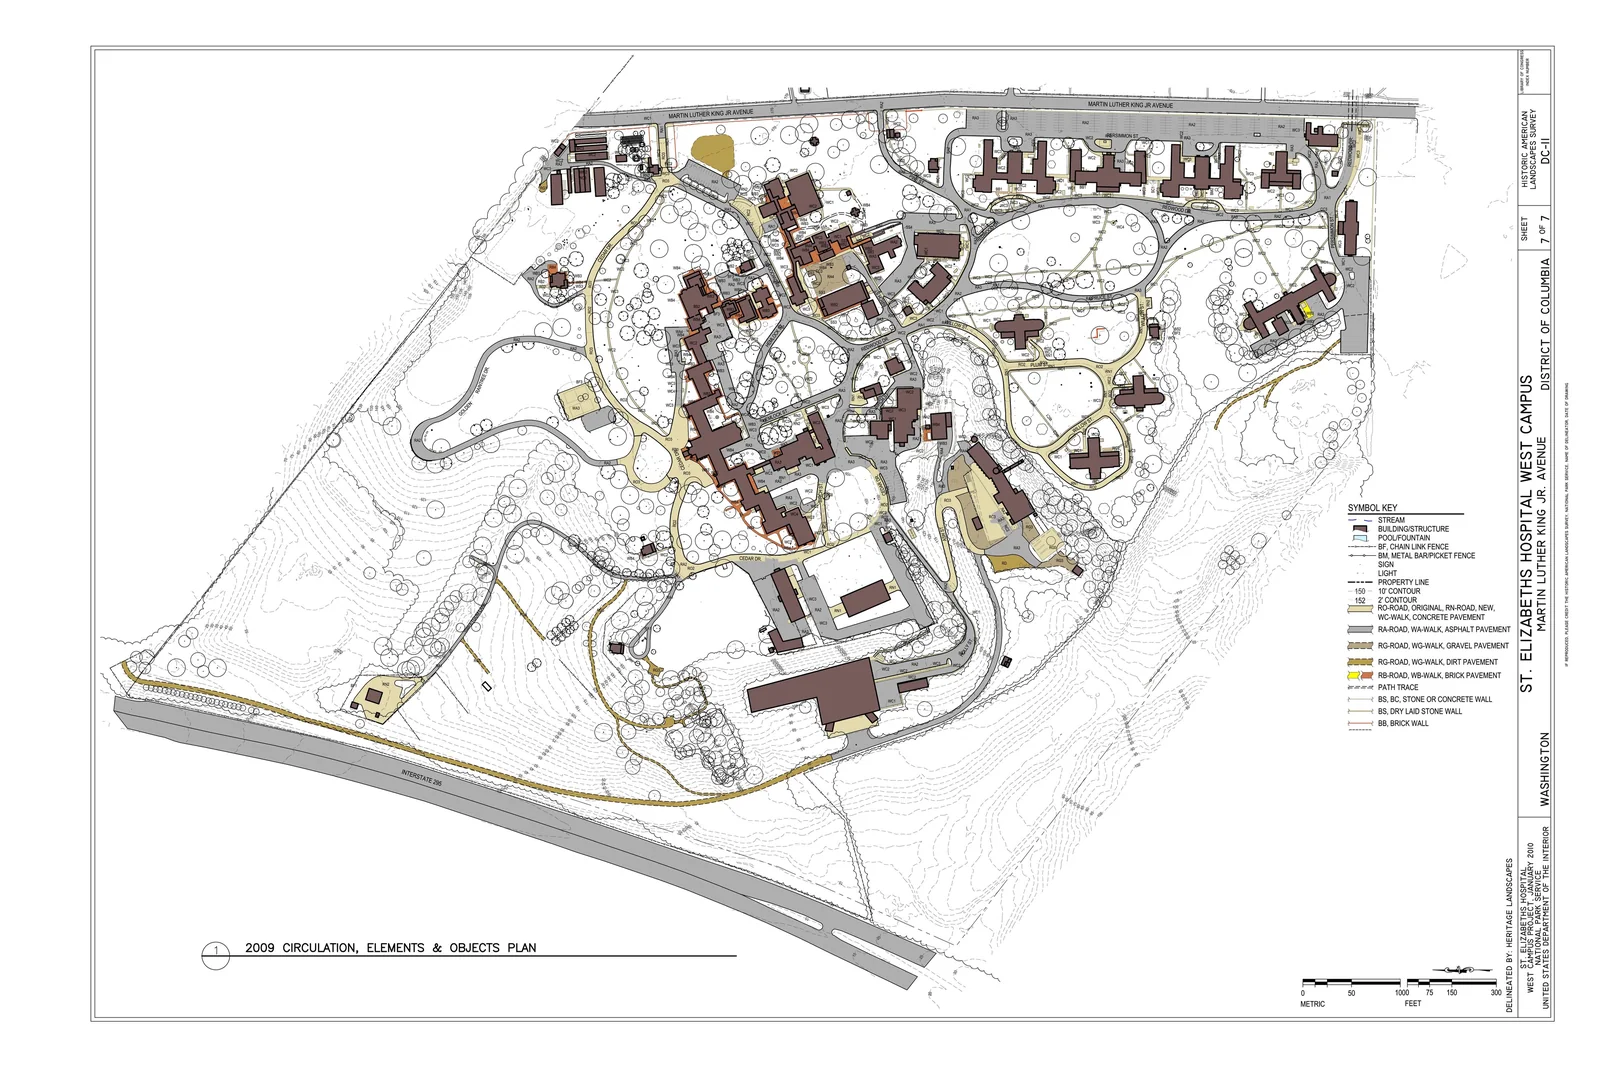
This sheet sorts every route on a historic hospital campus by what it is made of and when it was built. Original roads, new roads, asphalt, gravel, dirt and brick walks each get their own tone, path traces mark routes that have faded, and walls are drawn by type. The same survey includes a matching plan for 1937, so the two sheets together work as a before and after of movement across the grounds: which routes survived and which were added or lost.
The campus explains why that matters. According to the history of St. Elizabeths Hospital, Congress funded it in 1852 on legislation written by Dorothea Dix, it opened to patients in 1855, and its Center Building by Thomas U. Walter follows the Kirkbride Plan. The National Trust placed it on its list of most endangered places in 2002, and it became a National Historic Landmark in 1990.
The diagram was drawn on the eve of major change. In 2007 the Department of Homeland Security announced a plan to consolidate at least 60 facilities into a 4.5 million square foot headquarters here, and preservationists warned it would destroy dozens of historic buildings. A circulation plan cannot stop that, but it fixes the historic pattern on paper before construction begins.
Honorable Mentions
Valley Section (1909) – Edinburgh, Scotland
Patrick Geddes developed his Valley Section, a profile linking geography to the “natural occupations” such as hunting, mining and fishing that it supports, after helping plan the Zoological Gardens in Edinburgh in 1909. It stays outside the main list because it describes a model valley rather than one real site, and the public domain copy on Wikimedia Commons is too small to reproduce.
Garden City Diagram (1898) – England
Ebenezer Howard’s diagrams in To-morrow: A Peaceful Path to Real Reform set a garden city of 32,000 people on 9,000 acres, arranged in rings of open space and crossed by six boulevards 120 feet wide. They are planning diagrams more than landscape diagrams, which is why they sit here.
The Woodlands Drainage Plan – Texas, USA
Ian McHarg, author of Design with Nature (1969), shaped The Woodlands north of Houston around natural drainage, a system that limited runoff and was much cheaper than a conventional drainage network. His layered drawings would top many lists, but they are not in the public domain, so they could not be shown here.
Patterns Across the Twelve Diagrams
Water is drawn as a system, not a line
None of the water diagrams here shows a river as a single blue stroke. The Mount Lebanon sheet divides land into three basins with acreage, Whitesbog draws reservoirs, canals and sluice gates as one controlled network, and Marsh-Billings ties springs and pipelines to the soils that feed them. Even the Cali proposal treats its canal as part of a ring of rivers, rail and drainage. The lesson is to draw where water comes from and where it goes, not only where it sits.
Time is the hidden axis
Four of the twelve are really timelines. Fisk numbers twenty river stages, Theodore Roosevelt Island repeats one outline across six periods, Overhills compares 1913, 1925 and 1938, and the St. Elizabeths plan pairs with a 1937 sheet. Landscapes change faster than buildings, so a diagram with dates often explains more than a perfect plan of a single moment.
Movement and planting share the sheet
The Newfound Gap Road profile turns a drive into a sequence of forest belts, Skyline Park sets Halprin’s movement symbols beside its fountains, and the Herne manual ties each run of five parking spaces to a tree. In each case the route and the vegetation explain each other, which is something a separate circulation diagram and planting plan would miss.
The survey outlives the landscape
Several of these sheets record places that have since changed beyond recognition. Skyline Park lost two fountains in 2003, the Overhills clubhouse came down in 1945, Whitesbog moved to machine harvesting, and St. Elizabeths has become a federal headquarters campus. The HALS drawings now hold information the ground itself no longer shows.
Frequently Asked Questions
Which landscape architecture diagram in this list is the oldest?
Harold Fisk’s Mississippi meander belt sheets from 1944. The survey drawings were made later, but they record older landscapes: the Theodore Roosevelt Island sheet starts before 1717, and the Overhills sheet starts in 1913.
Which diagram covers the largest area?
Fisk’s set, which spans the Lower Mississippi from Cape Girardeau, Missouri, to Donaldsonville, Louisiana, across 15 sheets. The smallest site is Skyline Park in Denver, about one acre over three city blocks.
Which of these diagrams show landscapes that do not exist yet?
Three of them. The Water Regeneration Amphitheatres in Cali and Prototyping the Bay are student proposals, and the Klimasiedlung Wiescherstraße in Herne is planned, with construction expected from late 2027. The other nine record landscapes that exist or once existed.
What This Means for Your Next Project
The strongest sheets here are the plainest ones: three basins with their acreage, eight numbered steps on a bog, ten symbols for how people move. They work because each one picks a single process and draws only what that process needs, which is a habit worth taking into any landscape architecture project.
Your Next Step: Pick one process on your site, water, planting or movement, and draw it at two different dates on the same base outline, the way the Theodore Roosevelt Island and Overhills sheets do, before you add anything else to the board.





Landscape Master Plan Examples: 10 Parks, Waterfronts and Campuses
Ten real landscape master plans, from the 1862 Bois de Boulogne sheet...
illustrarch Editoral Team14 Mins read

Landscape Architecture Section Drawings: 12 Examples and How They Are Built
Twelve real landscape sections, from Salomon Kleiner's Weißenstein garden profile and the...
illustrarch Editoral Team17 Mins read
Landscape Architecture Drawings: Plans, Sections and Diagrams Explained with Real Examples
Seven real landscape architecture drawings, one for each type: the Emerald Necklace...
illustrarch Editoral Team11 Mins read

Top Rated Landscape Architecture Schools in the US, Europe, and Beyond
From Harvard GSD and UC Berkeley to Wageningen University in Europe, the...
 Sinan Ozen10 Mins read


Leave a comment