

Architectural Diagrams: 10 Best Examples & Types Explained
Architectural diagrams are essential tools for communicating design ideas. This article showcases 10 real architecture diagram examples by architects, covering creation diagrams, exploded axonometric views, program diagrams, urban analysis, and sectional diagrams — with tips on how to create your own.
 Elif Ayse Sen23 January 202622 Mins read2.3k

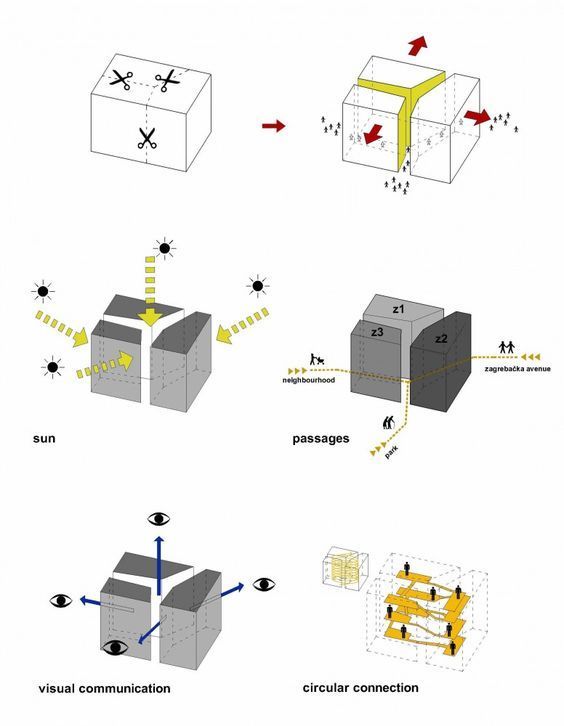




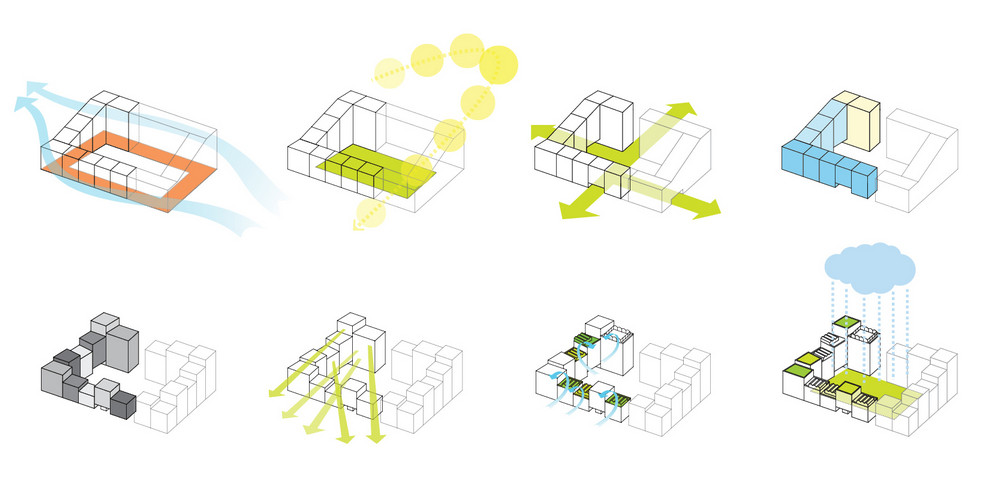

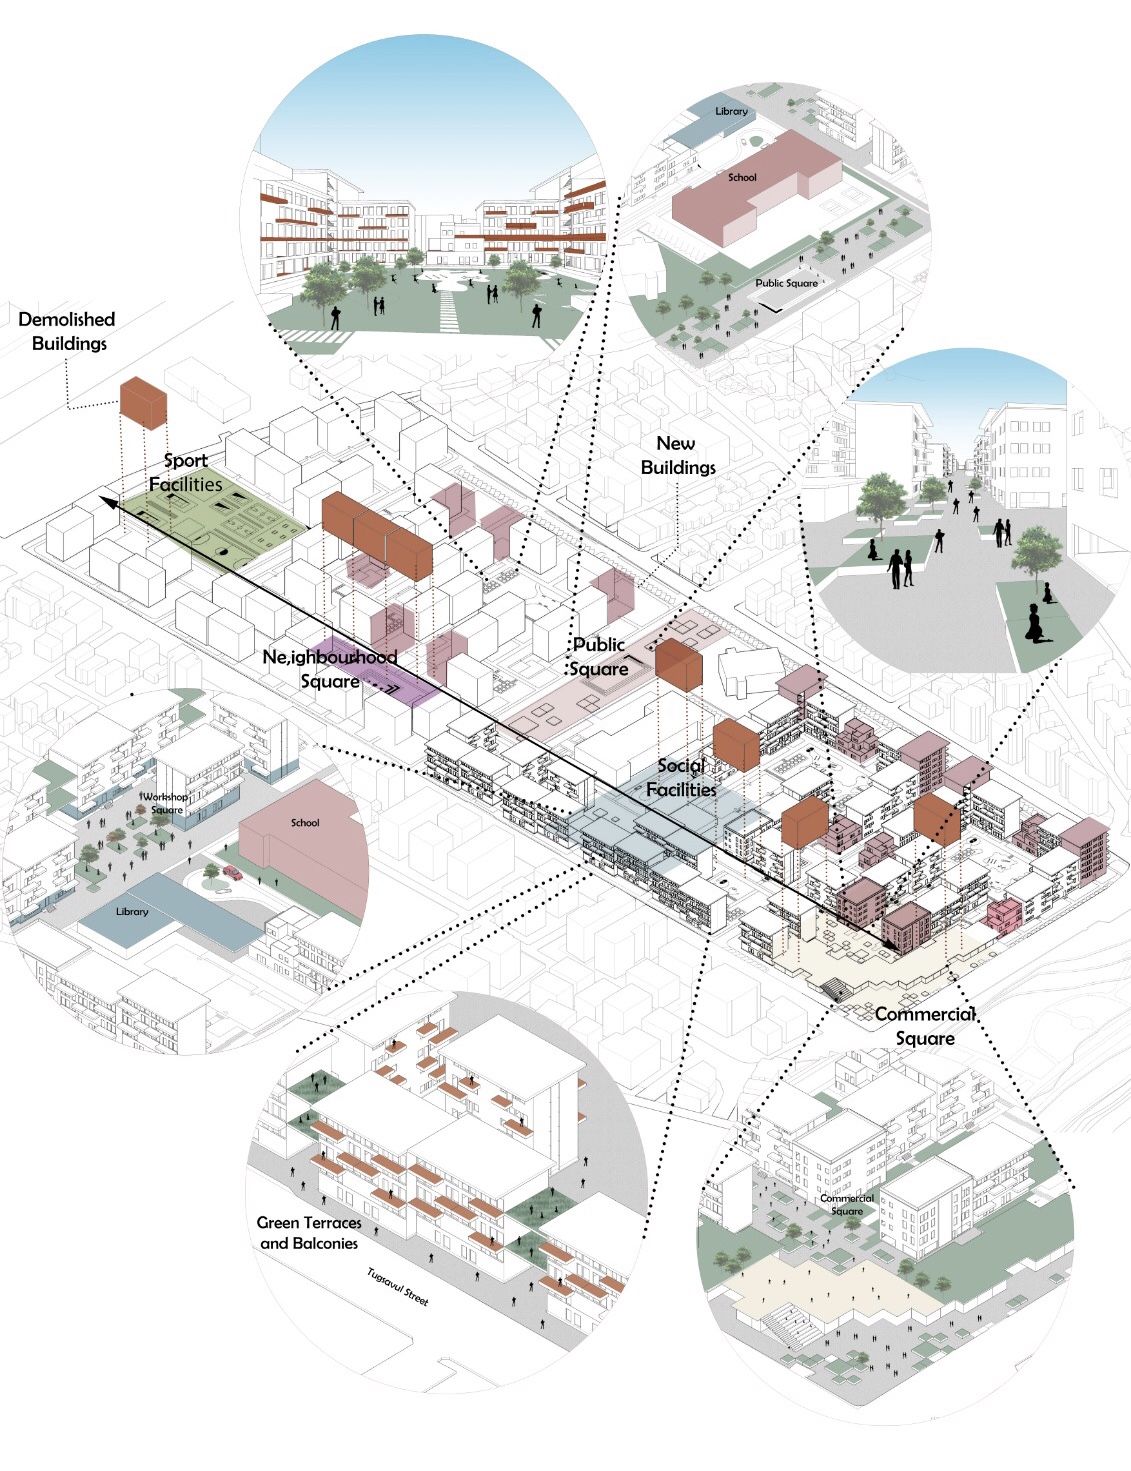
Table of Contents Show
Quick Answer: Architectural diagrams are simplified visual tools that communicate a building’s spaces, systems and ideas. Common types include bubble, parti, circulation, axonometric, section, structural and zoning diagrams. Architects use them throughout design – from early concept to presentation – to study relationships, explain decisions and turn abstract thinking into clear, shareable graphics.
An architectural diagram is a graphic representation in which the various components of a building or other structure, or of a city or landscape, are represented so as to show their relations. Architectural diagrams are usually created by architects in order to show a building or part of a building. The architecture diagram can also be used in order to present how different buildings will look like when they are finished. Whether you are working on a professional project or a student assignment, understanding architectural diagramming is essential for effective visual communication in the design process.
Architectural diagrams are graphic tools that translate complex spatial and functional information into clear visual communication. They show relationships between spaces, environmental conditions, and program organization, and are used by architects at every stage of the design process, from early concept sketches through construction documentation. Each diagram type targets a specific communication goal, making them indispensable for both student studio presentations and professional client deliverables.
The types of architectural diagrams available can vary depending on the field and profession the architect belongs to. They are created using specialized graphic software to show the physical relationship between people, objects, and environmental features. Architectural diagrams help you to organize data in a graphical form. They are also standardized and follow a set of guidelines. For that reason, architectural diagrams are preferred from architectural students and architects. If you are looking for architecture diagram examples to improve your own work, studying successful projects from experienced diagram architects is one of the best approaches.
Architects use architectural diagrams to make their project clear and understandable for clients. Different types of architectural diagrams are used for professional architectural presentations as well as architectural student presentations. A well-crafted architecture design diagram bridges the gap between complex technical concepts and clear visual storytelling, making it an indispensable tool in every architect’s workflow.
In this article, we will see the best 10 examples of successful architectural diagrams by architects. You can get inspirations from this article before design architectural posters. First of all, let’s be clear about architectural diagrams.
What Is a Diagram in Architecture?
A diagram in architecture is a simplified visual representation used to communicate design concepts, spatial relationships, and functional organizations within a building or space. Unlike detailed technical drawings such as floor plans or construction documents, diagrams in architecture focus on conveying ideas at a higher level of abstraction. They use shapes, lines, arrows, and annotations to express how spaces relate to each other, how circulation flows through a building, or how a concept translates into physical form.
Architectural diagrams serve as a bridge between abstract thinking and tangible design outcomes. According to the American Institute of Architects (AIA), diagrammatic thinking is one of the most fundamental skills in design education and practice. Diagrams allow architects to test ideas quickly, iterate on spatial organizations, and share their vision with clients, engineers, and fellow designers without requiring technical expertise to understand. As Archisoup notes, diagrams operate precisely between form and word, making them especially valuable for communicating design ideas during the conceptual phase.
Diagrams also differ from renderings and 3D models in one important way: they prioritize clarity of an idea over visual realism. A rendering shows what a building might look like, but an architecture diagram shows why the building is organized the way it is. This distinction is why diagram architects at firms like BIG (Bjarke Ingels Group) and OMA frequently open their presentations with diagram sequences before showing any rendered imagery.
📌 Did You Know?
Architectural theorist Robert Somol described diagrams as operating “precisely between the form and the word.” This positioning is why diagrams are uniquely effective for translating spatial ideas to clients, contractors, and the public, who may not read technical drawings fluently.
Why Are Architectural Diagrams Important?
Architectural diagram importance:
– They can be used as a template for the construction permit drawings.
– They provide immediate information about complex systems.
– They can be used to show how a building will look when it is finished.
– Models that are created to scale on a computer can be copied and pasted into the architect’s CAD program and edited on screen to show changes made during design reviews.
Beyond these practical uses, architectural diagrams play a critical role in the early stages of design development. They allow architects to test concepts quickly, explore spatial relationships, and communicate with clients and collaborators before committing to detailed drawings. A strong sample architecture diagram can also serve as a reference point throughout the entire project lifecycle, from the initial concept phase to final construction documentation. According to the American Institute of Architects (AIA), effective diagramming is a foundational skill for design professionals at every level.
📌 Did You Know?
According to the AIA’s 2023 Firm Survey, over 78% of architecture firms report that diagramming is introduced in the earliest phases of a project, before any detailed drawings are produced. This reflects a broad consensus that visual communication tools like architectural diagrams are not supplementary, they are foundational to the design process itself.
When Do Architects Create Diagrams?
Architects create diagrams in a variety of situations, but some common examples include:
-During the design phase of a project, architects create diagrams to communicate their ideas and concepts to clients and team members. These diagrams might include architect concept sketches, floor plans, elevations, and 3D models.
-Architects create diagrams as part of the construction documentation process to provide detailed information on materials, dimensions, and specifications for contractors and builders.
-Architects may create diagrams to illustrate compliance with building codes and regulations, such as fire safety, accessibility, and structural requirements.

– Architectural diagrams can be created for presentations to demonstrate the design and functionality of a project to clients, stakeholders, and the public. Learn more about creating architectural presentation sheets for professional project delivery.
-Diagrams can be used to analyze and optimize different aspects of a project, such as energy efficiency, natural lighting, and space utilization.
-During architectural presentation board preparation, diagrams function as the visual backbone that connects each section of the board into a unified narrative.
You can also see how architectural diagrams support every stage of design, from early concept exploration to final presentation.
Types of Architecture Diagrams
Understanding the different types of architecture diagrams helps you choose the right approach for your specific project needs. Each type serves a distinct purpose in the diagrammatic design process. Below is an overview of the most common diagram categories used in practice today.
| Diagram Type | Best Used For | Design Stage |
|---|---|---|
| Concept Diagram | Capturing core design idea | Earliest concept |
| Bubble Diagram | Spatial adjacencies and zoning | Programming |
| Parti Diagram | Single organizing principle | Schematic design |
| Circulation Diagram | Movement and flow analysis | Schematic to design development |
| Site Analysis Diagram | Environmental and contextual factors | Pre-design / site analysis |
| Block Diagram | Functional zone hierarchy | Master planning |
| Program Diagram | Function distribution and area allocation | Programming to schematic |
| Exploded Axonometric | Layer-by-layer building breakdown | Design development to presentation |
Concept Diagram
A concept diagram in architecture captures the initial ideas, driving themes, and overarching vision behind a project. It is the most abstract type, often using simple shapes and annotations to represent the core design intent. You can learn more about this critical diagram type in our detailed guide on conceptual diagrams in architecture.
Bubble Diagram
Bubble diagrams use circles to represent spatial zones and their relationships. They are among the first tools architects use to explore adjacencies, circulation paths, and functional groupings before committing to detailed floor plans. Try our free Bubble Diagram Maker tool to start planning your spaces.
What Is a Parti Diagram in Architecture?
A parti diagram is a simplified schematic that captures the single organizing idea behind a building, often referred to as parti pris in the French Beaux-Arts tradition. While a concept diagram explores broad themes, the parti commits to one decisive move that drives every spatial decision afterward. A clear parti diagram is one of the most powerful tools you can present to a jury or client because it reduces a complex project to a single readable idea.
Circulation Diagram
A circulation diagram maps how people move through and interact with a building, highlighting entry points, corridors, vertical circulation elements like stairs and elevators, and the flow patterns within spaces.
Site Analysis Diagram
These diagrams illustrate environmental and contextual factors, including sunlight direction, wind patterns, topography, views, and surrounding infrastructure, that inform design decisions about building placement and orientation.
Block Diagram
An architecture block diagram breaks down the building into major functional blocks or zones, showing their proportional sizes and organizational hierarchy. This approach is particularly useful in landscape architecture diagrams and master planning, where large areas need to be organized into coherent zones.
Program Diagram
A program diagram displays how activities and functions are distributed across a building project. Color-coded zones, pie charts, or stacked bars show the percentage or square footage allocated to each use, making it particularly effective for mixed-use developments where balance between residential, commercial, and public space must be clearly communicated.
Exploded Axonometric Diagram
An exploded axonometric diagram separates a building into its individual layers (structure, envelope, circulation, services) along a vertical or horizontal axis. This technique allows viewers to understand both the individual components and how they assemble together, making it a favorite for competition boards and portfolio presentations.
💡 Pro Tip
When drawing a bubble diagram for a real project, size each bubble proportionally to the actual square footage required by that space. A common mistake is drawing all bubbles the same size, which hides scale problems until you start blocking out the floor plan and realize the kitchen is half the size it should be.
For a complete overview of all diagram categories, see our article on architectural diagram types, or our dedicated student guide to architectural diagrams. You can also explore the most utilized types of architectural diagrams for additional examples of how different firms apply these categories in practice.
Every Diagram Type, One Page Each
Each type below has its own guide with worked examples and drawings made in our own tool. Start with the one your project needs now; the order roughly follows a real design sequence.
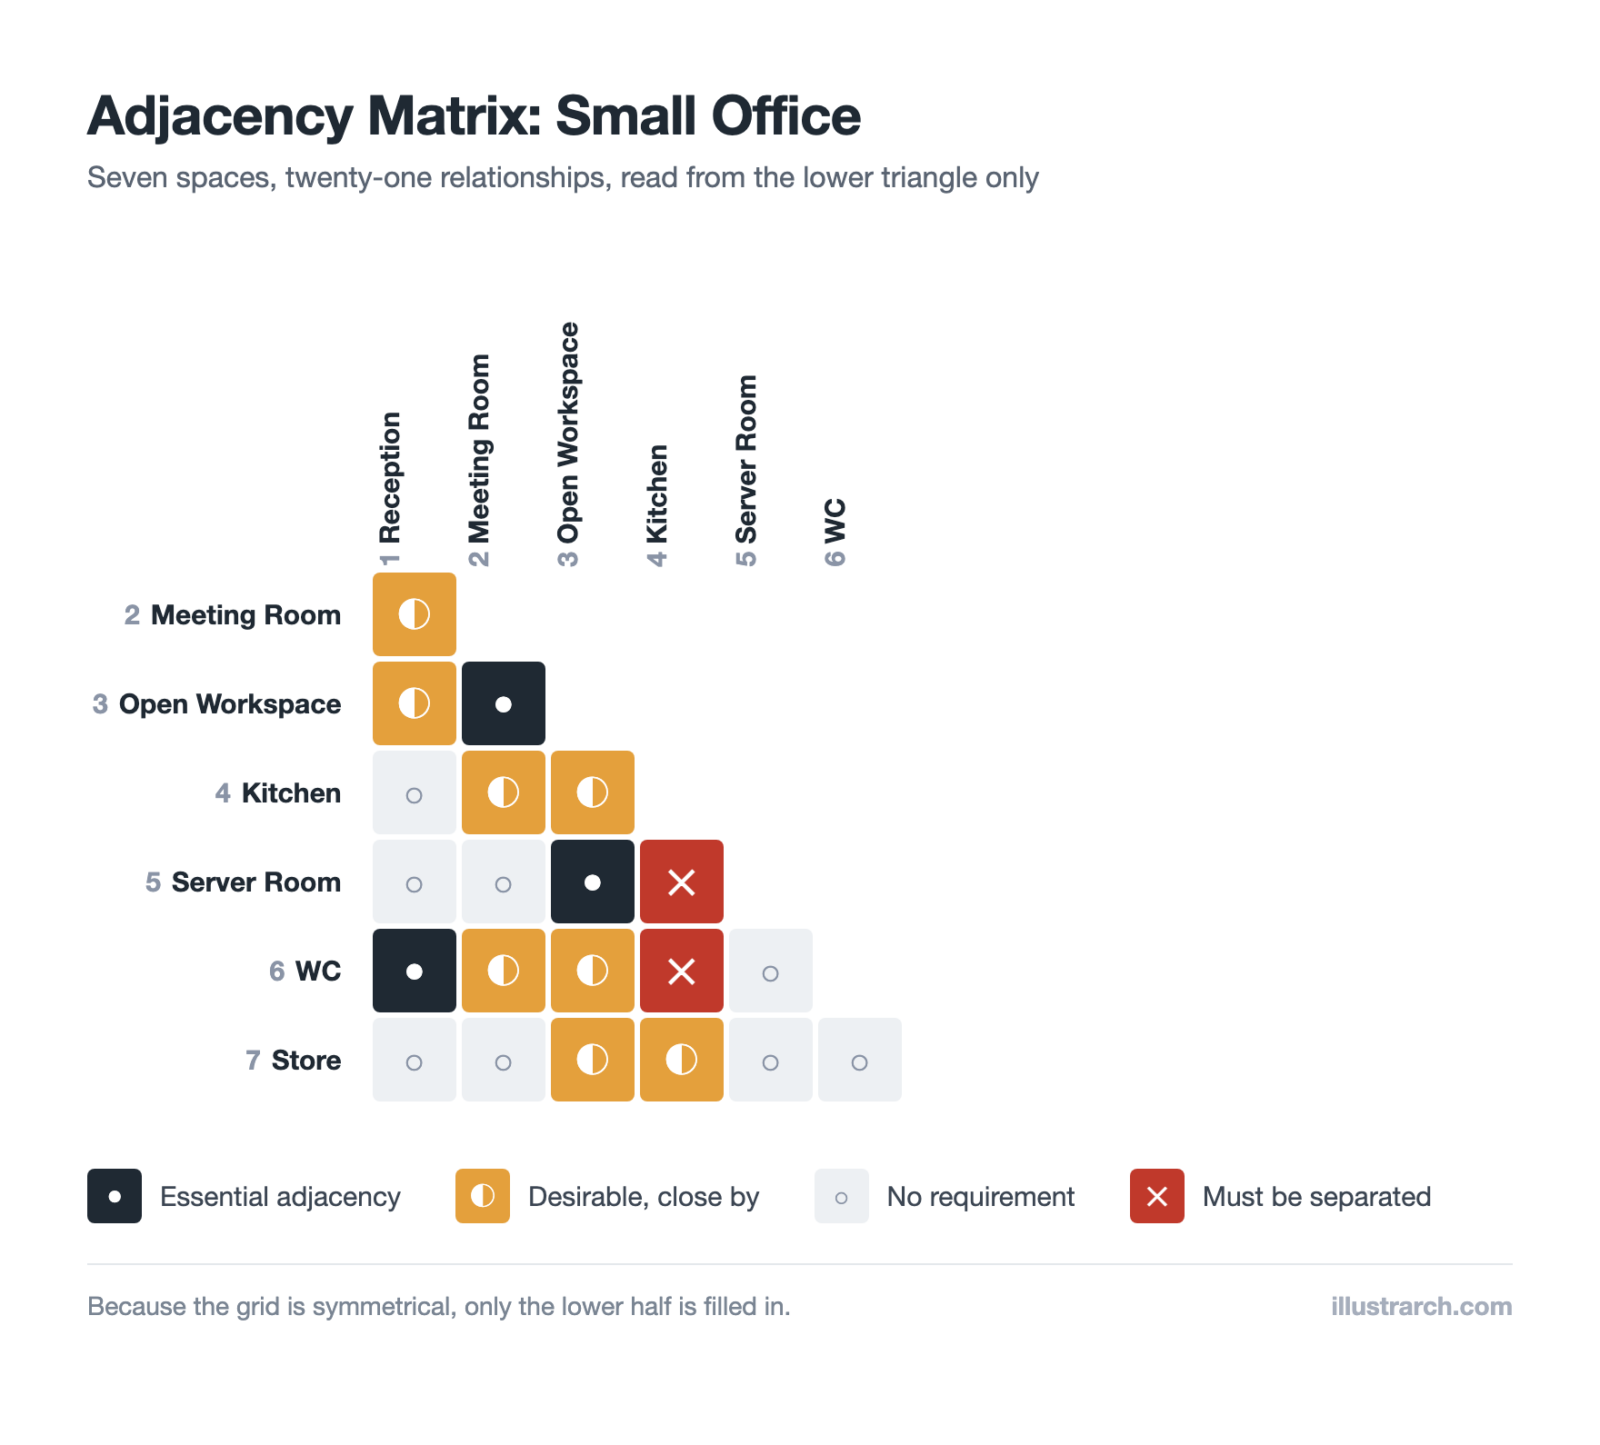
- Adjacency matrices: every space-to-space relationship, settled on a grid.
- Bubble diagrams: space and adjacency before any plan.
- Circulation diagrams: how people move through the building.
- Zoning diagrams: grouping compatible functions.
- Parti diagrams: the single organising idea.
- Concept diagrams: the argument behind the form.
- Programmatic diagrams: the brief turned into areas.
- Spatial organisation diagrams: linear, radial, grid and cluster.
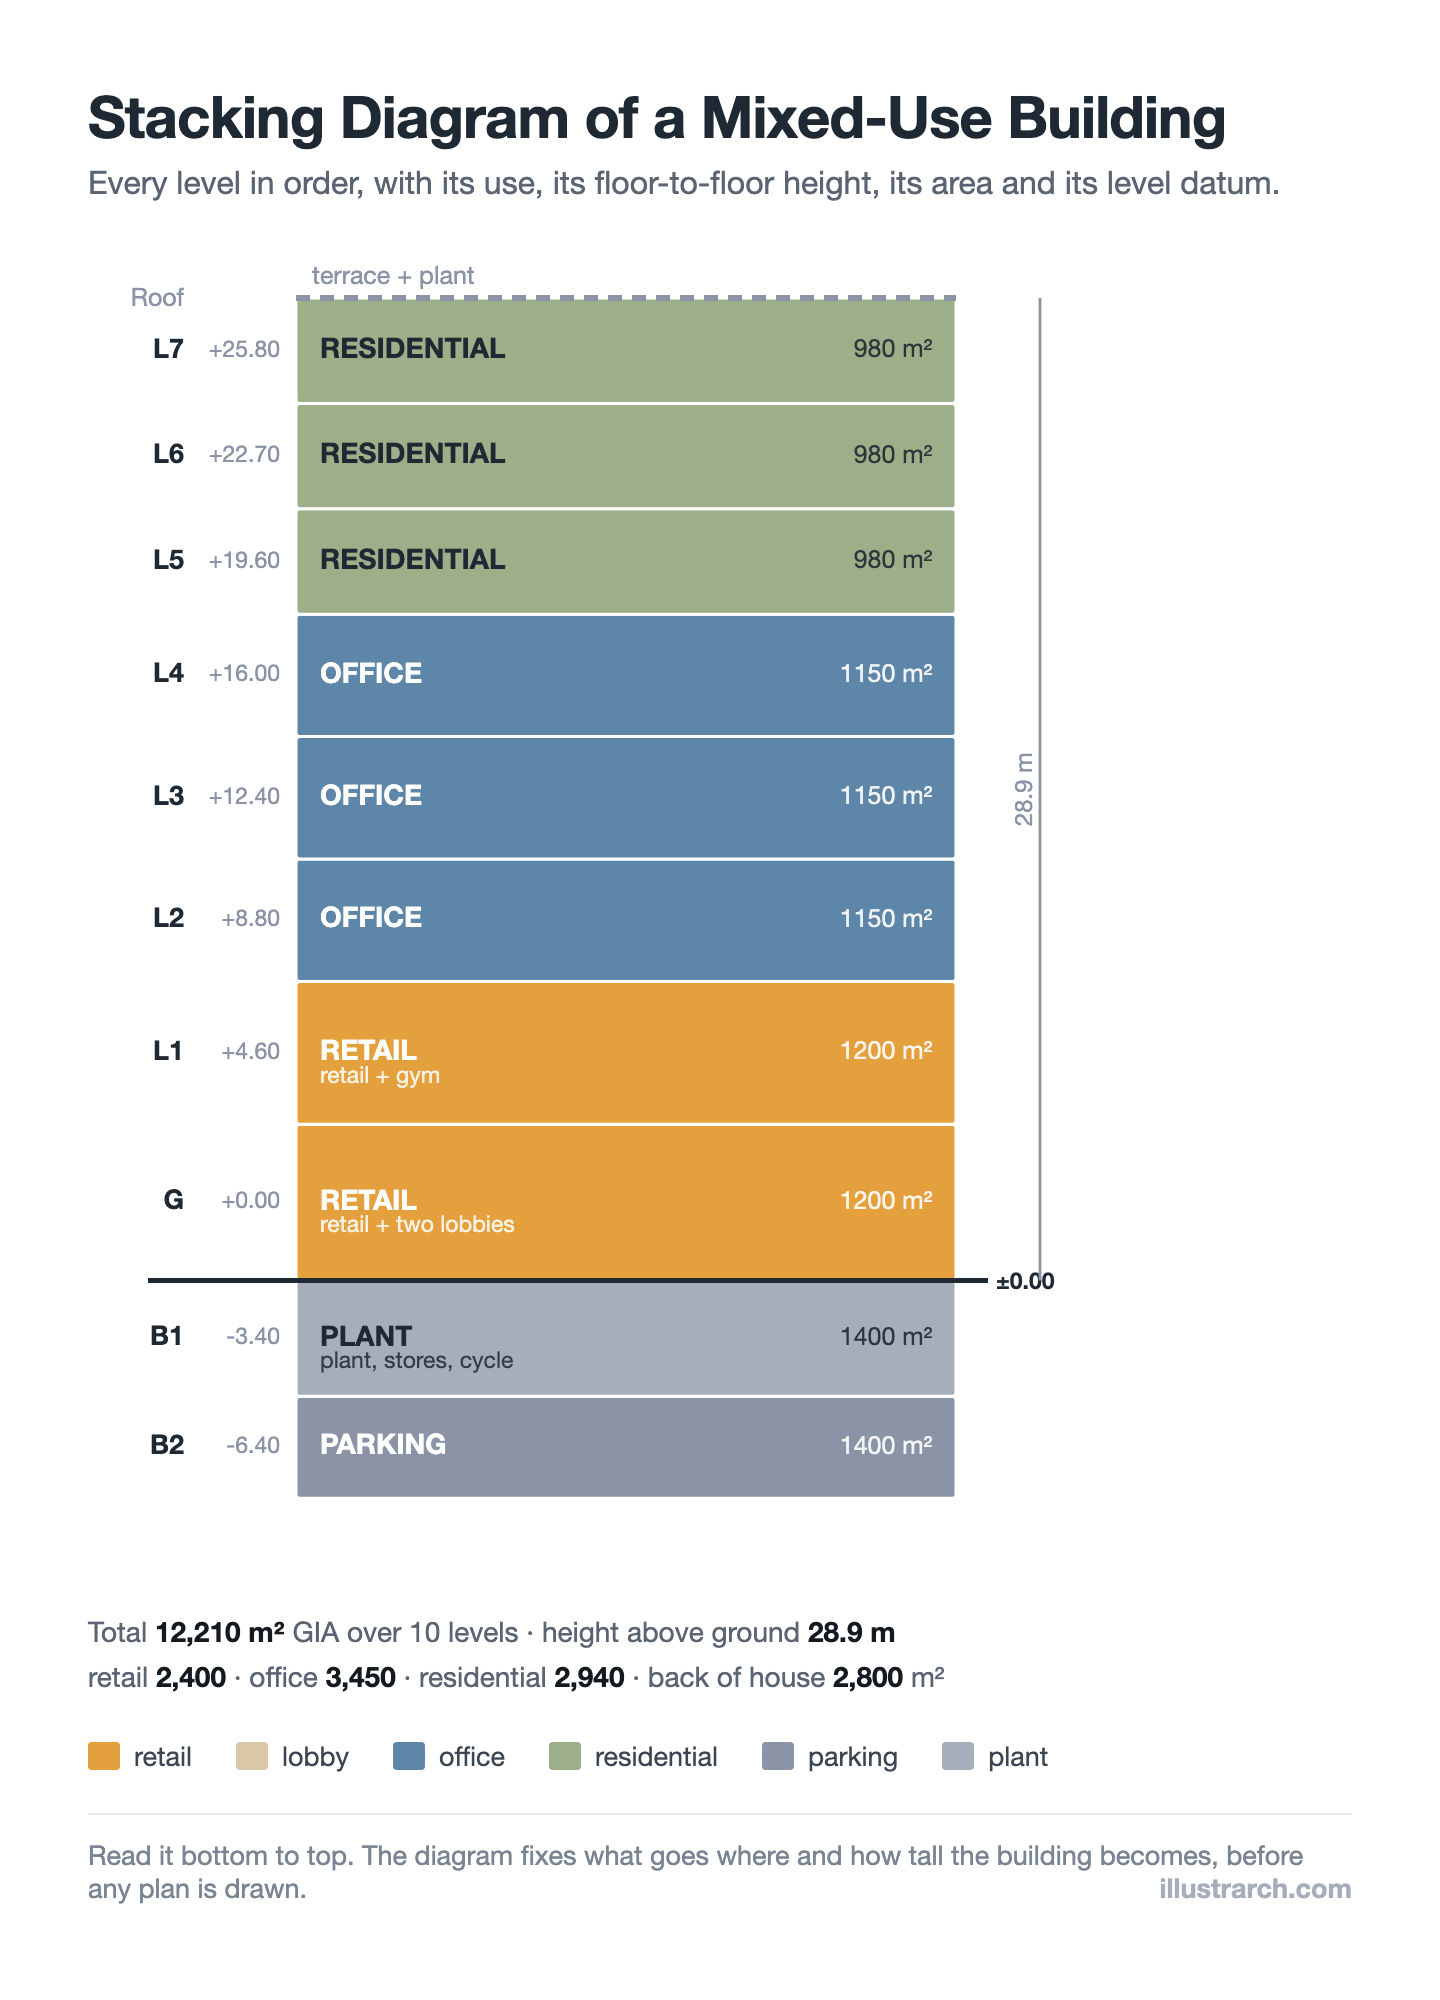
- Stacking diagrams: which use sits on which level.
- Massing diagrams: volume, setback and shadow.
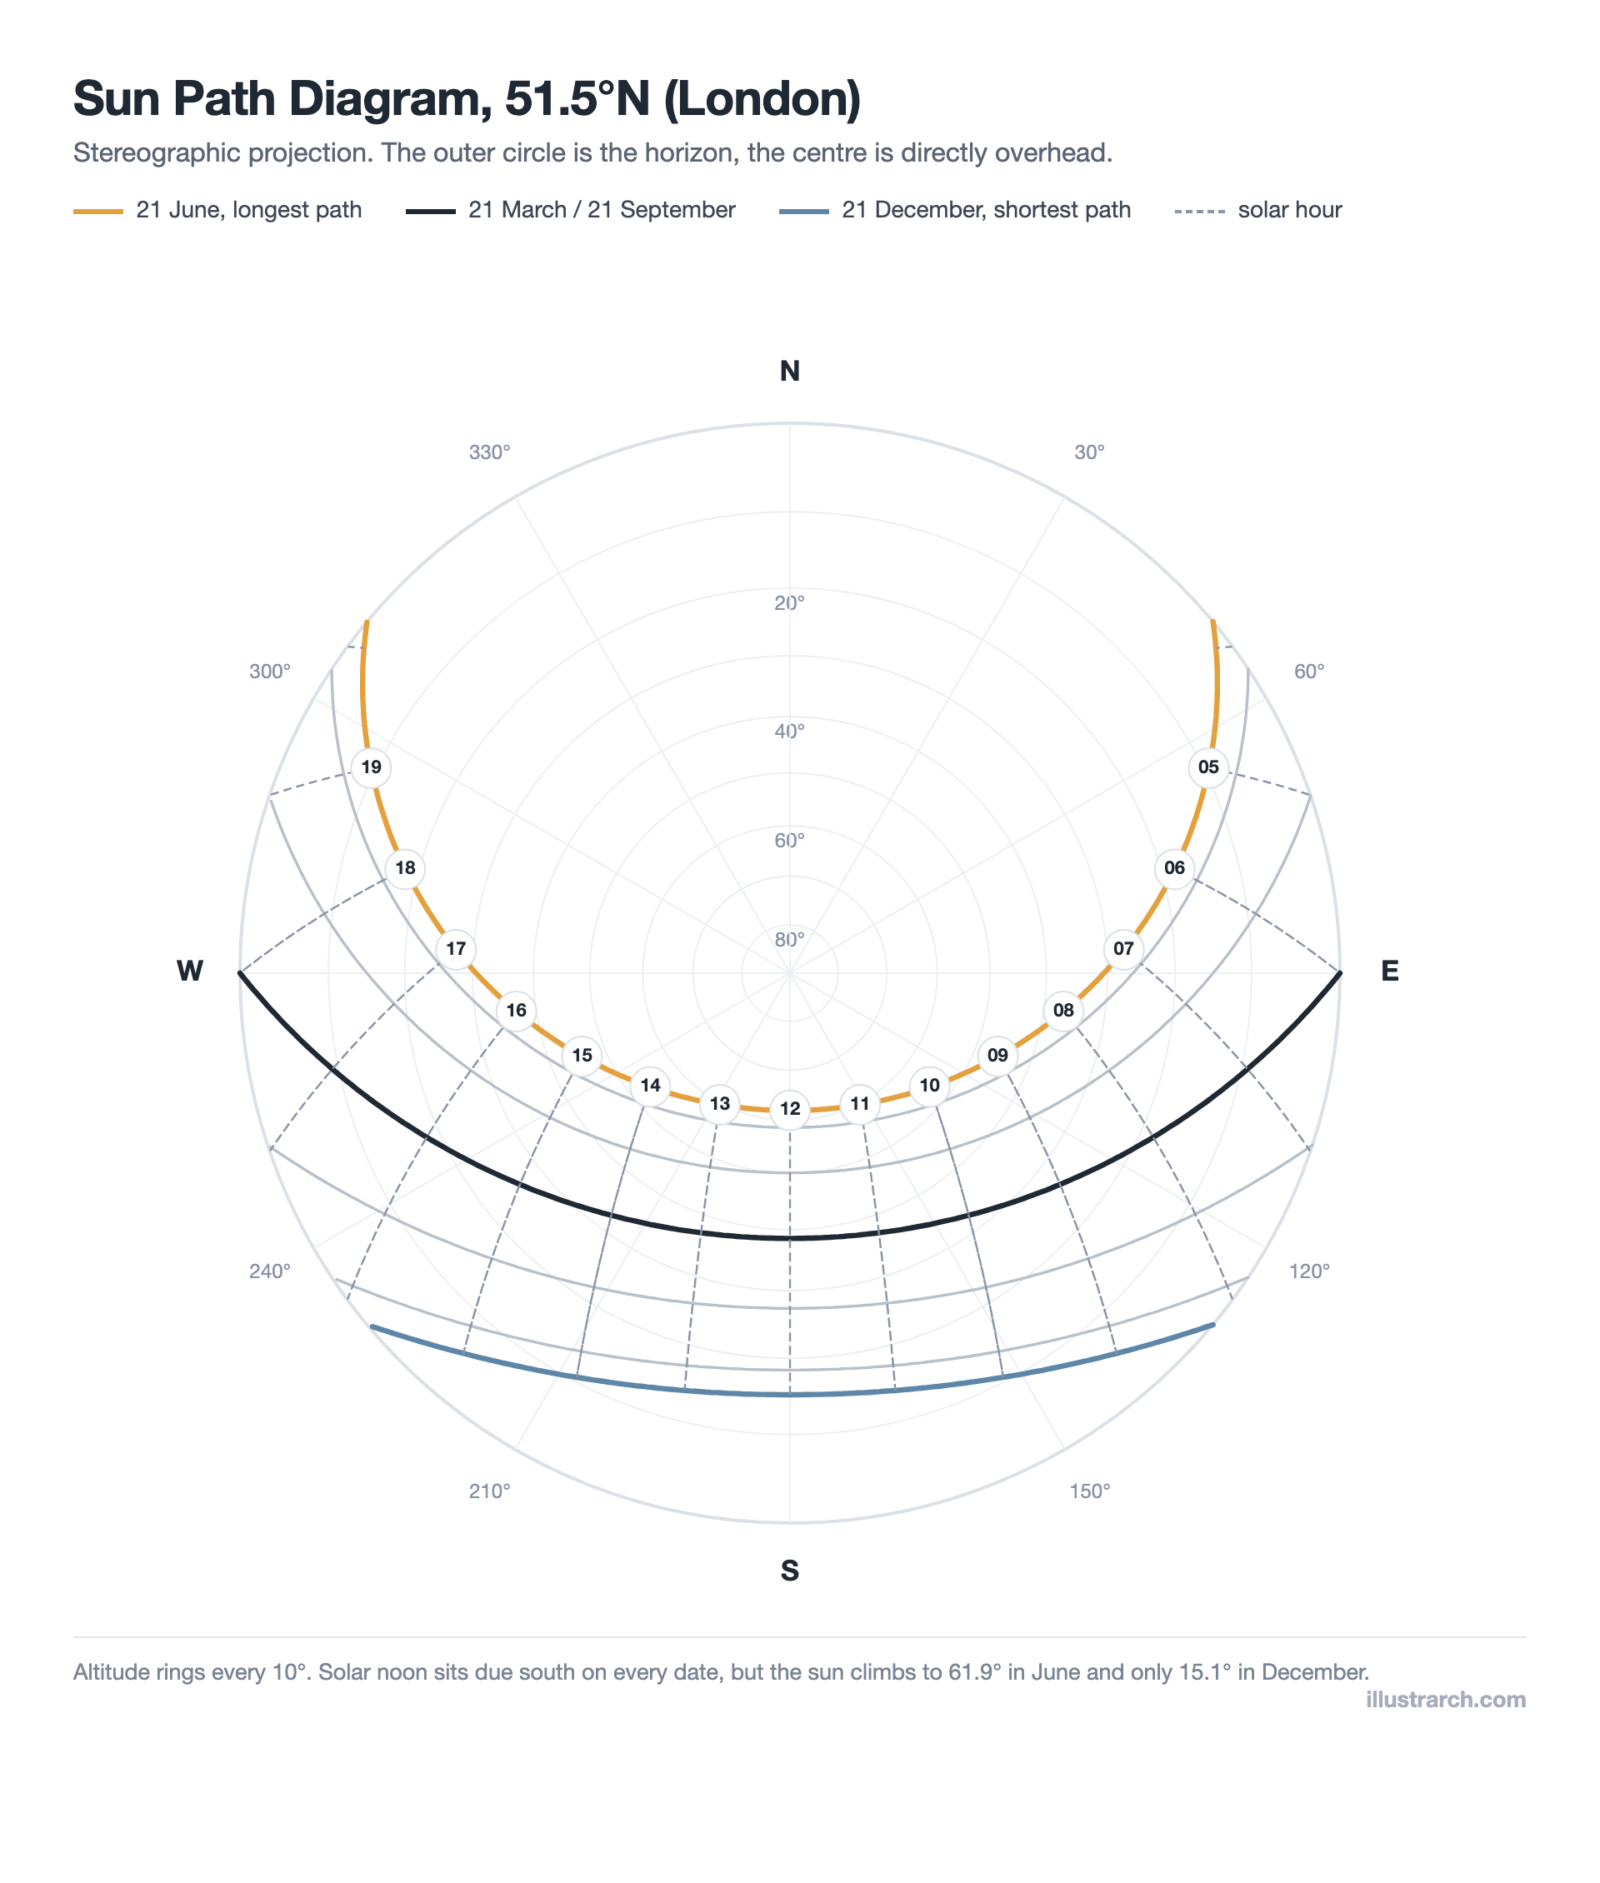
- Sun path diagrams: where the sun sits, hour by hour, all year.
- Figure-ground diagrams: built mass against open space, at city scale.
- Ventilation diagrams: air movement and cross ventilation.
- Axonometric diagrams: three dimensions without perspective.
- Exploded diagrams: layers pulled apart.
- Structural diagrams: how the load reaches the ground.
- Functional relationship diagrams: who needs to be next to whom.
- Circulation flow diagrams: direction and volume of movement.
Zoning diagrams are the step where the plan first takes measured area. Our free zoning diagram maker draws one with five zones and a live area tally.
Adjacency matrices are the drawing that comes before the bubbles. Our free adjacency matrix maker builds one with four relationship levels.
What Are 10 Successful Architectural Diagram Examples?
Below, we explore 10 architecture diagram examples that demonstrate how professional architects and firms use various diagramming techniques to communicate their design ideas effectively. Each architectural diagram example showcases a different approach to visual storytelling in the design process.
1. Creation Diagram – Mass and Design Process
The first example of architectural diagrams that created by architects is a creation diagram. Creation diagrams are used for explaining of architectural design process. In this diagram, we can see the mass creation process and the inside of the building. The architect wants to show sun directions, accessibility, visual communications and circular connections of the building in this diagram. This type of architecture design diagram is particularly effective for presenting the evolution of a building’s form, making it an excellent architecture diagram example for conceptual design presentations.
💡 Pro Tip
When creating a mass creation diagram, build it as a sequence of 4 to 6 steps rather than showing the final form in a single image. Each step should answer one question: what was added, removed, or rotated, and why. Juries and clients follow step-by-step logic far more easily than a single complex diagram with too many annotations layered on top.
2. Context Analysis Diagram
The aim of this architectural diagram is to present the explanation of the context. We can understand the context and environmental conditions of the building. Context analysis is a fundamental step in the architectural diagramming process, as it establishes the relationship between a building and its surrounding environment, including factors such as topography, neighboring structures, and access points.
3. Exploded Axonometric Program Diagram
Credit: (69) Pinterest
Exploded axonometric diagram is one of the good examples of architectural diagrams. In this example, functions are separated in the exploded axonometric view. The colors of the diagrams help us to understand the differences between programs. Then, simple icons make the functions of the building understandable. This is an excellent sample architecture diagram for any architect looking to communicate the program diagram architecture of a multi-functional building. The use of color-coding in program diagrams architecture makes complex spatial relationships instantly readable for both professional and non-professional audiences.
4. Urban Land-Use Analysis Diagram
Urban diagram is another type of architectural diagrams. Urban diagrams are created by macro-scaled urban maps. You can create urban diagrams in 2-dimensional way according to land-use analysis. Colors, texts and simple arrows/icons will help the diagram presentation. Firms such as Sasaki are well known for their sophisticated urban-scale architectural diagram examples that combine data visualization with clear graphic communication.
5. Residential Exploded Axonometric Diagram
Especially in residential buildings, exploded axonometric diagrams are really helpful. In this example, legend and numbers help to improve this diagram. We can see the program relations for each storey of the building. This architecture diagram example demonstrates how an effective architecture program diagram can break down the functional layers of a residence, making spatial organization immediately clear to both clients and design teams.
6. Climatic and Contextual Diagram
The opposite of the other examples, there is no explanation text and icon in this diagram. This diagram was created to show climatic features on context. We can understand from this diagram the wind, sun, rain conditions and accessibility of the building. Climatic diagrams are essential building diagrams that demonstrate how environmental factors influence design decisions, an increasingly important consideration as sustainable architecture continues to gain prominence. Architectural diagramming that incorporates environmental data strengthens the overall design narrative and supports evidence-based decision-making.
7. Sustainability Systems Diagram
Sustainable systems should be explained in architectural diagrams as well as in this example. Sustainable architectural solutions are complex and sometimes tough to understand. For that reason, sustainability diagrams are used for a good architectural presentation. These types of architecture diagrams examples are increasingly important as sustainable design becomes a standard requirement in modern architectural practice. A well-designed sustainability diagram translates technical systems, such as passive ventilation, rainwater harvesting, or solar orientation, into visual language that any stakeholder can grasp.
📐 Technical Note
When diagramming passive cooling or solar strategies, orient your diagram to true north and include a simple sun path arc showing summer and winter solstice angles. The ASHRAE 90.1 standard and USGBC LEED guidelines both reference solar orientation as a key metric in energy performance documentation. Including this reference in your sustainability diagram adds technical credibility to the design narrative.
8. Three-Dimensional Urban Diagram
3 dimensional urban diagrams are also examples of urban diagrams like in the previous example. In this diagram, we can see the different facilities and scenarios of the buildings in an urban-scale. Three-dimensional urban building diagrams offer a perspective that 2D maps cannot provide, revealing the volumetric relationships between structures and the spatial quality of streets and public spaces. For more on how different diagram types in architecture are applied at various scales, exploring a range of architectural diagram examples is highly recommended.
9. Planimetric Program Diagram
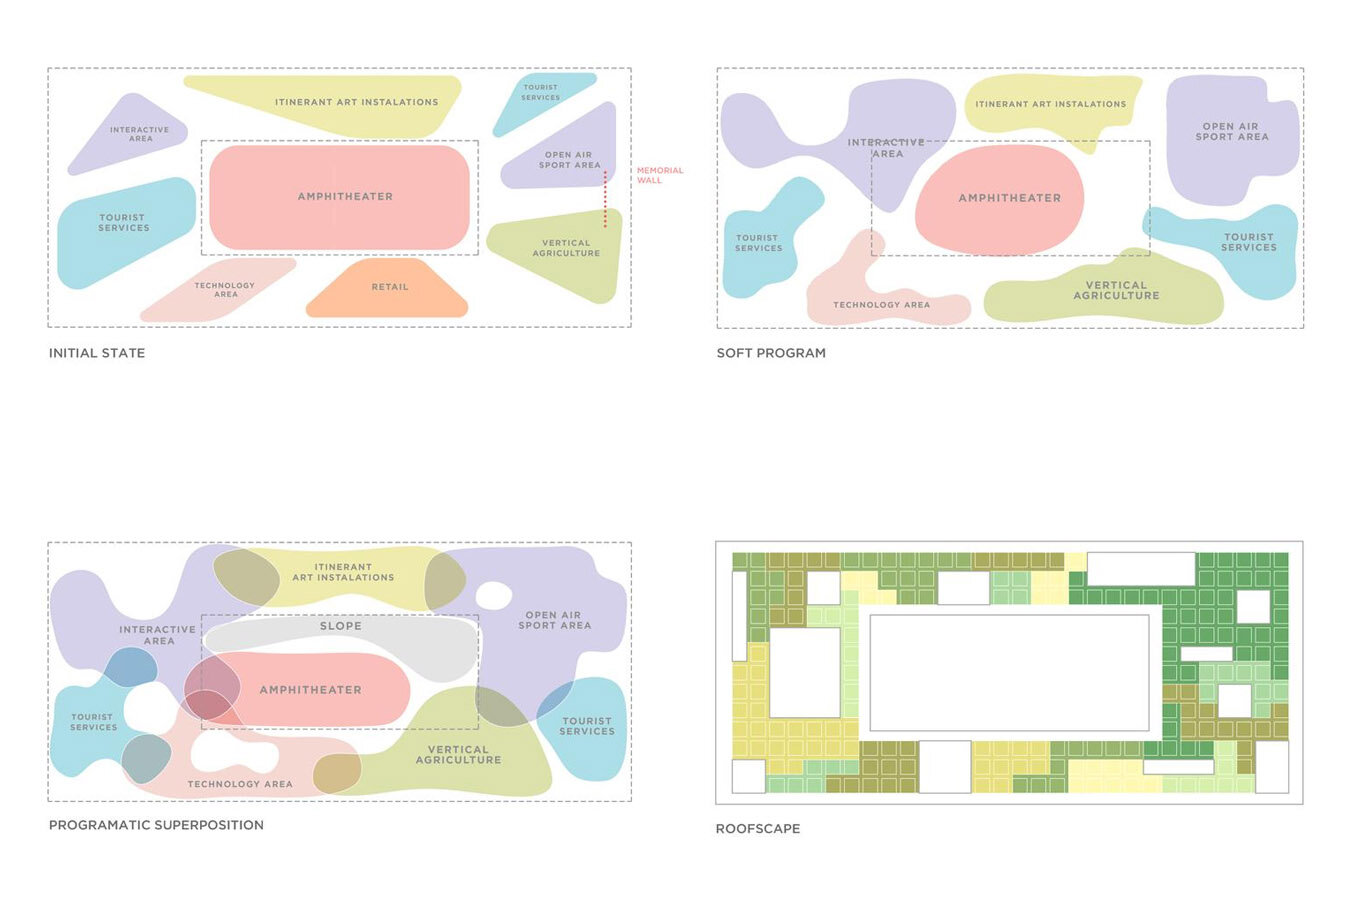
Planimetric diagrams are used to explain programs and their relations between each other in the architectural spaces. A planimetric program diagram architecture approach uses plan-view graphics to depict spatial allocation, adjacency, and functional zoning. These architectural diagram examples are among the most commonly used by both students and professionals because they directly correspond to the floor plan, the most fundamental representation in building design.
10. Sectional Diagram

You can create sectional diagrams instead of technical section drawings. Sectional architecture diagrams reveal what plan views cannot: the vertical relationships between floors, ceiling heights, structural elements, and the interplay of interior and exterior spaces. They are particularly valuable for communicating how light enters a building or how different program zones stack vertically.
Bonus: Exploded Isometric View

The exploded isometric view is a powerful architectural diagramming technique that separates a building into its individual layers, including structure, envelope, circulation, and services, so that each system can be examined independently. This sample architecture diagram approach is widely used in competition boards and student presentation sheets to demonstrate a thorough understanding of building systems.
⚠️ Common Mistake to Avoid
A common error in exploded isometric and axonometric diagrams is pulling apart the layers so far that their spatial relationship becomes unclear. The explosion distance should be consistent and proportional, enough to distinguish each layer visually but not so much that the viewer loses the sense of how they stack or connect. Keep structural layers closest to each other, and reserve more separation for systems like MEP or envelope cladding.
How to Create an Architecture Diagram: Step-by-Step
Learning how to make an architecture diagram effectively involves a structured process. Whether you are a student working on your first project or a professional refining your workflow, these nine steps will guide you through how to draw an architecture diagram from start to finish.
Step 1: Define the Purpose and Scope
The first step in creating an architecture diagram is to define the purpose and scope of the diagram. This will help to determine what information needs to be included and the level of detail required. Consider the audience for the diagram, what questions it needs to answer, and the level of technical detail required. A concept diagram for a client meeting requires a different approach than a detailed architecture design diagram for construction documents.
Step 2: Identify the Components
Identify the components that need to be included in the diagram. This may include the building or structure, the surrounding environment, and any other relevant features. Consider the relationships between the components and how they interact with each other. At this stage, creating a simple list or matrix of spaces, similar to the early steps of creating bubble diagrams, can help you organize your thinking before drawing.

Step 3: Choose the Right Tool
Choose the right tool for creating the architecture diagram. There are many different tools available, including paper and pencil, whiteboards, software applications, and online tools. Popular software for architectural diagramming includes AutoCAD, SketchUp, Adobe Illustrator, Revit, and Rhino. For quick conceptual work, even a simple architectural sketch on paper can be the most effective starting point. Consider the level of detail required, the complexity of the diagram, and the intended audience when choosing a tool.
Step 4: Create a Rough Sketch
Create a rough sketch of the architecture diagram. This will help to visualize the components and their relationships. Consider the layout of the diagram and the visual hierarchy of the information. As noted in our guide on moving from concept sketch to blueprint, rough sketches do not need to be polished. They simply need to get ideas out of your head and onto paper.
Step 5: Refine the Sketch
Refine the rough sketch of the architecture diagram. Add more detail to the components and their relationships. Use labels and annotations to provide additional information. This is the iterative stage where diagrammatic architecture takes shape. You may need to rearrange elements multiple times before the spatial logic feels right.
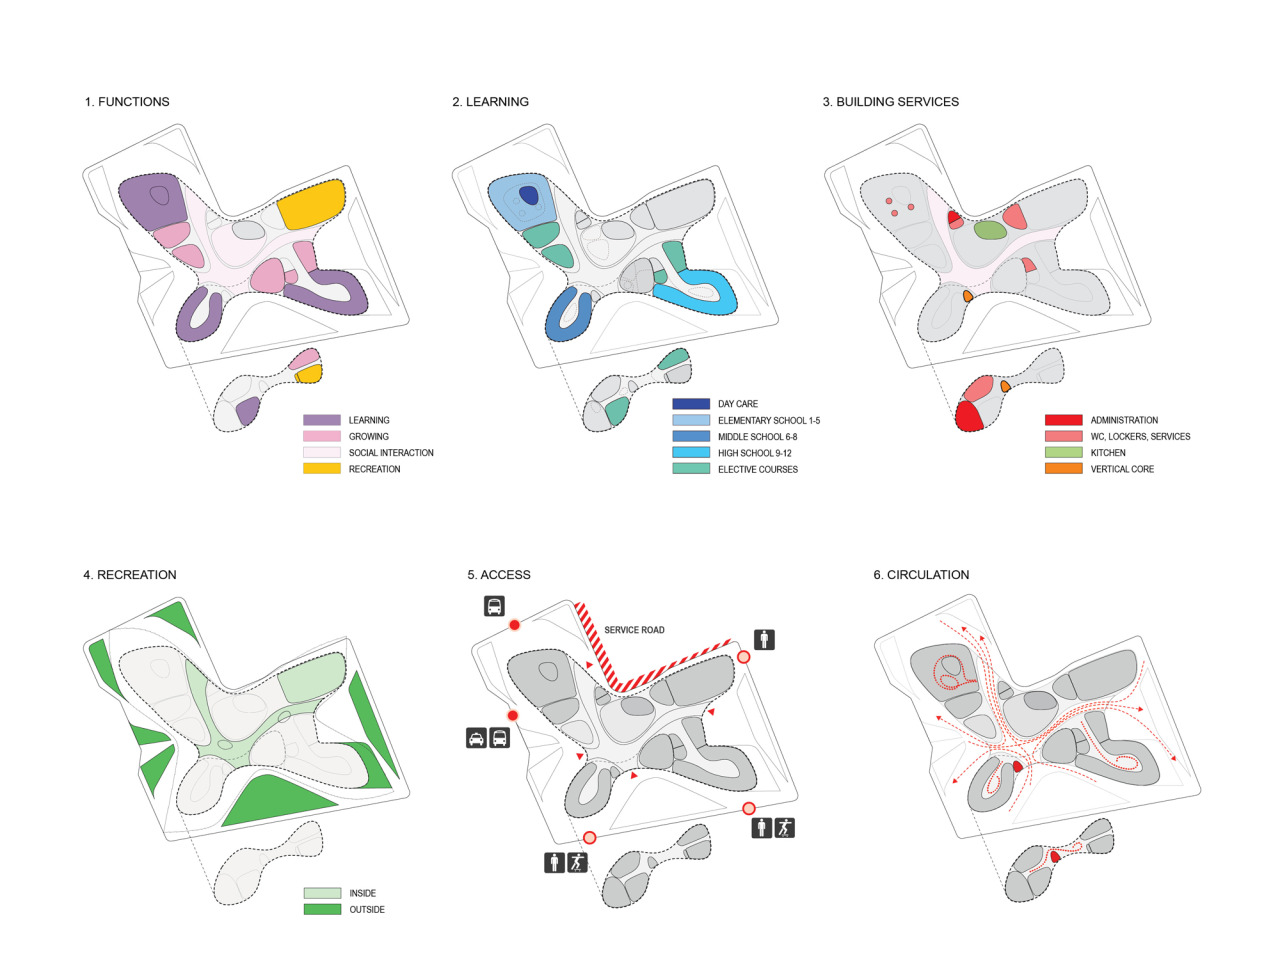
Step 6: Use Standard Symbols and Notations
Use standard symbols and notations to represent the components in the architecture diagram. This will help to ensure consistency and make it easier for others to understand the diagram. Organizations like the Royal Institute of British Architects (RIBA) and the AIA provide guidelines on architectural drawing conventions that can inform your diagramming language.
Step 7: Add Details
Add additional details to the architecture diagram, such as measurements, materials, and annotations. This will help to provide a fuller understanding of the components and their relationships. The level of detail should match the diagram’s purpose. A concept diagram in architecture requires less detail than a construction-phase diagram.
Step 8: Review and Revise
Review and revise the architecture diagram as necessary. Consider feedback from others and make changes to improve clarity and understanding. This collaborative review process is one of the key benefits of architectural diagrams. They create a shared visual language that facilitates productive discussion among diagram architects, engineers, and clients.
Step 9: Finalize the Diagram
Finalize the architecture diagram and ensure that it is clear, concise, and accurate. Consider the intended use of the diagram and ensure that it meets the needs of the intended audience.
⚠️ Common Mistake to Avoid
A frequent error in architectural diagramming is overloading a single diagram with too much information. Including circulation, structure, materials, and program zones all in one drawing creates visual noise that hides the main idea. Instead, create one focused diagram per concept, then layer them as a set. Clarity comes from restraint, not from showing everything at once.
Tools for Creating Architecture Diagrams
Selecting the right tool depends on your project stage, required output quality, and personal workflow. Here is an overview of popular options for how to construct a diagram in architecture:
| Tool | Best For | Skill Level |
|---|---|---|
| Pencil and paper | Quick concept exploration | Beginner to advanced |
| Adobe Illustrator | Polished presentation diagrams | Intermediate |
| AutoCAD / Rhino | Precise technical diagrams | Intermediate to advanced |
| SketchUp | 3D massing and exploded views | Beginner to intermediate |
| Bubble Diagram Maker / Miro | Collaborative early-stage diagrams | Beginner |
| Figma | Collaborative vector diagrams | Beginner to intermediate |
Hand sketching: Paper and pencil remain the fastest way to explore ideas. Architectural sketching fosters creative thinking and is ideal for early concept development.
Digital design software: Programs like AutoCAD, Revit, and Rhino offer precision and scalability for producing detailed architecture design diagrams. Learn more about how technology is transforming modern architecture workflows.
Graphic design tools: Adobe Illustrator, Photoshop, and InDesign are widely used for creating polished presentation-quality diagrams with rich visual styling. For Illustrator-specific advice, our 10 Illustrator tips for architecture students covers shortcuts that speed up diagramming work.
Online diagramming platforms: Browser-based tools like our Bubble Diagram Maker, Miro, Figma, and Lucidchart offer collaboration features and quick diagram creation without installing software.
💡 Pro Tip
In Illustrator or Figma, build each diagram element on a separate layer (one layer for site boundary, another for circulation arrows, another for program zones). This way you can toggle visibility and produce three or four focused diagrams from one master file, instead of redrawing each time.
Architecture Diagram Examples and Best Practices
Looking at real-world architecture diagram examples can accelerate your learning. For inspiration, our collection of 10 successful architectural diagrams by architects presents work from leading professional studios. Here are some best practices drawn from professional experience and established design principles in architecture:
Keep it simple: The most effective diagrams communicate one idea clearly. Avoid overloading a single diagram with too much information. Instead, create multiple focused diagrams that each address a specific aspect of the design.
Use a consistent visual language: Select a limited color palette, consistent line weights, and clear labeling conventions. Stick with them throughout your diagram set to maintain readability.
Layer information progressively: Start with a high-level architecture graph or overview, then create more detailed diagrams that zoom into specific areas or systems. This progressive disclosure approach, similar to the C4 model used in software architecture, works equally well for building design.
Include a legend: Always provide a key that explains the symbols, colors, and line types used in your diagram. This ensures anyone reviewing the diagram can interpret it accurately.
Think about hierarchy: Use size, position, and visual weight to communicate the relative importance of different elements in your diagram architecture.
For additional inspiration, studying successful presentation sheets by architecture students shows you how diagrams are integrated into complete presentation boards where they work alongside plans, sections, and renders.
🏗️ Real-World Example
Markthal Rotterdam by MVRDV (2014): The Dutch firm is known for using diagrams as the primary storytelling device for their projects. For Markthal, MVRDV used a sequence of simple “addition” diagrams to explain how a horseshoe-shaped housing block was wrapped around a public market hall. Architizer documents several of MVRDV’s signature diagrams, showing how a few abstract shapes can carry an entire design narrative.
🎓 Expert Insight
“By the way, everyone in our office makes their own diagrams. No diagram monkeys here.” (MVRDV studio note, Pinterest archive)
This casual remark reflects an important principle: diagramming is not a task to delegate to junior staff once the “real” design is finished. The act of diagramming is the design thinking itself, which is why senior architects at studios like MVRDV insist on drawing their own diagrams.
ArchDaily’s site analysis collection is a useful place to see how practices present analytical diagrams in real project pages.
How to Present Architecture Diagrams Effectively
Creating a strong diagram is only half the work; presenting it so the audience absorbs the idea quickly is equally important. When building a presentation board, position your diagrams at the top or left side of the layout, since viewers typically read boards in that direction. Arrange diagrams in a logical sequence: site context first, then concept, then program, then circulation, then detail-level views like sections or exploded axonometrics.
Each diagram should have a clear, short title and a minimal legend. Avoid writing long captions that explain what the diagram should already show visually. If you need a paragraph to explain the diagram, the diagram itself likely needs simplification.
For digital presentations, consider animating diagram sequences so each layer builds on the previous one. This step-by-step reveal mirrors the design thinking process and keeps the audience engaged. Our article on structural diagrams in architecture shows how layered presentation techniques work in practice.
✅ Key Takeaways
- An architecture diagram simplifies complex spatial and functional ideas into a readable visual that anyone on a project team can understand.
- Different diagram types (concept, parti, bubble, circulation, site, block, program, exploded axonometric) serve different stages of the design process, so choose the diagram that matches your goal.
- Follow a structured nine-step process: define purpose, identify components, choose tools, sketch, refine, use standard symbols, add details, review, and finalize.
- Keep each diagram focused on one idea, use a consistent visual language, and always include a legend for clarity.
- Diagramming is a thinking tool, not just a presentation tool. Drawing your own diagrams sharpens your design reasoning more than any rendering ever will.
Architecture Diagram vs. Technical Drawing: Key Differences
One of the most common questions from students is how an architecture diagram differs from a technical drawing. The distinction matters because it determines what level of detail and precision you should aim for.
A technical drawing (floor plan, section, construction detail) is measured, scaled, and annotated with specific dimensions, material call-outs, and code references. It tells a builder exactly what to construct. An architecture diagram, on the other hand, is a communication tool that shows the thinking behind the design, not the precise measurements needed to build it. Diagrams strip away technical noise so the underlying logic of spatial organization, circulation flow, or structural concept comes through clearly.
| Criteria | Architecture Diagram | Technical Drawing |
|---|---|---|
| Purpose | Communicate ideas and relationships | Instruct construction |
| Level of detail | Abstract, simplified | Precise, dimensioned |
| Primary audience | Clients, juries, team members | Contractors, engineers, code officials |
| Typical stage | Concept through design development | Construction documentation |
| Scale accuracy | Approximate or proportional | Exact to specified scale |
In practice, the two work together. You begin with diagrams to explore and communicate spatial logic, then translate those ideas into precise technical drawings during later project phases. Our article on the art of architecture diagramming covers this transition in more depth.
How Do Architectural Diagrams Differ in Practice vs. Student Work?
There is a notable difference between how architectural diagrams are used in professional practice and in academic settings. In professional contexts, architecture diagrams are often tailored for client communication, emphasizing clarity, simplicity, and the value proposition of a design. Firms like BIG (Bjarke Ingels Group) have become renowned for their narrative-driven diagramming style, where a sequence of diagrams tells the story of how a building’s form emerged from site conditions and program requirements.
In academic environments, students are often expected to produce more exploratory and analytical architectural diagram examples that demonstrate a deep understanding of design principles. Program diagrams architecture, site analysis overlays, and circulation studies are common components of student presentation boards. Understanding the most used architectural diagram types will help students select the right visual tools for their projects.
Students looking to build a comprehensive foundation should also read our architectural diagrams guide for students, which covers bubble diagrams, circulation diagrams, and concept diagrams with step-by-step guidance.
Whether in a firm or a studio, the underlying goal of every architecture diagram is the same: to translate complex spatial ideas into clear, compelling visual narratives that advance the design conversation.
✅ Key Takeaways
- Architectural diagrams communicate design intent that technical drawings alone cannot convey, covering program, circulation, context, and sustainability in visual form.
- The seven main diagram types (planimetric, sectional, circulation, sustainability, axonometric, perspective, and urban) each serve a specific purpose in the design process.
- Exploded axonometric and isometric views are among the most effective tools for showing building systems and program layers simultaneously.
- Color-coding, consistent iconography, and a single clear purpose per diagram are the three core principles of effective architectural diagramming.
- Professional firms like BIG and Sasaki use sequential diagram narratives to tell the story of how a design decision was made, making their diagrams as persuasive as they are informative.
- Both students and professionals benefit from studying real architecture diagram examples before creating their own, as pattern recognition accelerates the development of diagrammatic thinking.
Download Architectural Diagrams eBook
Common Mistakes Students Make with Architectural Diagrams
Even with the right knowledge, a few recurring pitfalls trip up architecture students. Avoid these and your diagrams will immediately look more professional.
Overloading a single diagram. Trying to show everything at once creates visual noise. Split complex information across multiple focused diagrams instead.
Ignoring the legend. If you use dashed lines, colored fills, or different arrow types, explain them. Assume your viewer has no context, because in a pin-up or portfolio review, they often do not.
Skipping iteration. Many students draw one diagram and move on. Experienced designers produce five or six versions before selecting the clearest one. The editing process is where good diagrams become great.
Using diagrams only for presentation. Diagrams are most powerful as design tools, not decoration. Start diagramming from day one of a project, not the night before the review. You can learn more about how to use diagrams throughout the design process at learnarchitecture.net, which offers additional resources for architecture students.
How Do You Choose the Right Type of Architectural Diagram?
Choosing the right diagram depends on what you need to communicate and the stage of design. Early on, bubble and parti diagrams help explore relationships and the core idea; as the design develops, circulation, zoning and programmatic diagrams clarify how spaces work; and for presentation, axonometric, section and exploded diagrams explain form and construction. Match the diagram to the question you are trying to answer, and keep each one focused on a single idea so it stays easy to read.
From Diagrams to Design: Building Your Visual Toolkit
Architectural diagrams are not a separate task you complete and forget. They are woven into every stage of the design process, from the first site visit to the final presentation board. The bubble diagram you sketch on a napkin during a coffee break might evolve into the circulation diagram that defines your floor plan, which in turn feeds the sectional diagram that reveals your building’s spatial character.
Start building your own library of diagram techniques now. Save examples from competition boards, textbooks, and online resources. Practice translating your design ideas into quick graphic form at every opportunity. Over time, diagramming will become second nature, a way of thinking visually that strengthens every project you tackle. For more tutorials and guides on architectural representation, explore our full architectural diagrams archive and visit learnarchitecture.online for additional learning materials.

Frequently Asked Questions
Common types include bubble, parti, circulation, axonometric, section, structural and zoning diagrams.
They turn complex ideas into clear visuals, helping architects study relationships, explain decisions and present designs.
Reduce the idea to simple shapes and lines, keep each diagram focused on one idea, and label it clearly.
Related Guides
- Architectural Section Drawings: 10 Best Examples
- From Bubble Diagram to Floor Plan
- Bubble Diagram Examples: Annotated Samples
- Bubble Diagram for Hospital Design
- Bubble Diagram for School Design
- Concept Diagrams in SketchUp
- Architectural Presentation Sheets
- Top 10 Architecture Student Websites
- What Subjects Do You Need to Study Architecture?
Last updated:


2 Comments





Stacking Diagram: How to Allocate Uses Floor by Floor
A stacking diagram assigns each use in a brief to a level,...
 Sinan Ozen6 Mins read
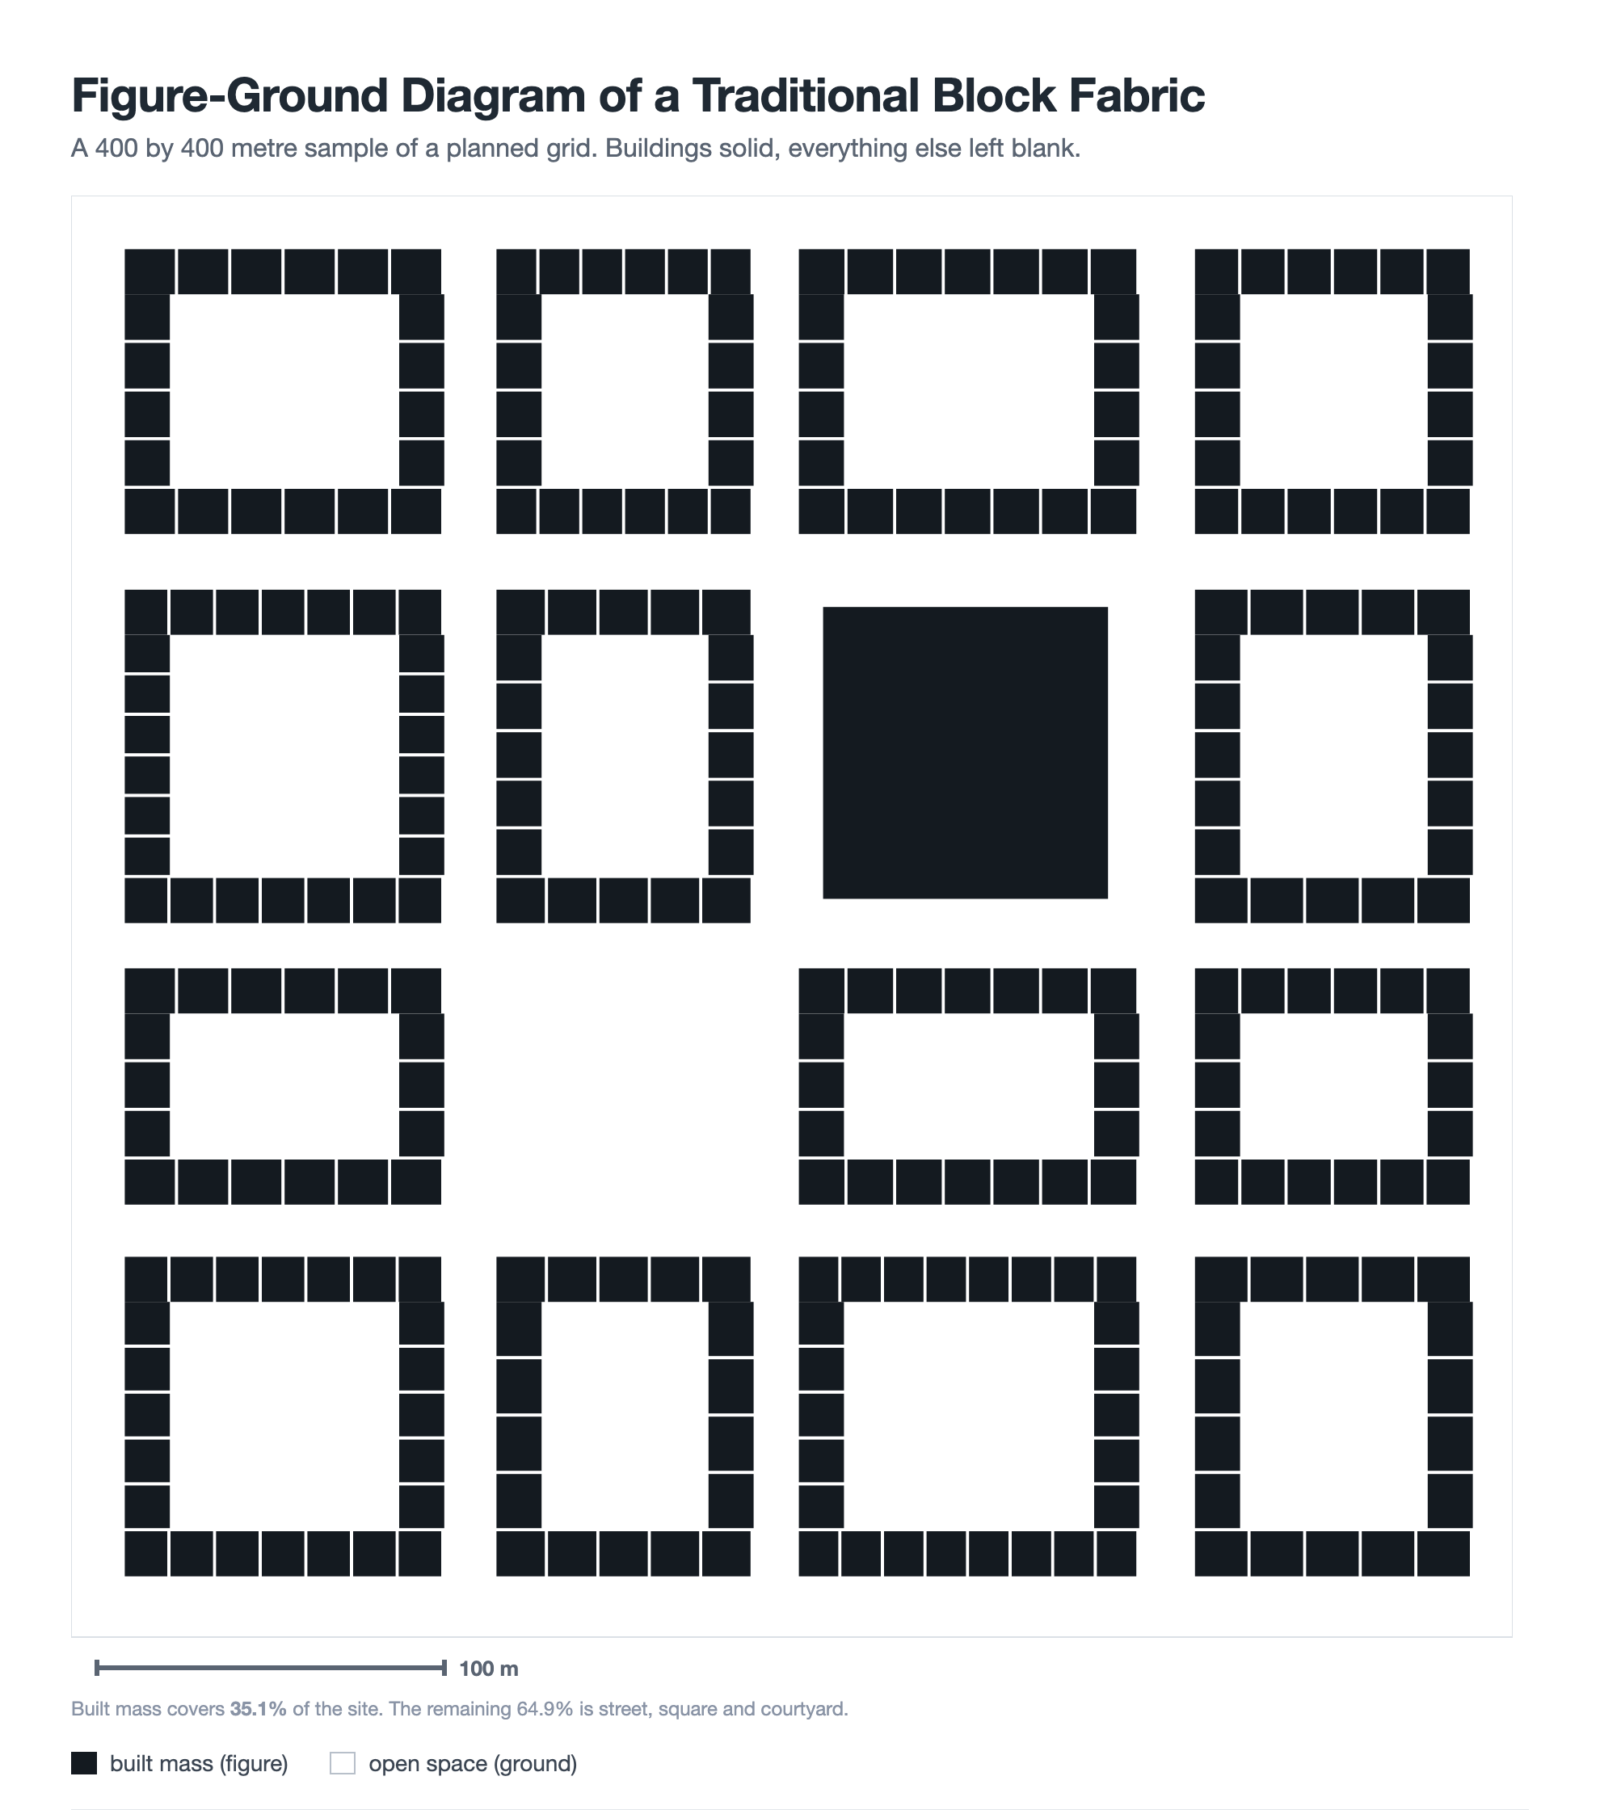
Figure-Ground Diagram: How to Draw and Read Urban Fabric
A figure-ground diagram reduces a city to built mass against open space....
Sinan Ozen7 Mins read
Sun Path Diagram: How to Read One and Use It in Design
A sun path diagram shows where the sun sits all year for...
Sinan Ozen8 Mins read
Matrix Diagram in Architecture: How to Map Space Adjacencies
A matrix diagram, or adjacency matrix, maps how every space in a...
Sinan Ozen8 Mins read




This article talks about architectural diagrams and their types. I think it’s good to know how they help architects and students. The examples seem interesting, but I don’t know much about architecture.
This article talks about architectural diagrams. It seems like they are useful for showing how buildings will look. There are different types mentioned, which is interesting.